Anchore Enterprise is an SBOM-powered (Software Bill of Materials) solution that enables continuous analysis of applications from cloud-native deployments to legacy on-prem installations for security an compliance issues. It provides continuous visibility into supply chain security risks. Anchore Enterprise takes a developer-friendly approach that minimizes friction by embedding automation into development toolchains to generate SBOMs and accurately identify vulnerabilities, malware, misconfigurations, and secrets for faster remediation.
Start by going to the Overview of Anchore Enterprise to learn more about the basic concepts and functions.
If you already have an Anchore Enterprise deployment and want to get started with common tasks, consider looking at our Quickstarts.
For information about deploying and operating an Anchore Enterprise instance:
Anchore Enterprise plays a crucial part in meeting Federal Authorization to Operate (ATO) requirements and Risk Management Framework (RMF). From implementation, assessment, to monitoring, Anchore Enterprise bakes in security compliance, vulnerability & malware scanning by constantly checking registries and running images to protect and enhance security posture. As industry continues to migrate to containerization and microservices, Anchore Enterprise supports multiple regulatory requirements using software bill of materials (SBOM) and policy as code to meet the demands through automated policy enforcement and continuous monitoring. SBOMs are vital to comply with Executive Order (EO) 14028 and understanding software inventory (NIST 800-53, 800-171, 800-218, and 800-190). As software delivery changes so should the ATO process by using code to ensure secure, quality, and reproducible results. Anchore Enterprise allows organizations to shift left, start secure, bake in compliance, and standardize security across the container, filesystem, virtual machine (VM), and SBOM landscape.
Security Controls
The security controls are described below with hyperlinks to the applicable documentation.
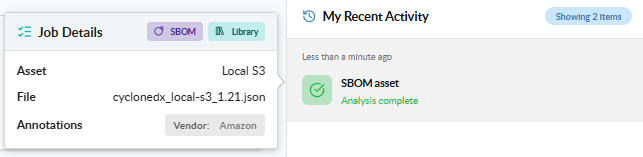
SBOM is essentially the ingredient list for a software product allowing the consumer to understand and manage the associated risks. Anchore Enterprise generates SBOMs during analysis and accepts externally supplied SBOMs as assets attached to app versions. SBOMs are used to maintain compliance with CM-8 Information System Component Inventory.
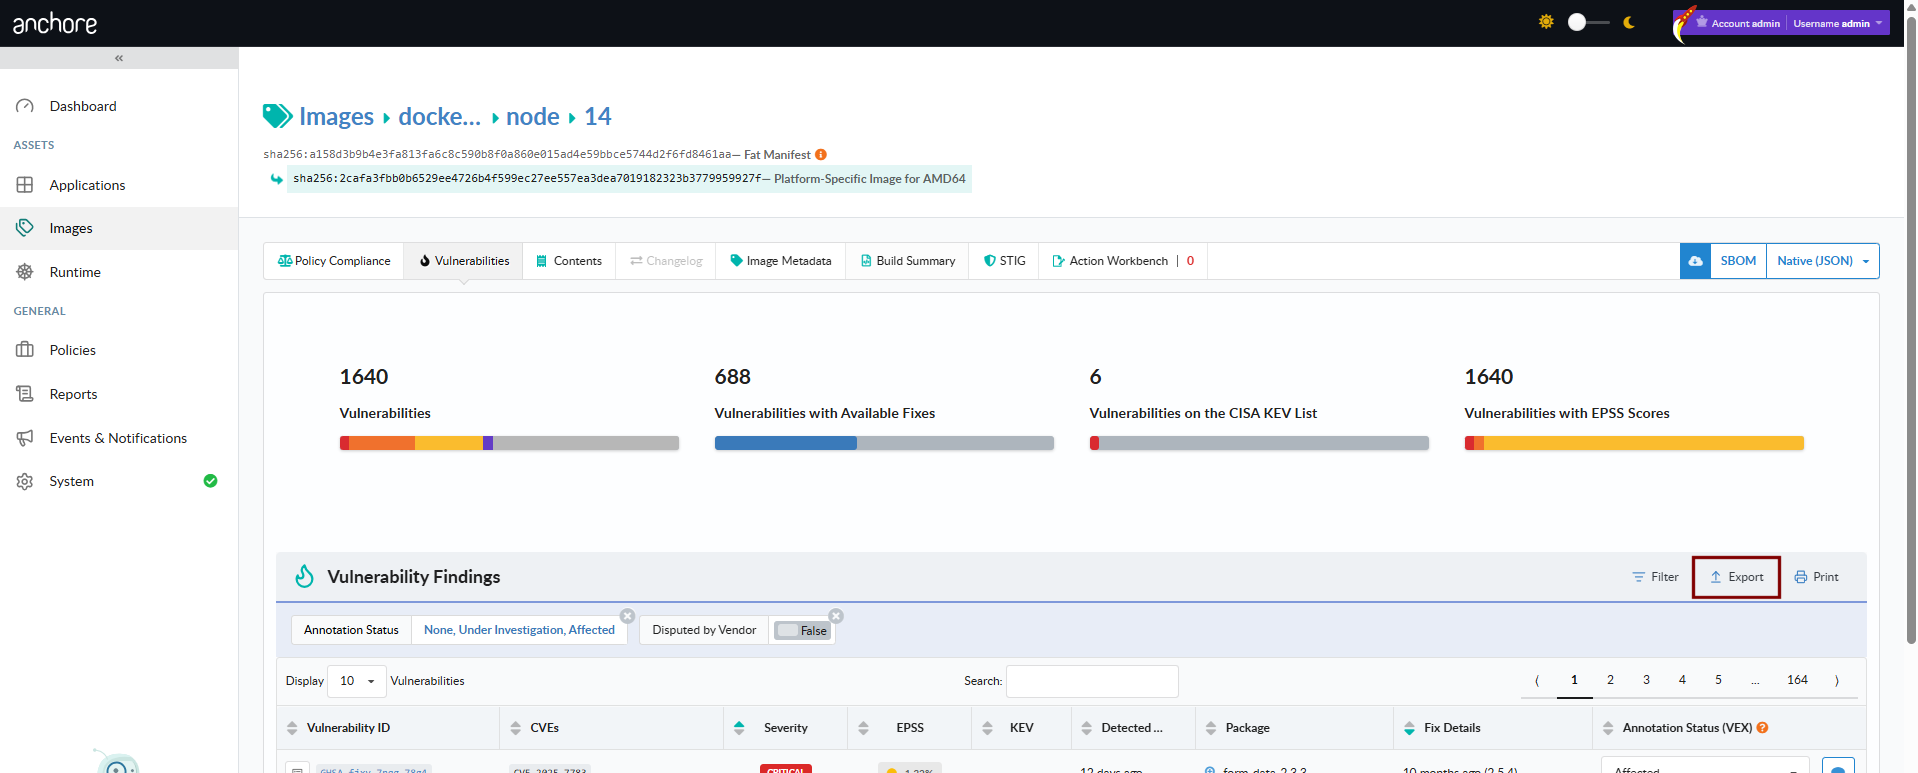
Generating a vulnerability report of container images, virtual machine files, and externally supplied SBOMs that map to CVEs (Common Vulnerabilities & Exposures), KEV (Known Exploited Vulnerabilities) and EPSS (Exploit Prediction Scoring System) data. The reports reflect all applicable CVEs, if there are known exploits and the probability of a CVE being exploited.
Use DISA STIGs for container images to establish and document configuration settings for images. Container images can be scanned against DISA STIGS in heimdall json format which can be easily converted using MITRE SAF™ into XCCDF and CKL files to import within STIG Viewer.
Use CI/CD pipelines to not only automate deployment but to ensure your security posture requirements are met each time, every time. Gates can be configured to only allow certain packages installed or be denied if there is a known exploit in a vulnerability.
Always know what images are running in your kubernetes clusters and ensure they meet organizational requirements for vulnerability and policy compliance.
Ensure that all container images meet policy before deployment into production.
The links below show how Anchore Enterprise helps maintain a secure posture with policy mappings to regulatory requirements.
Policy Mappings
The Anchore Enterprise policy bundles are updated annually. The current revision is v2026.1, which adds SBOM rule-set mappings to NIST 800-53, CMMC, FedRAMP, and the Secure Default policy, plus a new STOP gate for vulnerabilities on the CISA KEV list under NIST 800-53 SI-2 (Flaw Remediation). See the policy pack reference for what each bundle covers.
This guide provides examples of how to setup a policy gate to enforce development teams to comply with organizational Plan of Actions & Milestones (POA&M).
The Anchore Enterprise NIST 800-53 policy bundle (revision v2026.1) ships a configurable POA&M allowlist as part of PM-4 (Plan of Action and Milestones). You can use it as-is or follow this guide to author an allowlist for your own image and CVE — the two approaches use the same rule + allowlist + expiration pattern.
The POA&M Challenge
POA&Ms can easily become an administrative nightmare to track, maintain and update. With Anchore Enterprise, POA&Ms can now be done via code configuring CI/CD policy gates that enforce compliance.
POA&M Solution
Generate an Enforceable POA&M Using Policy as Code
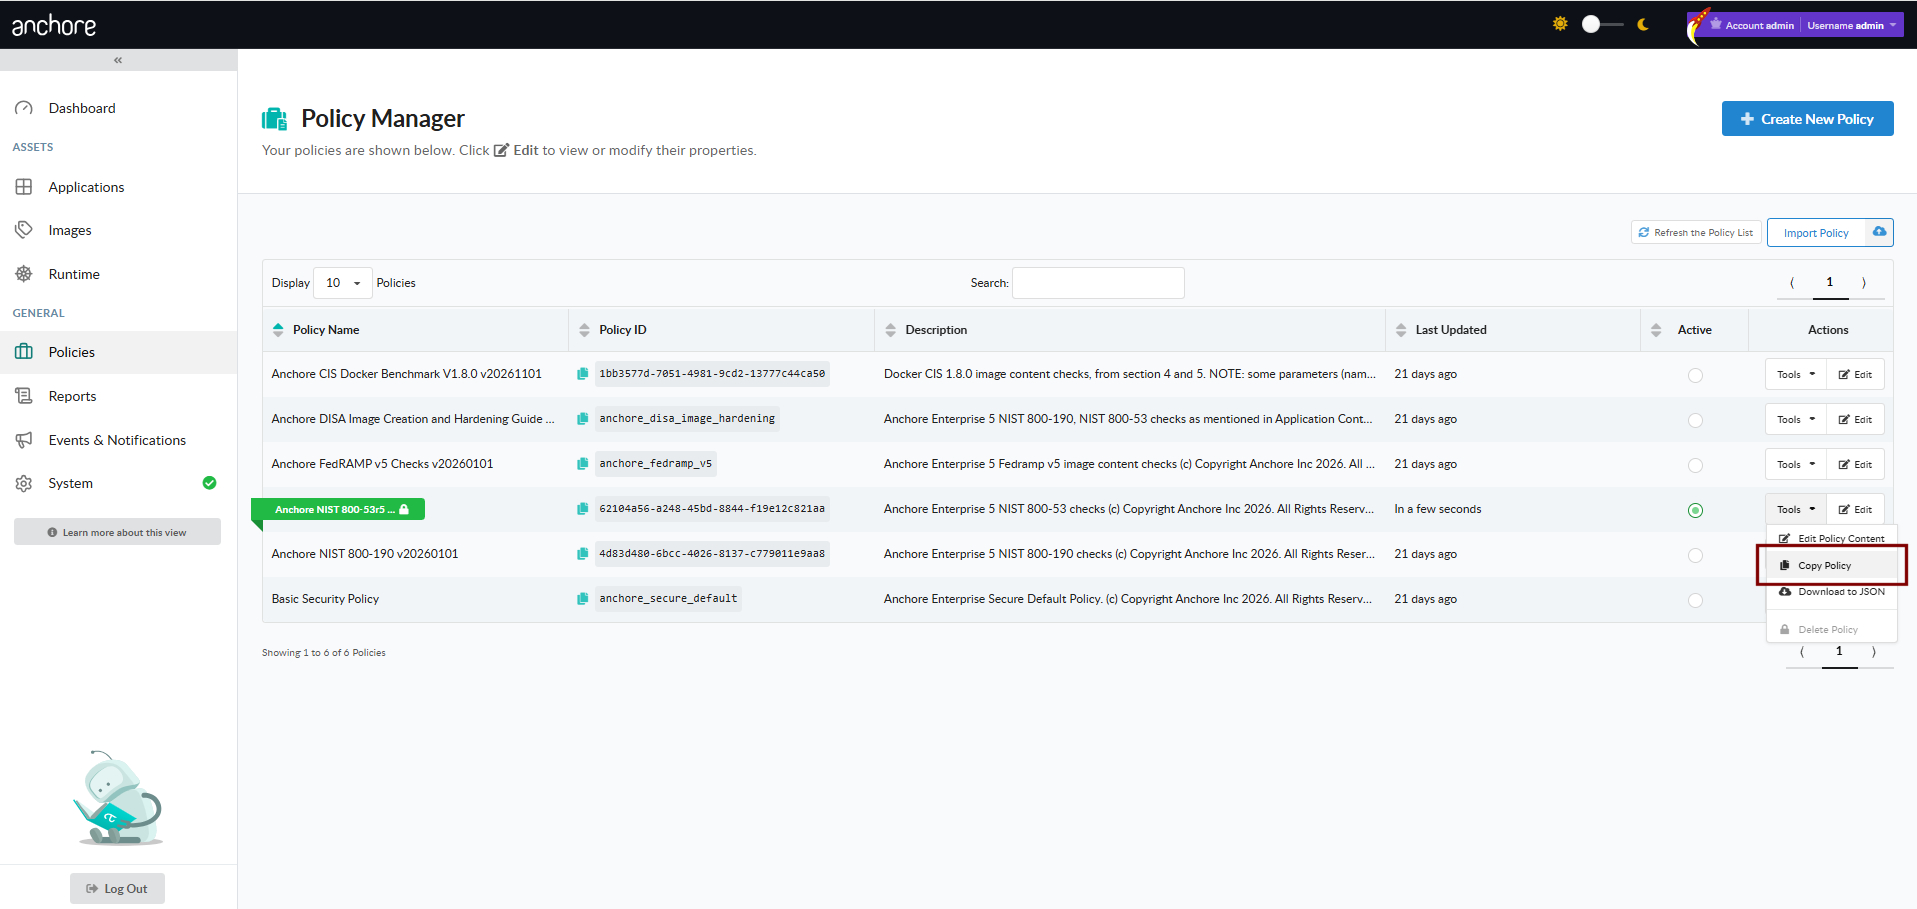
The example is shown using a policy from scratch but these directions could be used to add to an existing policy.
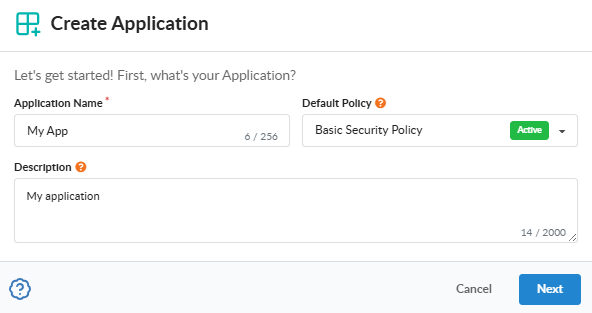
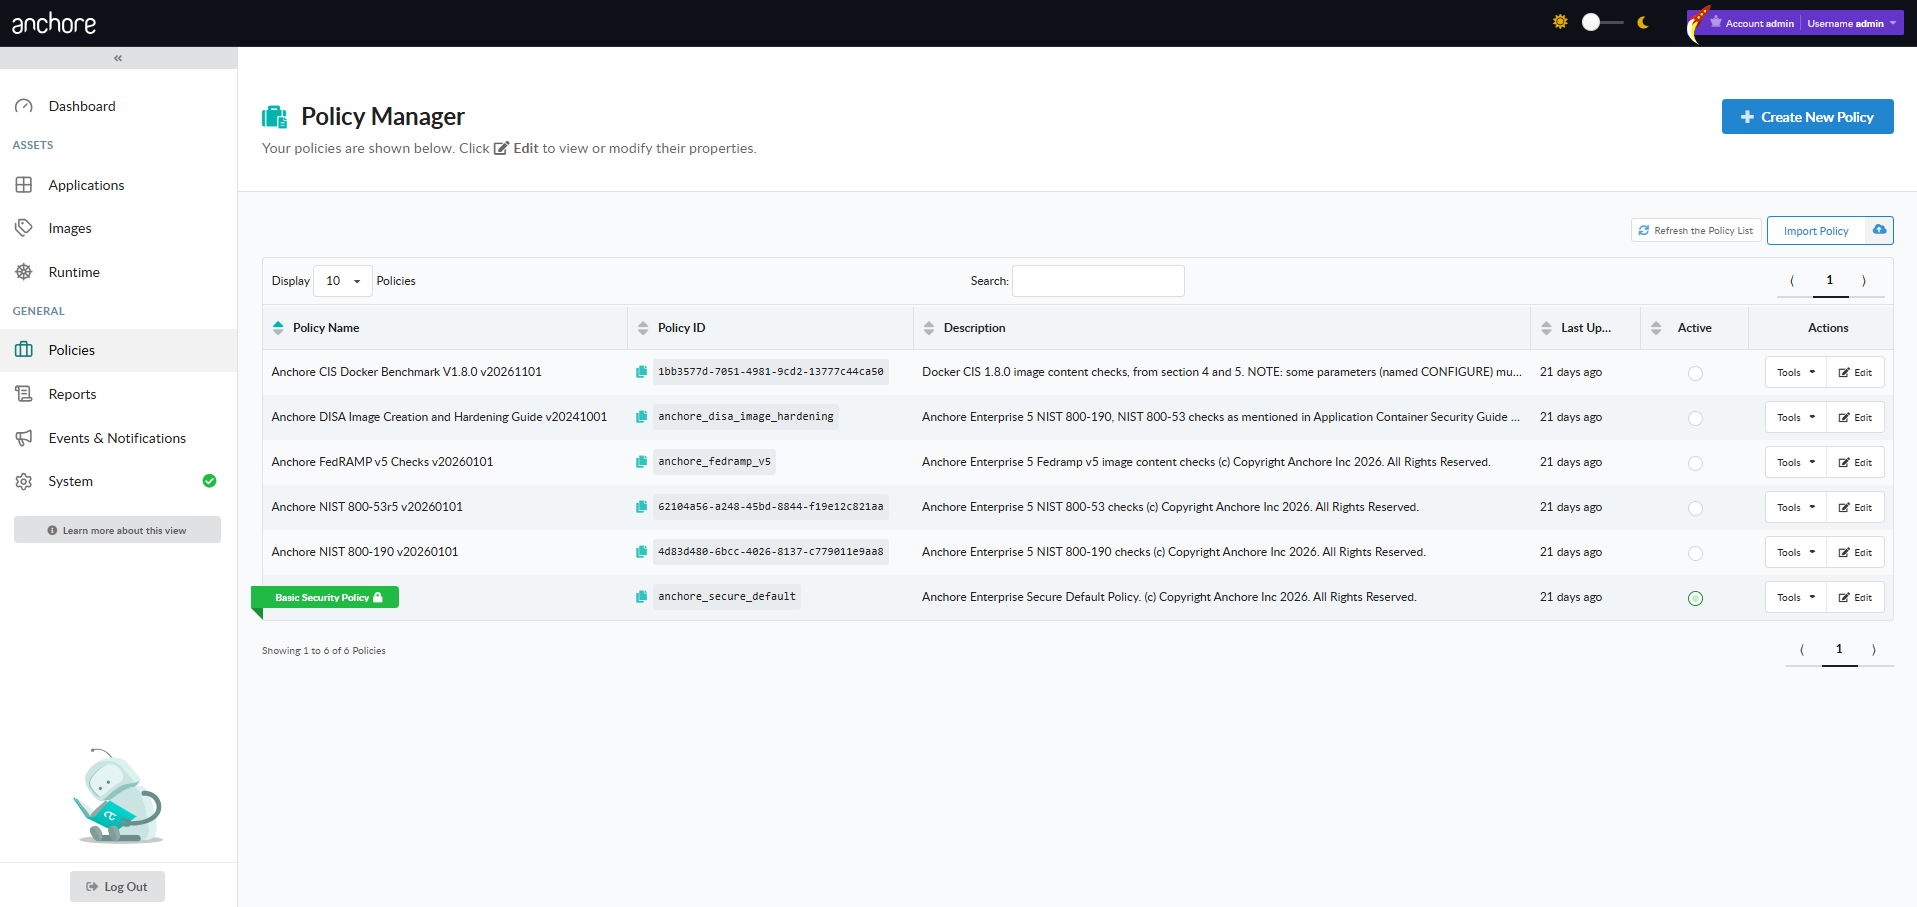
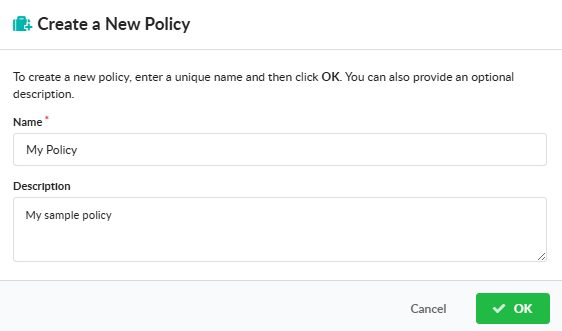
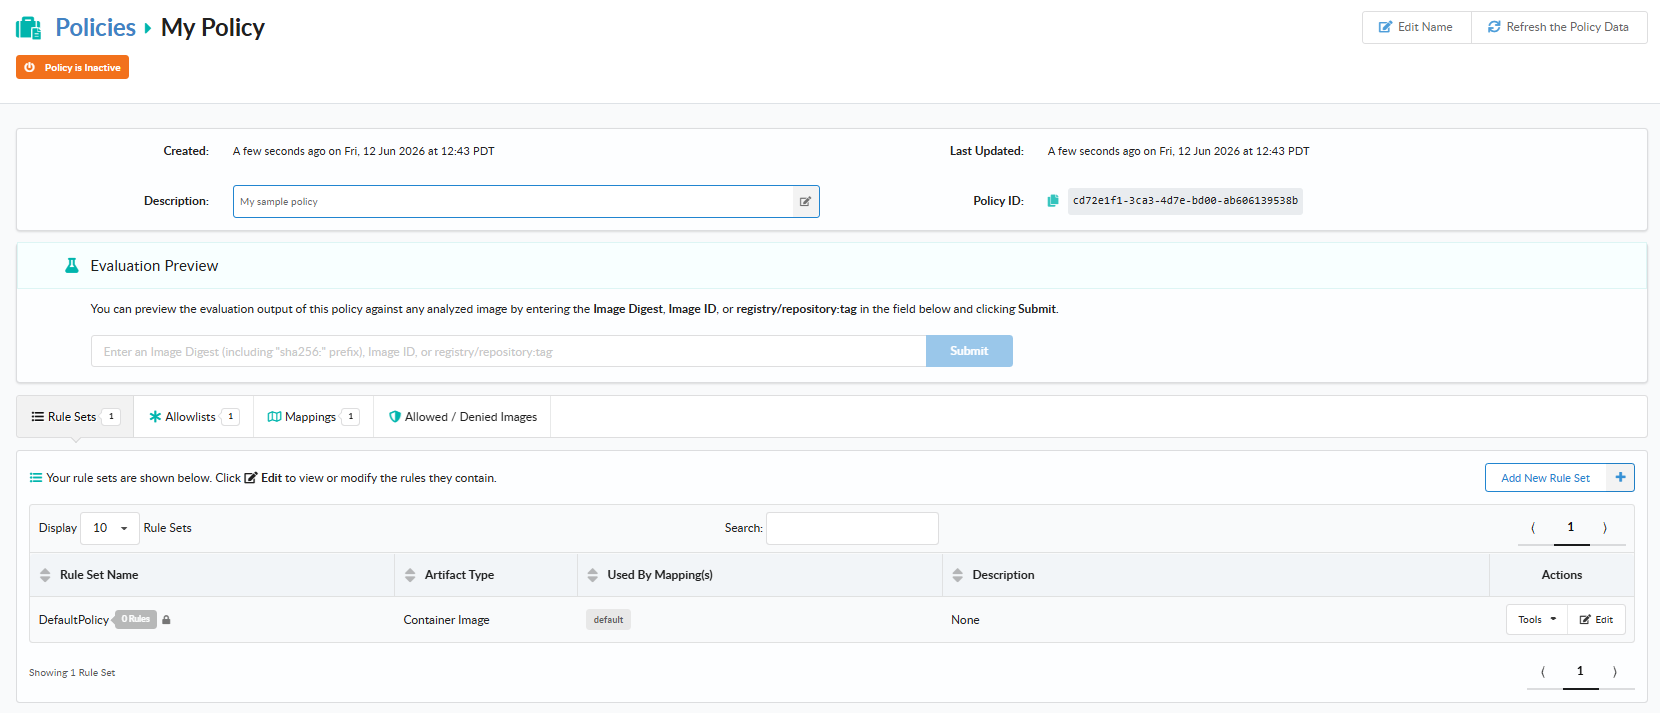
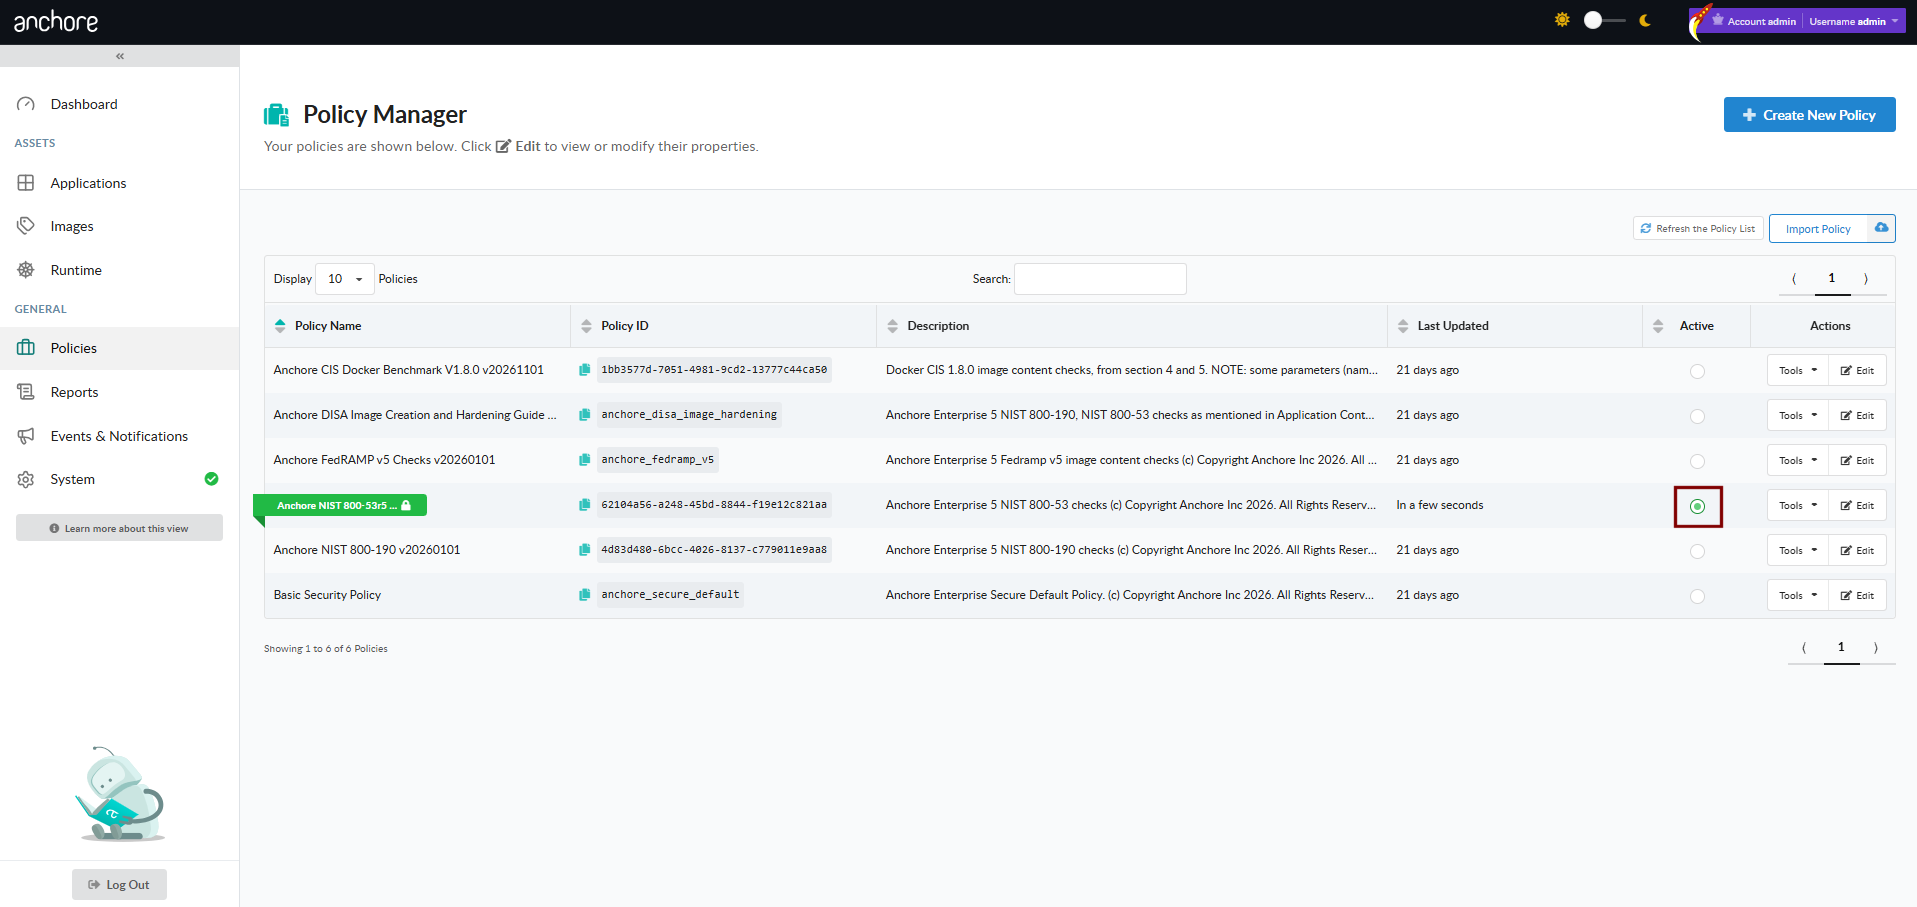
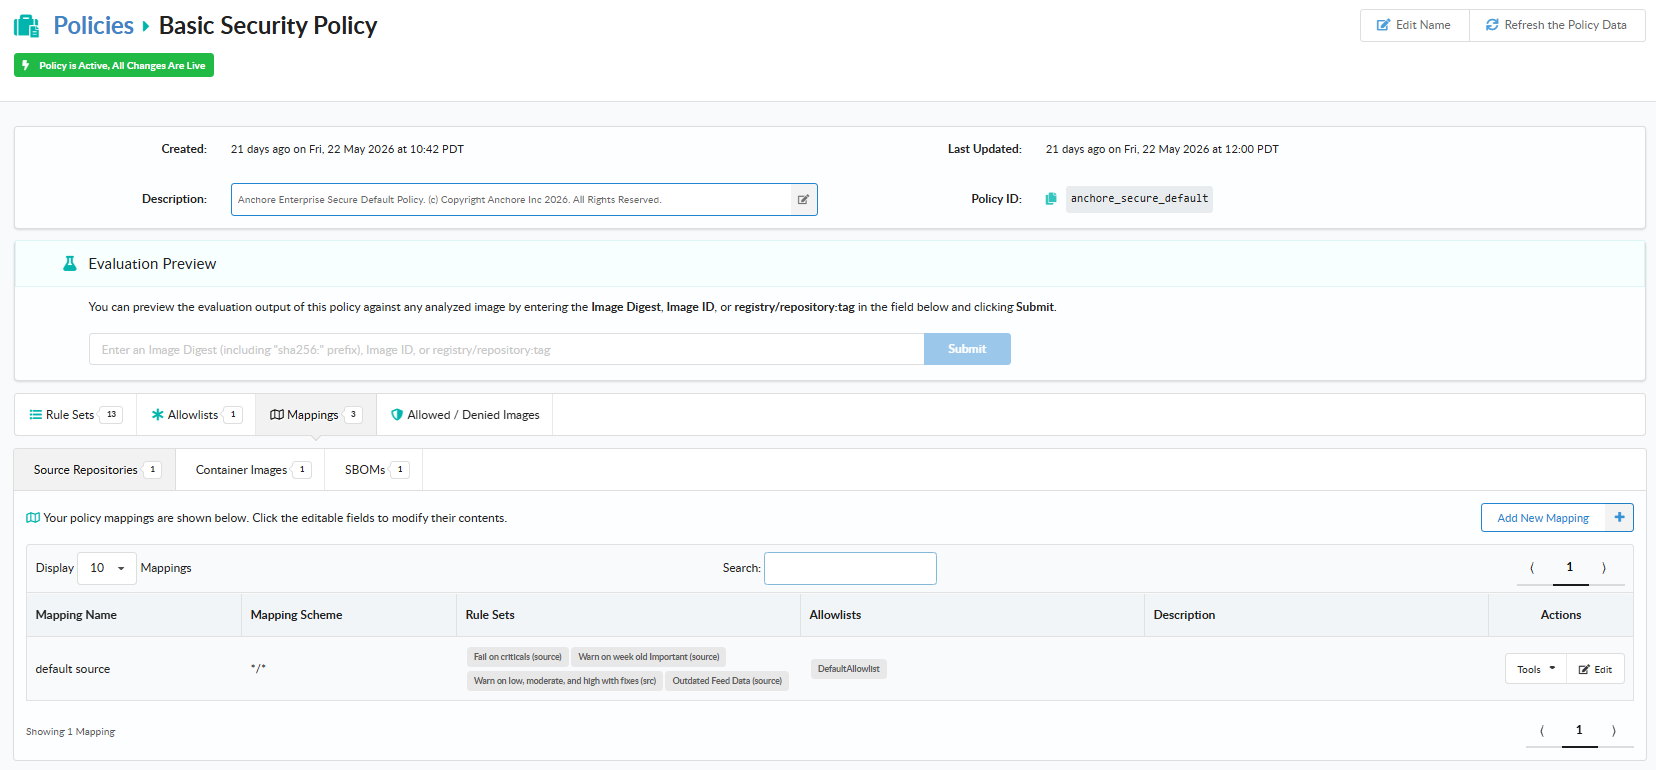
Create a new policy
Name and describe your policy, then click save
Now we will add a rule to the rule set, by clicking edit:
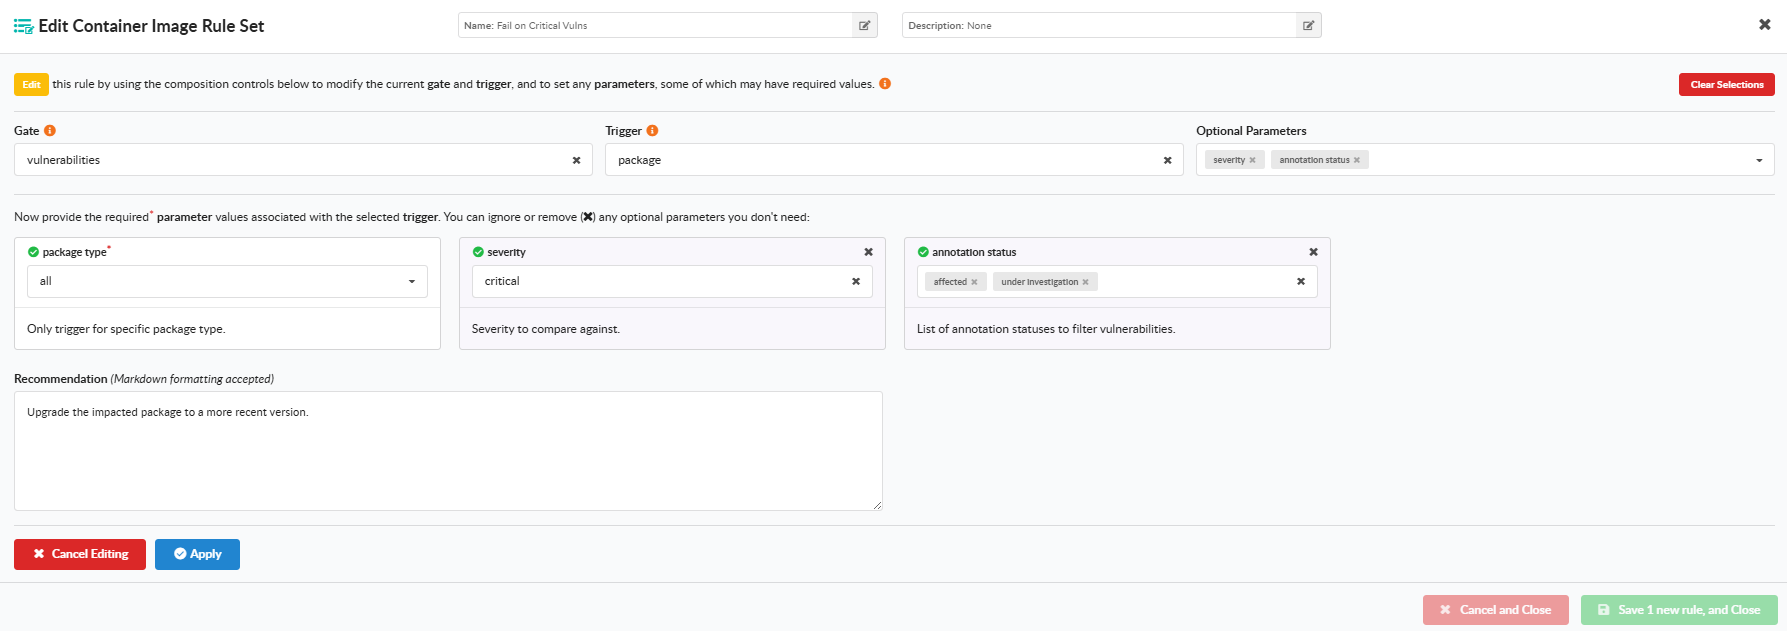
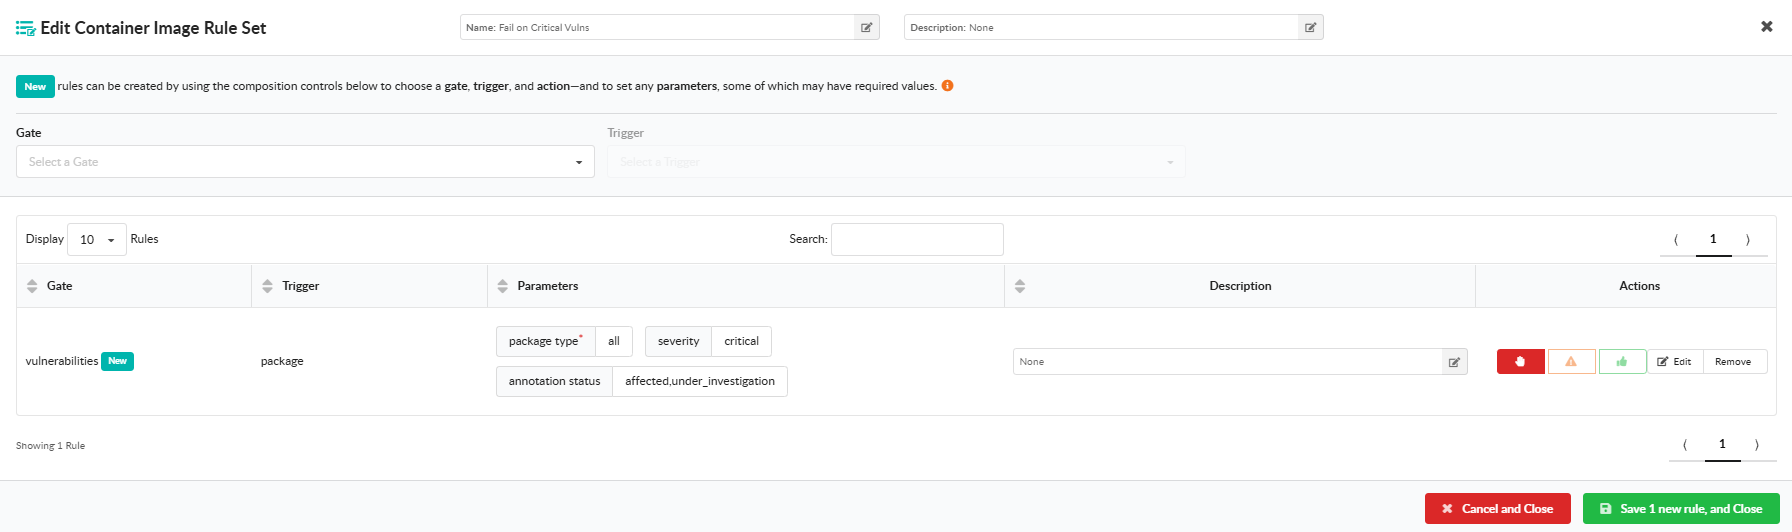
From here we will configure a rule:
Name the rule: RA-5 Vulnerability Monitoring & Scanning
Gate: Vulnerabilities
Trigger: Package
package type: all
severity comparison: >=
severity: unknown
fix available: true
Scroll down to the bottom and click the action of STOP and click Save and Close.
Next, we will make an Allowlists for the item we want to POA&M by editing a default Allowlist or adding a New Allowlist:
Now we will edit the Allowlist:
Name the Allowlist: POA&M
Gate: Vulnerabilities
CVE/Vulnerability Identifier: CVE-2025-66293
Package: libpng16-16t64
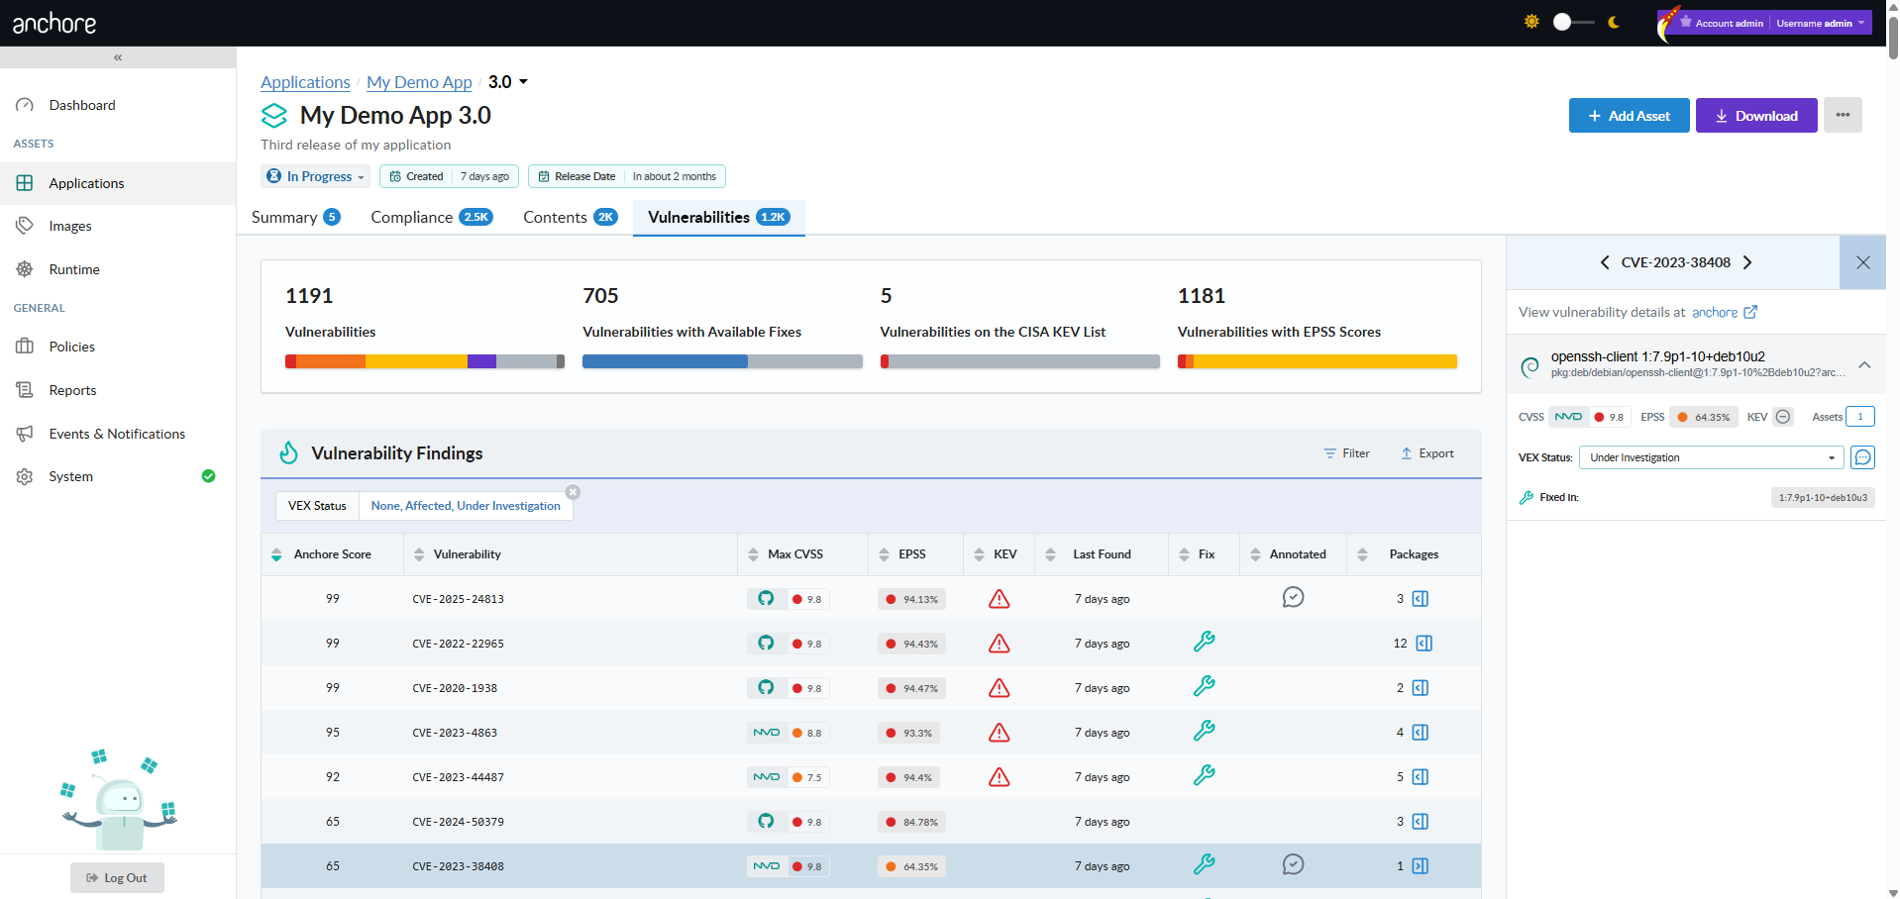
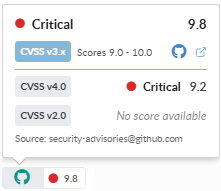
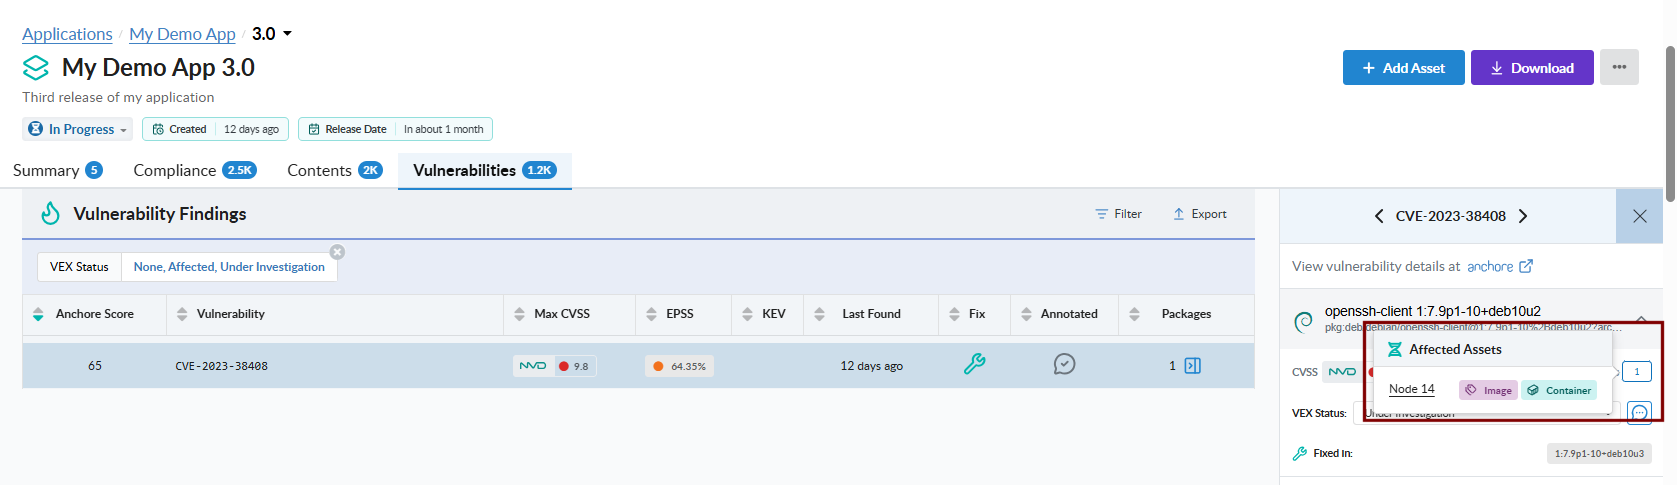
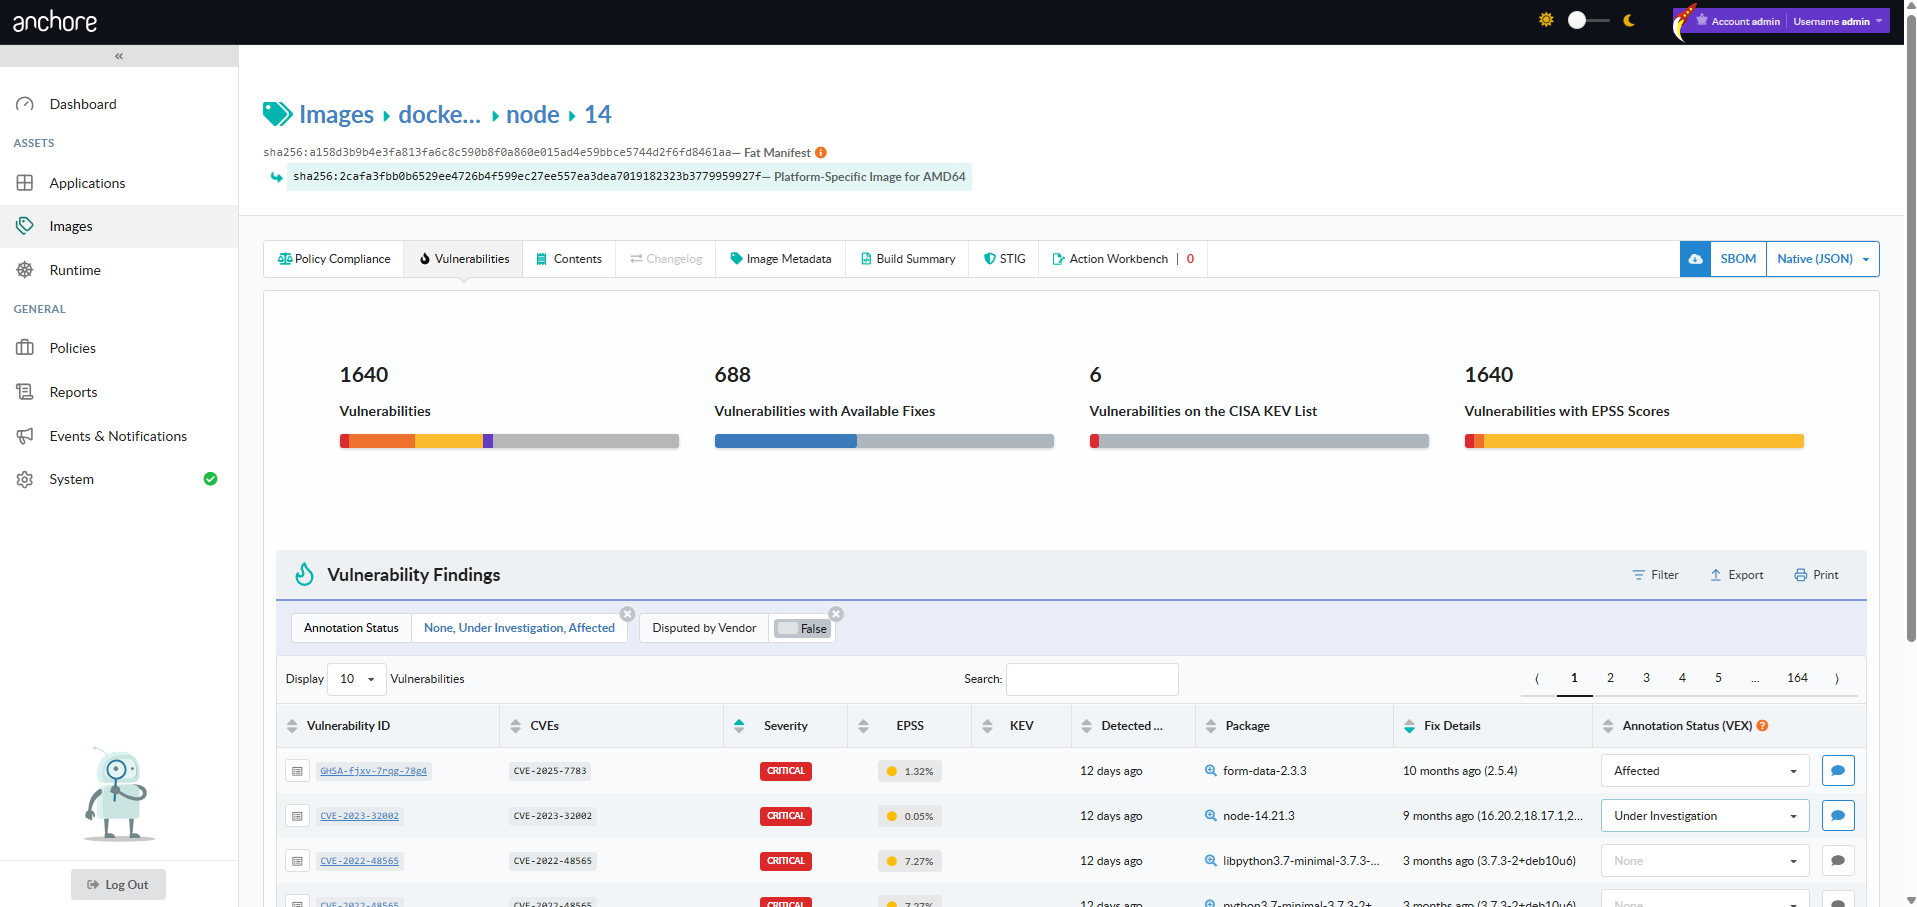
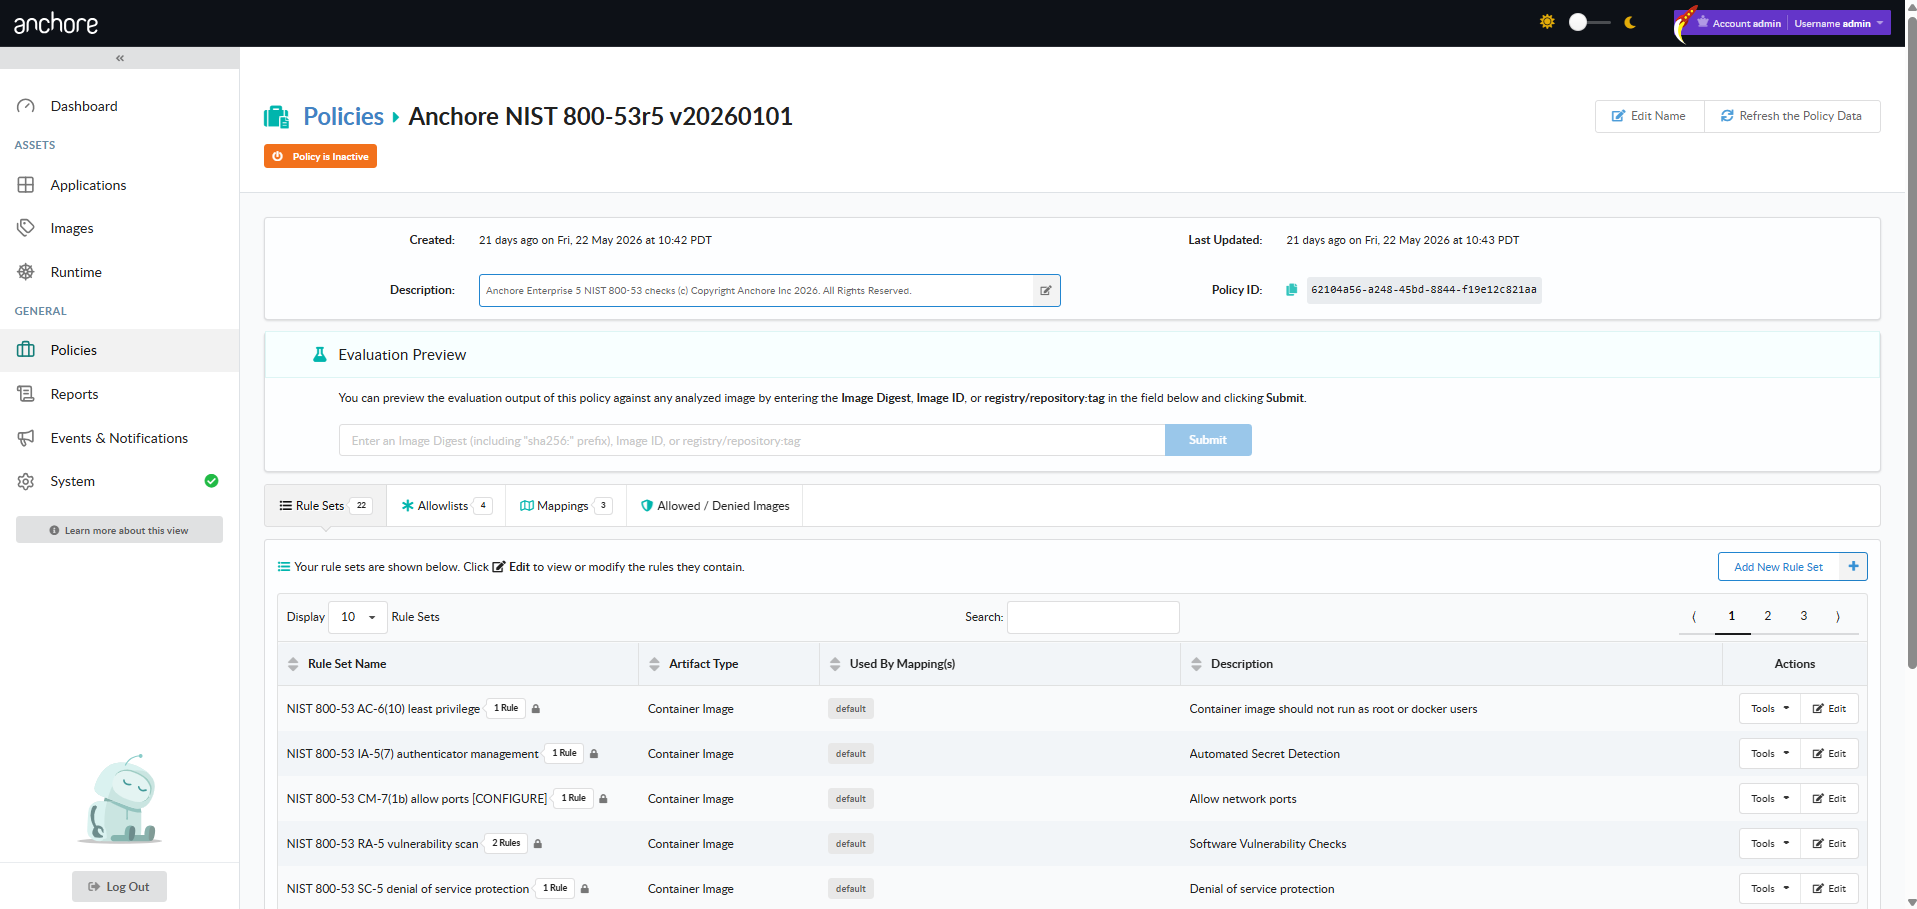
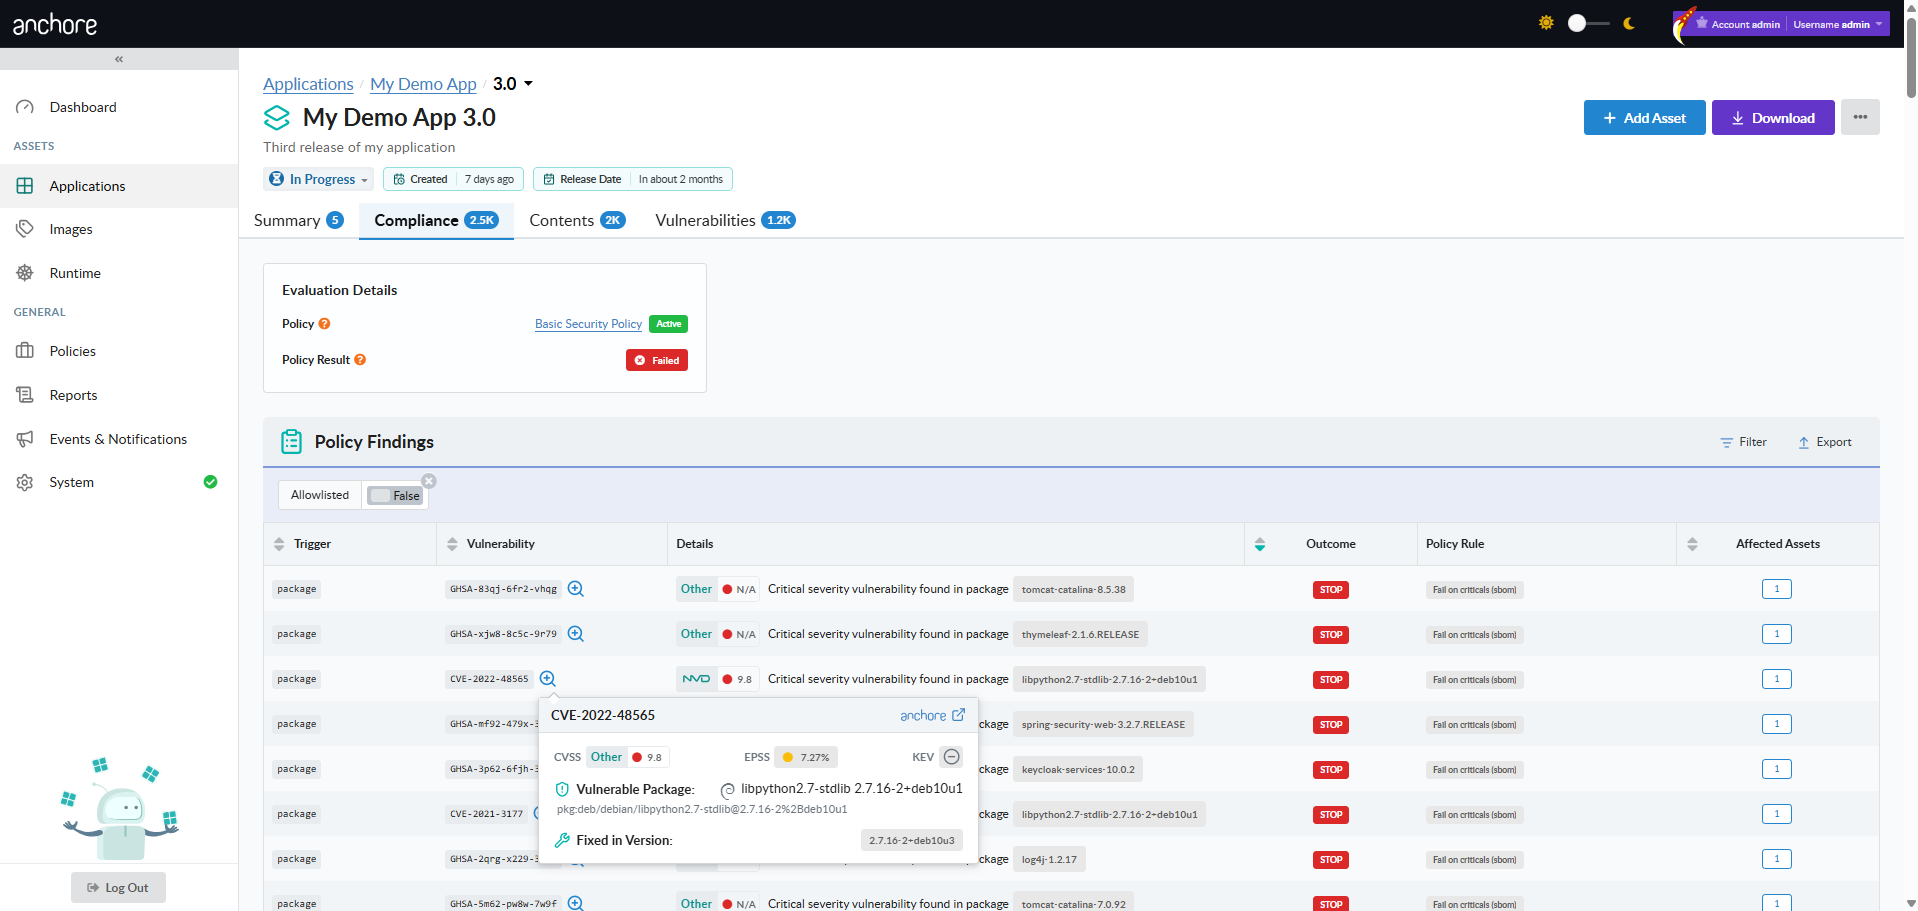
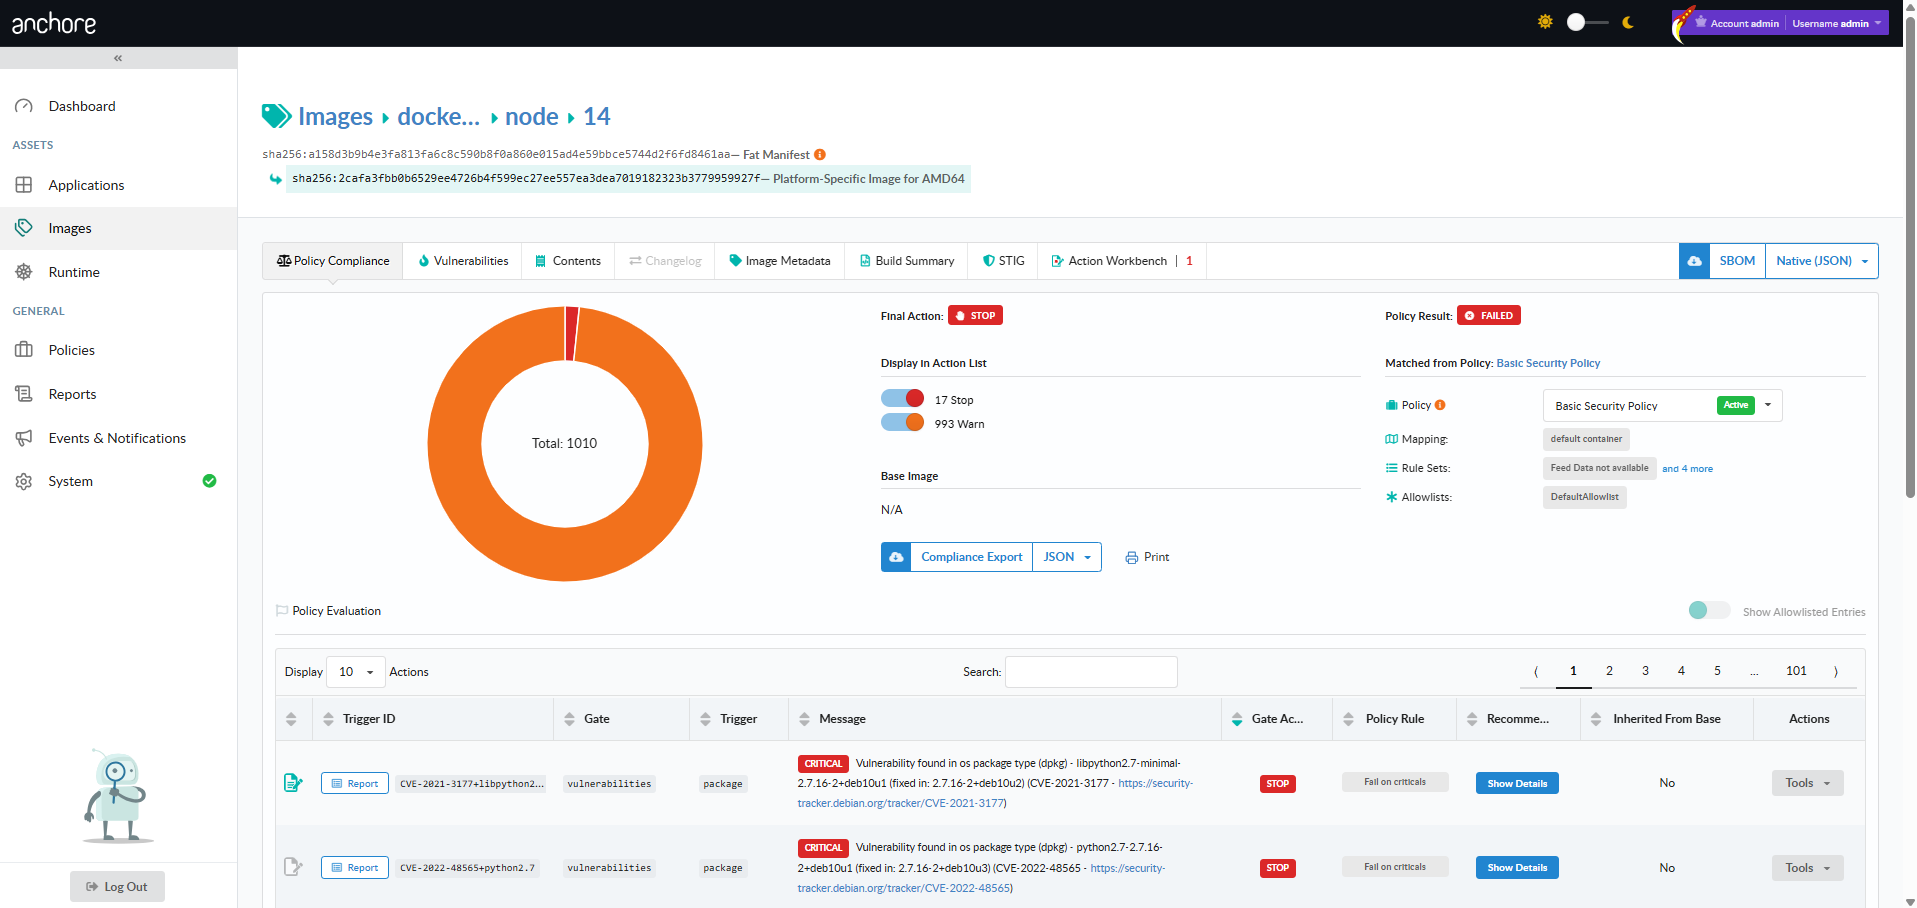
Note: Another way to get the CVE and Package information is to obtain the Trigger ID on the Policy Compliance Tab which is CVE ID+package as seen in image below:
We have a rule and an Allowlist but we want to make this a POA&M item that expires so lets make an expiration by clicking on the calendar:
A calendar will pop-up and you can select a date or or a time frame of days, weeks or months:
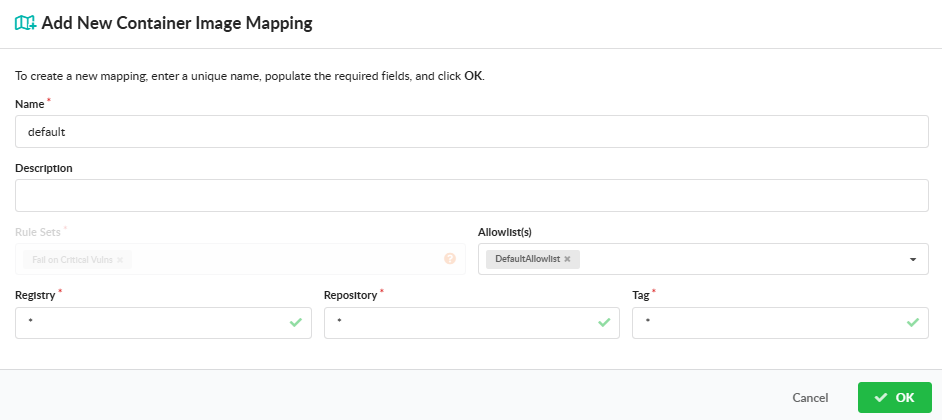
Next we will make a mapping to limit where this specific POA&M or Allowlist is applied by clicking Mappings, Container Images and Edit:
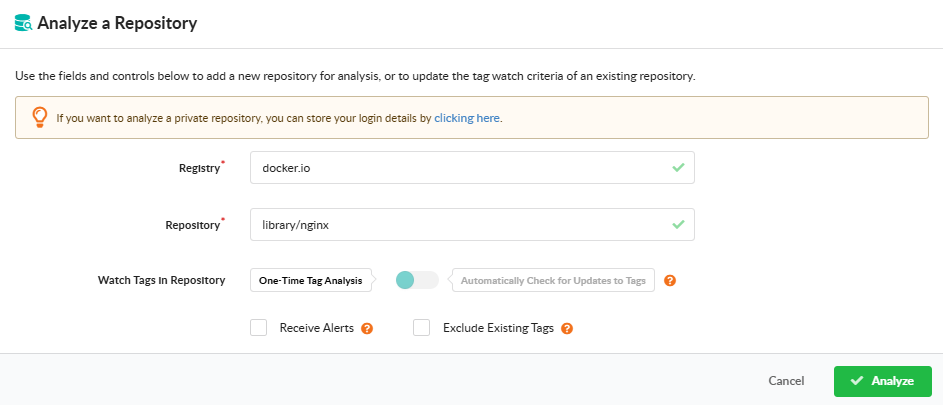
Next we will associate a Registry, Repository and Tag with the POA&M Allowlist we just made.
Name the Mapping: nginx-libpng
Registry: docker.io
Repository: nginx
Tag: *
Note: Wildcards “*” can be used for Registry, Repository, and Tag
Our POA&M via an Allowlist with an expiration has been created. Let’s validate:
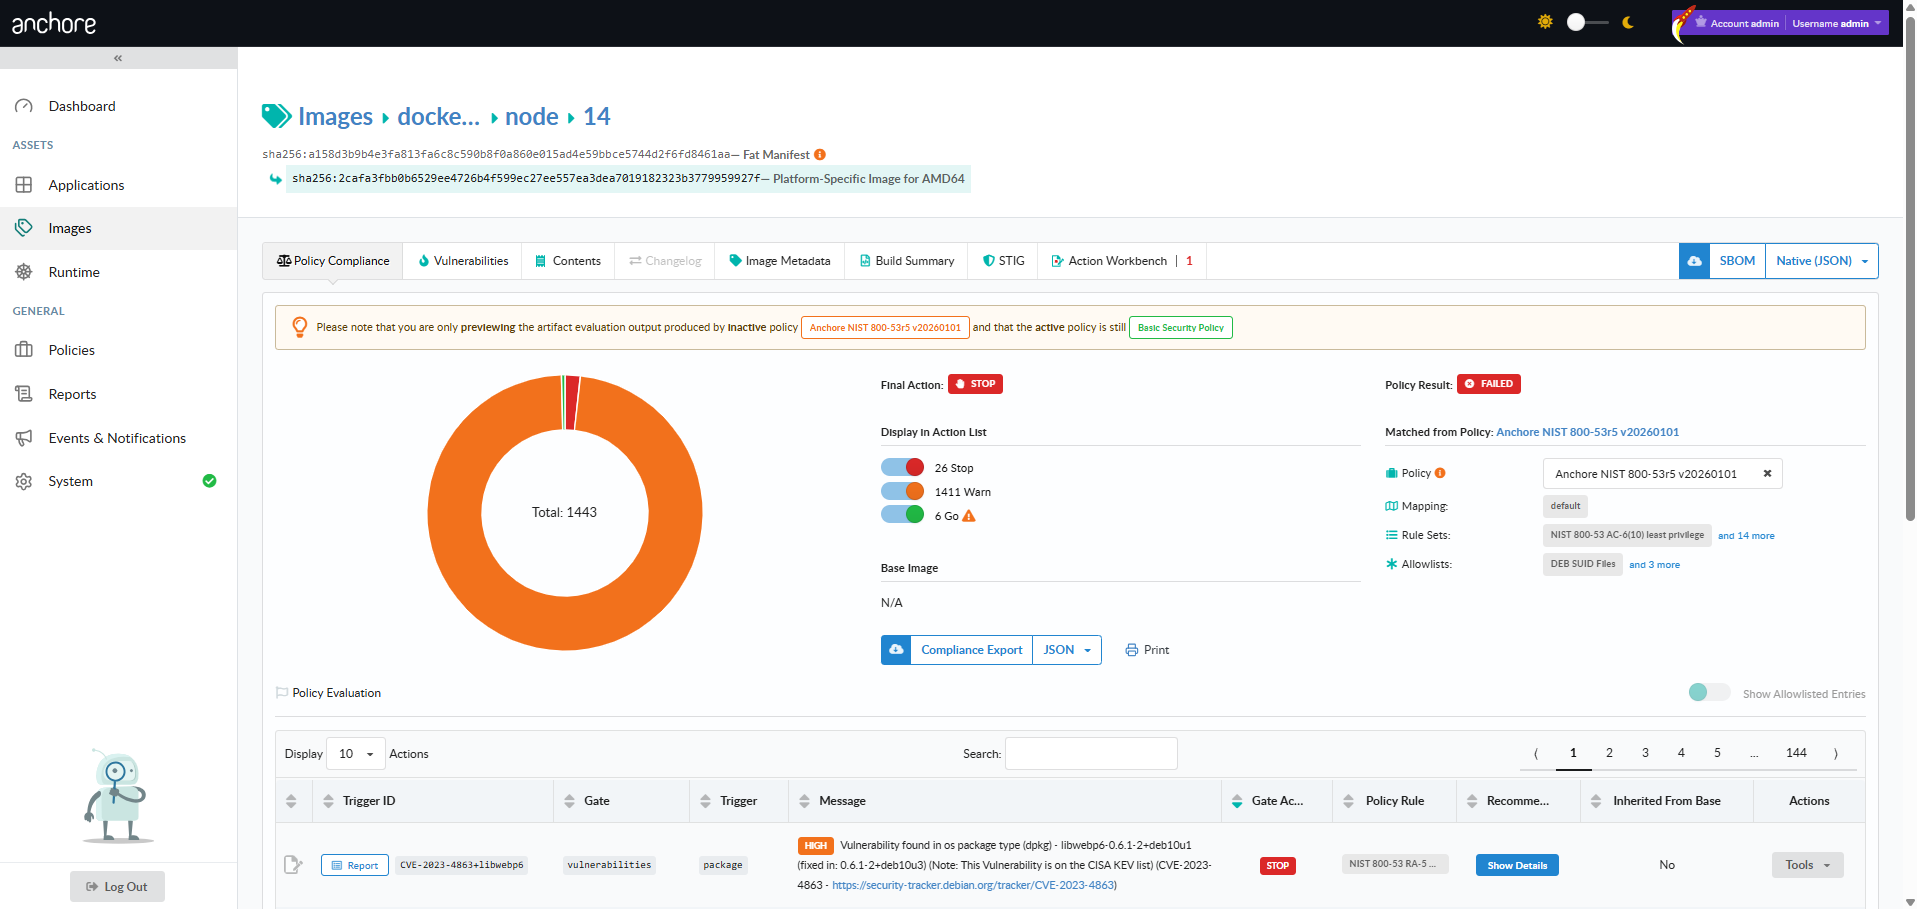
Toggle on Go
Show Allowlisted Entries
The TriggerID matches what was put in the Allowlist
You have now created a POA&M enforced by code.
1.1.2 - STIG
Use Anchore Enterprise to STIG a container image
This guide provides examples of how to scan a container with DISA STIGs and import the data into Heimdall for a visualization or STIGViewer to create a checklist to provide as an ATO artifact.
This guide requires the dependencies located here to be installed along with the dependency below.
Once these dependencies are installed, the STIG profiles are written as indicated in the here link and a STIG evaluation has been completed, you are ready to begin.
We will assume that the output of the scan is located in our working directory for the examples below and the STIG --stig-output-dir was saved in /tmp like the example below:
AnchoreCTL v6 exposes a dedicated anchorectl stig docker image command tree (add, delete, download, execute, list) as the v6-canonical path for container image STIG operations. stig docker image execute is the focused alternative to the inline image add --stig flag shown above. The legacy anchorectl image stig tree is deprecated in v6 in favor of stig docker image. See Anchore STIG for Container Images for the full command reference.
Work with Heimdall
The native format for STIG output in Anchore Enterprise is OASIS Heimdall Data Format (OHDF) and can be easily uploaded to heimdall-lite.mitre.org
From here, you can upload the results.json file and obtain charts and a map of the NIST 800-53 controls like the images below:
You can easily filter what passed, failed, not reviewed and not applicable. The data can be exported as a DISA Checklist or as XCCDF Results as indicated in the picture below:
The data can be imported back into STIGViewer to audit a checklist as indicated in Step 4 under Work with STIGViewer.
Work with STIGViewer
With safcli installed run the following command to convert the results.json to XCCDF:
saf convert hdf2xccdf -i results.json -o xccdf-results.xml
Now we want to convert the same results.json to a ckl file:
saf convert hdf2ckl -i results.json -o ubi9-check.ckl
Let’s open STIGViewer and import the xccdf-results.xml file we created in step 1.
Now we can click the Home Icon and load our checklist:
Click the hamburger menu
Click Import V2 Checklist and upload ubi9-check.ckl
The container STIG checklist can now be saved once the findings as either Open, Not a Finding, Not Applicable and submitted with the applicable Body of Evidence (BOE) documentation.
You have now STIG’d a container image and created a checklist.
1.2 - Creating SBOMs from Virtual Machines
Generate SBOMs from virtual machine filesystems and disk images using AnchoreCTL
Containers are not the only software you ship. Many organizations run virtual machines — on cloud providers, on-prem hypervisors, edge appliances, or air-gapped environments — and the workloads inside those VMs need the same SBOM-based security analysis that containerized workloads receive. This quickstart shows two practical ways to bring a virtual machine’s contents into Anchore Enterprise for vulnerability and policy analysis: by analyzing the live filesystem of a running VM, or by analyzing a VM disk image offline against a loopback mount.
When This Approach Fits
Filesystem-based analysis with AnchoreCTL fills the gap between “I have a container image” and “I have a software inventory” for workloads that don’t fit the container model:
Cloud or on-prem virtual machines running services that predate containerization, or that depend on kernel modules, system services, or installed packages that aren’t easily containerized.
Air-gapped or appliance environments where VM images are shipped as the unit of distribution and need to be analyzed before deployment.
Forensic or audit workflows where a disk image needs to be analyzed offline without booting the VM.
Build-time analysis of “golden image” VM templates before they’re cloned out across a fleet.
In each case, AnchoreCTL produces an SBOM from a directory tree and uploads it as an asset on an app version, where the result aggregates alongside any other assets (container images, filesystems, externally supplied SBOMs) attached to the same release.
Before You Start
An Anchore Enterprise deployment.
AnchoreCTL installed and configured to talk to your deployment.
For the running-VM approach: SSH access to the VM and the ability to install or copy in the AnchoreCTL binary.
For the disk-image approach: a Linux host with the QEMU utilities (qemu-utils on Debian/Ubuntu, qemu-img on RHEL/Fedora) and the NBD kernel module loaded. The module is a one-time sudo modprobe nbd max_part=8 on most distributions. Other VM disk formats (raw, vmdk, vdi) can be converted to qcow2 with qemu-img convert first.
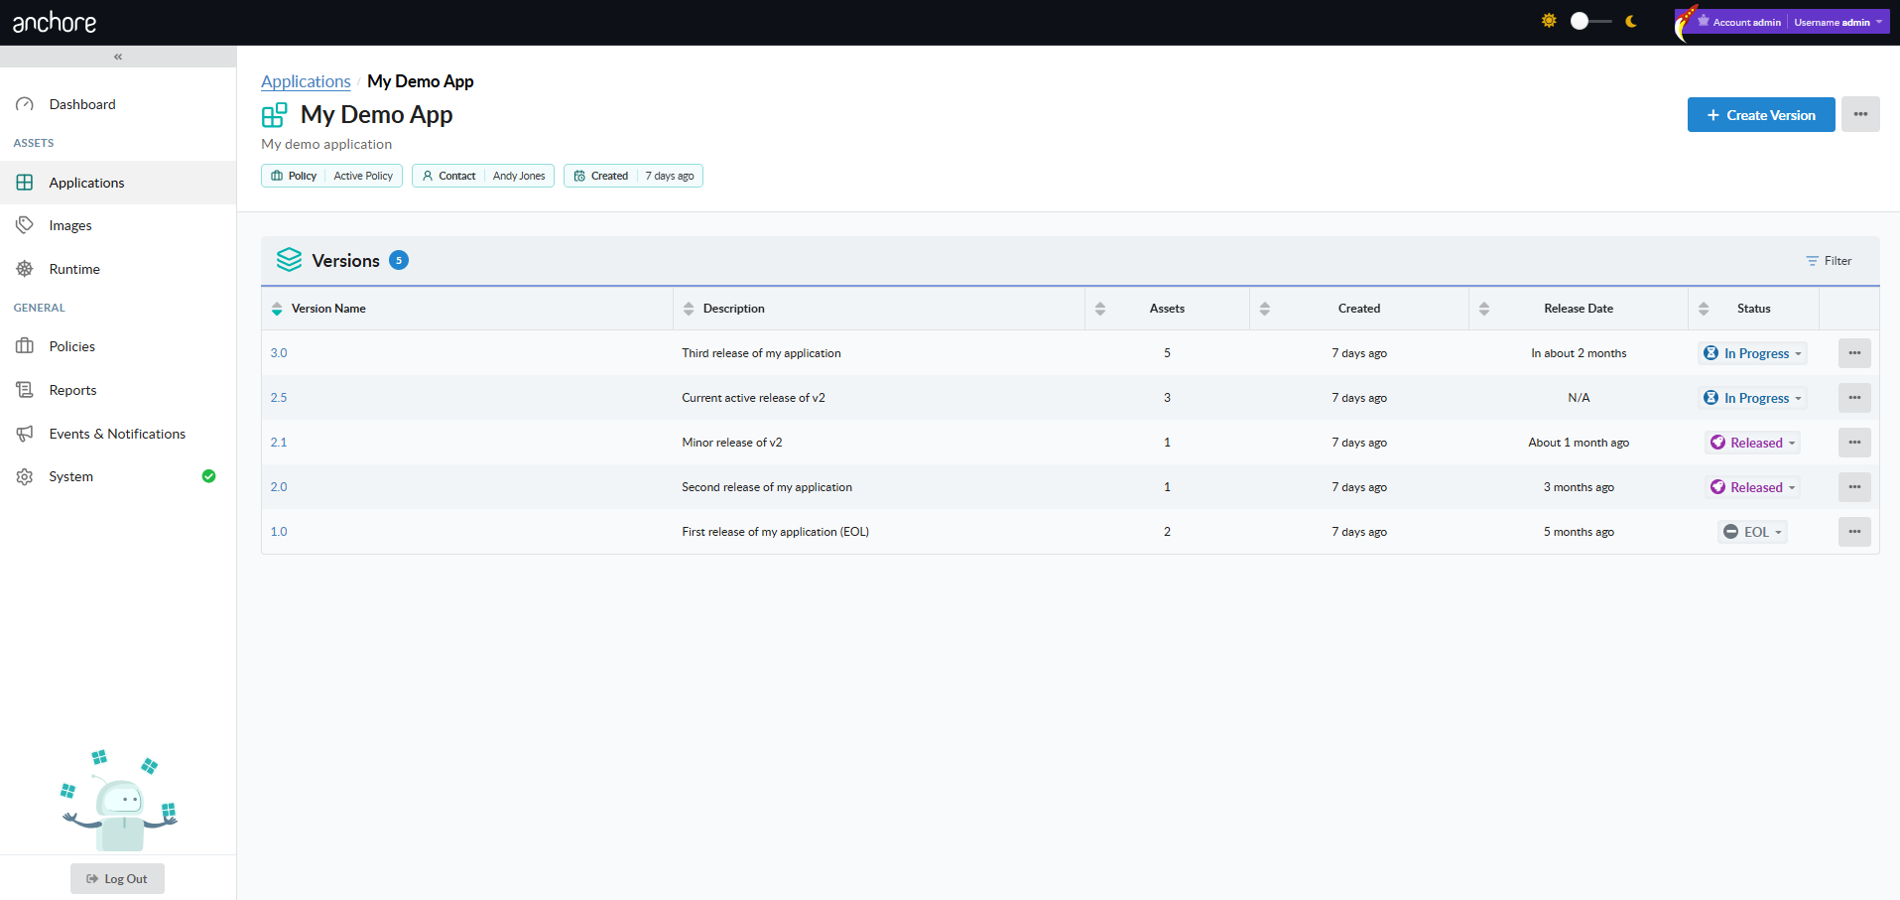
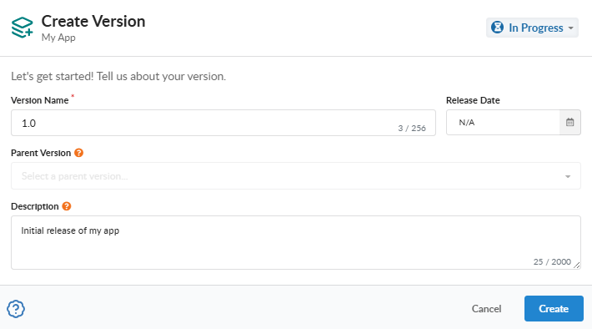
Create the App and Version
Attach the resulting SBOM to an app version. Create the app and an initial version once — either ahead of time as part of release setup, or on-demand the first time you run the analysis:
Install AnchoreCTL inside the VM, then point it at the filesystem you want to analyze. Analyzing the root path is the broadest coverage; narrower paths (/usr, /opt, /srv) are faster if you only care about installed software:
# On the VM — install AnchoreCTLcurl -X GET "https://my-anchore.example.com/v2/system/anchorectl?operating_system=linux&architecture=amd64"\
-H "accept: */*" | tar -zx anchorectl
# Configure connection to Anchore Enterpriseexport ANCHORECTL_URL=https://my-anchore.example.com
export ANCHORECTL_USERNAME=<your-user>
export ANCHORECTL_PASSWORD=<your-password>
# Analyze the root filesystem and attach as an asset on the target app version./anchorectl app version asset add filesystem / \
--app my-vm-fleet \
--version 2026-06-01 \
--asset web-server-vm \
--type virtual_machine_disk \
--wait
For production workflows, use an API key instead of username and password. API keys are particularly useful when AnchoreCTL runs inside a VM, since they’re easier to rotate and scope to specific operations.
The --type virtual_machine_disk flag tags the asset with the virtual_machine_disk type so it’s distinguishable from other filesystem-derived assets in the same version. The --wait flag blocks until the asset-add job reaches a terminal state.
AnchoreCTL’s filesystem analyzer skips pseudo-filesystems like /proc and /sys by default, so analyzing / is safe. If you want to narrow the scope further, point at a specific directory and pass that path in place of /.
Approach B — Analyze a VM Disk Image Offline
With QEMU utilities installed and the NBD module loaded (see Before You Start), mount the VM disk image read-only and run AnchoreCTL against the mount point. This walkthrough uses a qcow2 image — the most common Linux VM format.
# Connect the qcow2 image as a read-only network block devicesudo qemu-nbd --read-only --connect=/dev/nbd0 disk.qcow2
# Mount the root partition (adjust the partition number to match your image)sudo mkdir -p /mnt/vm
sudo mount -o ro /dev/nbd0p1 /mnt/vm
# Analyze the mounted filesystem and attach as an assetanchorectl app version asset add filesystem /mnt/vm \
--app my-vm-fleet \
--version 2026-06-01 \
--asset web-server-vm-image \
--type virtual_machine_disk \
--wait
# Clean upsudo umount /mnt/vm
sudo qemu-nbd --disconnect /dev/nbd0
This pattern is particularly useful for forensic or pre-deployment workflows — the VM never has to boot, no agent needs to be installed inside it, and the disk stays read-only throughout.
View Results in Anchore Enterprise
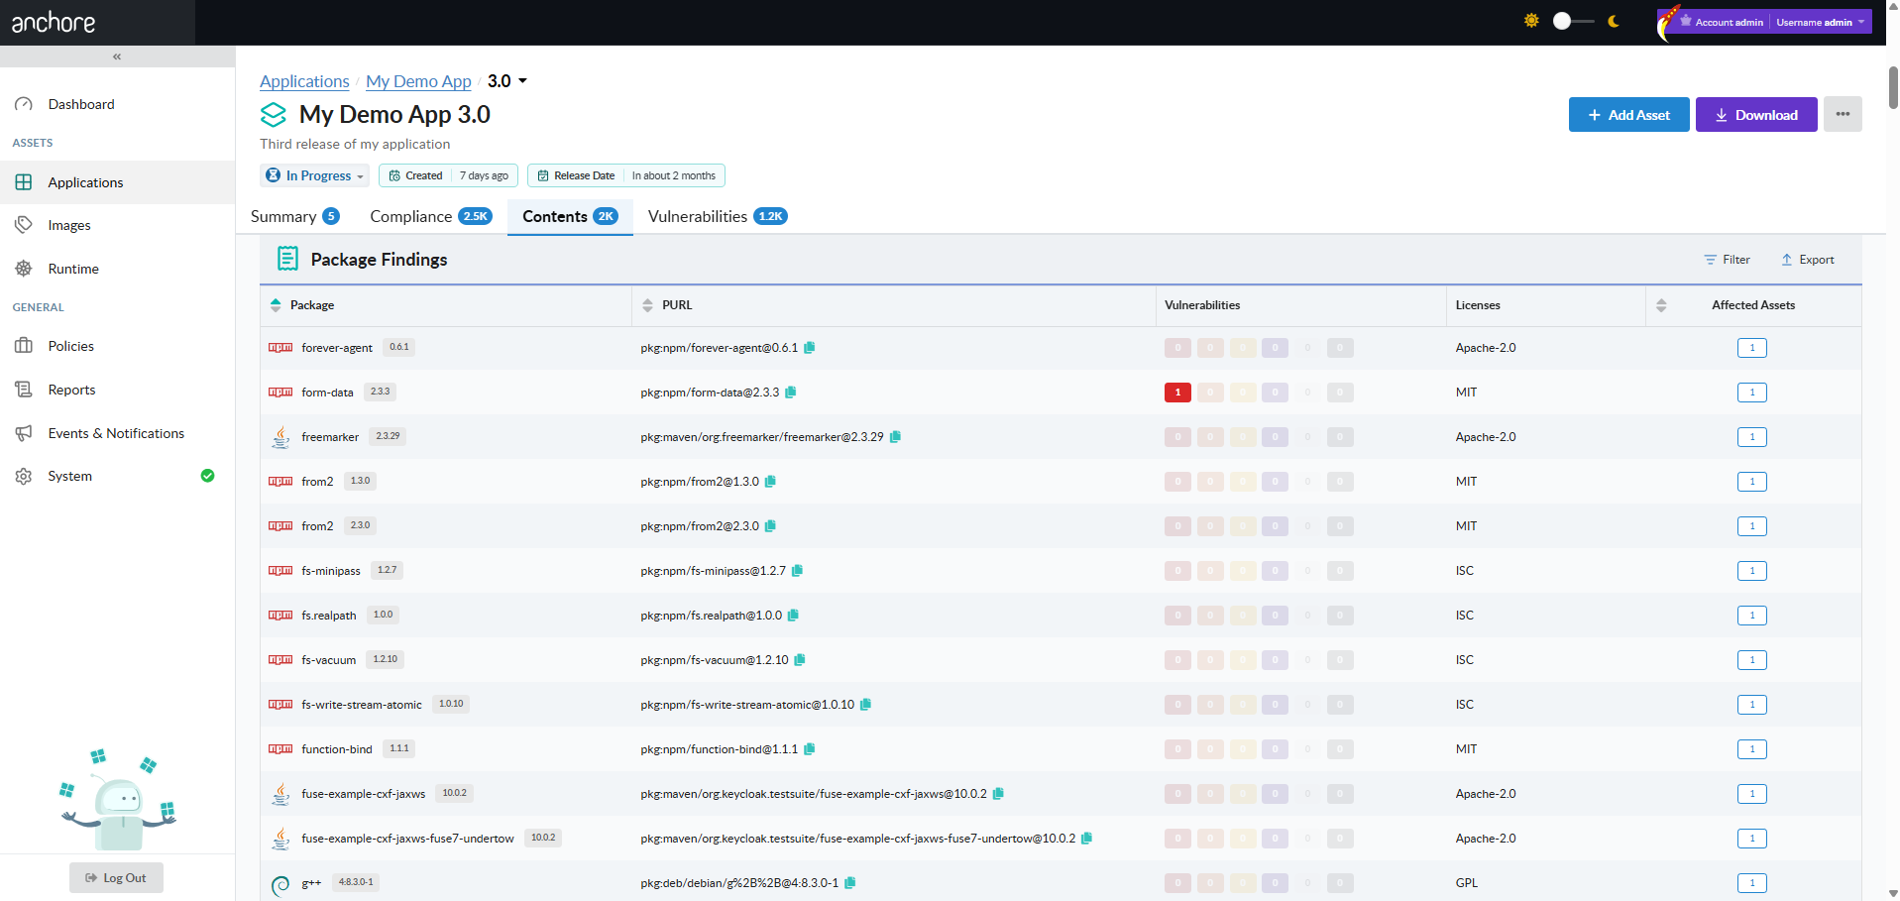
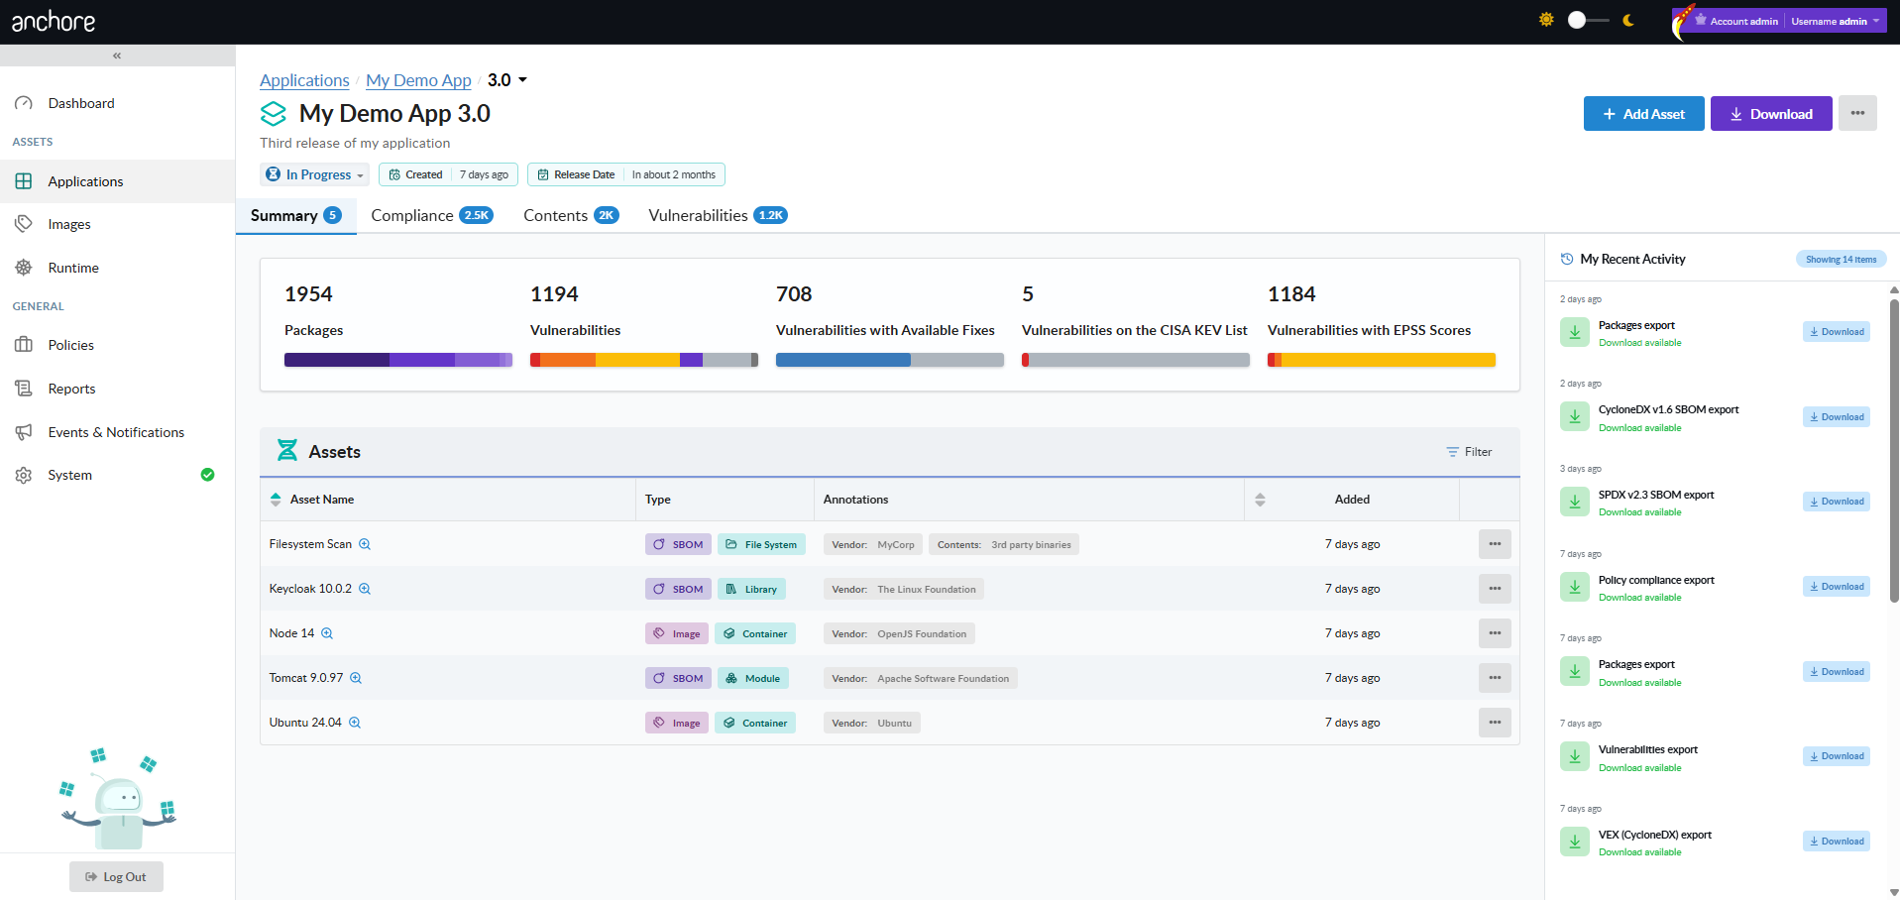
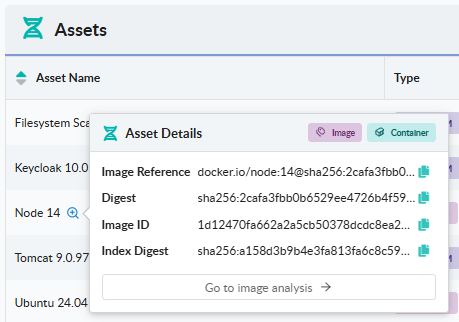
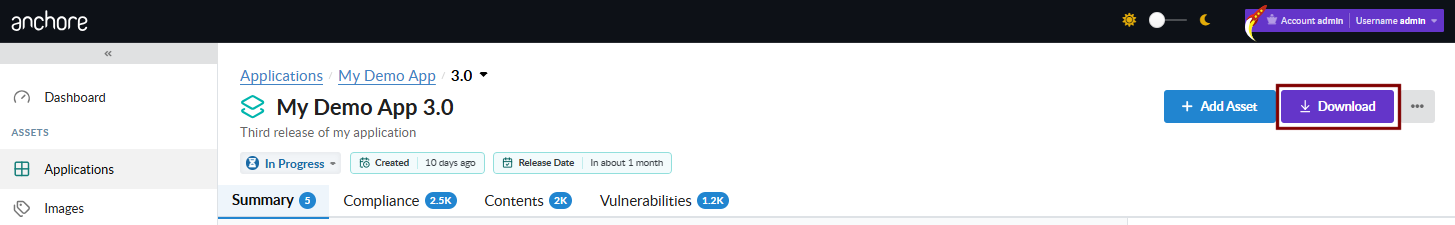
Once the asset-add job completes, open the app version detail page in the Anchore Enterprise GUI (Apps → my-vm-fleet → 2026-06-01) to see the analysis in context:
Summary tab — high-level asset and finding counts for the version.
Contents tab — every package discovered across the version’s assets, including the VM disk you just attached.
Vulnerabilities tab — every vulnerability surfaced from the version’s assets, sortable by Anchore Score.
Compliance tab — policy evaluation results, including findings that originate from the VM disk asset.
The same data is available programmatically:
# List the assets attached to the version (the VM asset should appear)anchorectl app version asset list 2026-06-01 --app my-vm-fleet
# List vulnerabilities aggregated across the versionanchorectl app version vuln list 2026-06-01 --app my-vm-fleet
# Download the SBOM for a specific assetanchorectl app version asset sbom get web-server-vm \
--app my-vm-fleet \
--version 2026-06-01 \
--file web-server-vm.sbom.json
You’ve now extended Anchore Enterprise’s SBOM-based analysis to virtual machines — either live (running VM) or offline (mounted disk image) — and attached the result to an app version where it sits alongside any other release artifacts. Repeat the same pattern for additional VMs in your fleet, or fold the disk-image variant into your VM build pipeline to catch issues before image distribution.
1.3 - Customize the Anchore Enterprise GUI
Customize the Anchore Enterprise GUI
When managing a complex security platform like Anchore Enterprise, communication and accessibility are key. Whether you’re alerting your security and development teams to upcoming maintenance or providing quick access to API documentation, the ability to customize your Anchore Enterprise deployment makes for a better user experience, that is tailored to your organization and use case.
These customizations are outlined below and can be easily made through the GUI System Configuration or programmatically via Helm values or Manual Config. Let’s run through what and how you can configure these.
Custom Message
A Custom Message can be displayed on the Anchore Enterprise GUI login view. You can specify a title and a message, both of which support Markdown formatting with any HTML tags removed.
Below is an example of a custom message title with a handy message below.
Custom Message
Recommendation: This can be a useful place to display messages, such as Legal Disclaimers. You can utilize Unicode characters, such as emojis, to help draw attention if required.
Configuration: Edit the config-ui.yaml file under the key custom_message and if you are using Helm tweak your values for anchoreConfig.ui.custom_message. Below is an example yaml configuration:
custom_message:title:"Custom message"message:"This is a handy custom message you can set"
Custom Banners
Custom Banners can be displayed on the Anchore Enterprise GUI across the top and/or bottom of the view. Each banner can have its own text, display mode (always, or login-only, where the banner is only displayed on the login view), as well as an optional background color and text color.
Below is an example of a top banner with always display mode, green background with white text 🚨🚨 ENVIRONMENT: DEMO 🚨🚨
Custom Banner
Recommendation: This can be a useful place to signpost users towards gaining access or displaying suitable messages, such as an upcoming maintenance window. You can utilize Unicode characters, such as emojis, to help draw attention if required.
Configuration: You can simply configure your Custom Banner via the GUI. Alternatively, edit the config-ui.yaml file under the key banners and if you are using Helm tweak your values for anchoreConfig.ui.banners. Below is an example yaml configuration:
banners:top:text:"🚨🚨 ENVIRONMENT: DEMO 🚨🚨"text_color:"white"background_color:"#32a883"display:"always"bottom:text:"Here is an example login only banner"text_color:"white"background_color:"#1e6ee6"display:"login-only"
Custom Links
Custom links can be displayed on the Anchore Enterprise GUI on the login page and also within the system dropdown menu (top-right in the main view). You can specify a title and up to 10 links with their own titles and URIs. This feature is only enabled if a main title and at least one link and associated title are provided. HTML tags will be removed.
An example below shows how the custom links section on mouse click/hover can be expanded on both the login page:
Login Links
and the system dropdown menu:
Top Nav links
Recommendation: This might be a useful place to link to your deployments copies of AnchoreCTL for the distributions used in your organisation (Windows, Linux, MacOS). This allows users to quickly find and download AnchoreCTL, and importantly, it will download the latest compatible version of AnchoreCTL. Developers also find having links to the Anchore Enterprise Swagger API docs useful.
Configuration: You can simply configure your Custom Links via the GUI. Alternatively, edit the config-ui.yaml file under the key custom_links and if you are using Helm, tweak your values under anchoreConfig.ui.custom_links. Below is an example Helm yaml configuration:
Users with an Administrator role can configure Custom Message, Custom Banners and Custom Links directly through the Anchore Enterprise GUI by navigating to System > Configuration.
You can make these changes, without the need to change Helm or application values requiring a redeployment of Anchore Enterprise. However, configuring these custom elements within the GUI, only works if you have NOT already defined the relevant custom values via config-ui.yaml, Helm values or environment variables.
The Web UI offers a helpful WYSIWYG editor allowing you to make changes instantly. Once you click ‘apply’ and then click ‘save’ on the configuration, refresh the page to see your custom changes. The example below shows adding a Top Custom Banner that has its display mode set to always appear.
Custom Banner Config
1.4 - Find Zero-day Vulnerabilities
Find vulnerabilities across your inventory of SBOMs.
This page outlines the workflow for locating zero-day vulnerabilities using Anchore Enterprise’s capabilities, most notably the GUI, reports, and API queries, by both package and vulnerability ID.
When a zero-day vulnerability is disclosed, your first response will be to try and understand your exposure: where in your software supply chain are the affected packages and versions used? In such situations, the Common Vulnerabilities and Exposures (CVE) record may not be fully published yet. This means that you might be searching for specific package versions and by vulnerability identifier, such as a GitHub Security Advisory (GHSA) number.
This quickstart covers image-scoped zero-day triage — both the Reports view and the Query API used here operate over the image catalog. App-version-scoped search and reporting is on the roadmap; in the meantime, see Scan an App Version for per-version vulnerability lookups.
Check Your Feeds
Anchore Enterprise relies on a large number of vulnerability data sources to bring you the most accurate vulnerability matching as possible. It could be that upstream sources already have knowledge of the vulnerability. Your first step should be to quickly check whether Anchore Enterprise has the latest vulnerability dataset.
In environments talking directly to the Anchore Data Service, you can force a feed sync by running the following command as the Anchore Enterprise administrator:
anchorectl feed sync
You can verify the latest feed updates using the following command:
anchorectl feed list
If you are using Anchore Enterprise in an air-gapped environment, you may need to refresh the vulnerability database (grypeDB) by sneaker-copying a bundle into the high-side environment or through the use of a Cross Domain Solution (CDS). See Air-gapped for further guidance.
Feed sync status can also be found in the Anchore Enterprise GUI under System and Feeds Sync.
Note that the Last Full Sync timestamp will reflect when the last necessary update was performed, by default Anchore Enterprise will check to determine whether an update is required every hour.
Feed sync status.
Search by Vulnerability ID
You can also use the Query API to list information about a given vulnerability ID, which can be a useful way to determine if your system is aware of the vulnerability. See /query/vulnerabilities in the API Reference
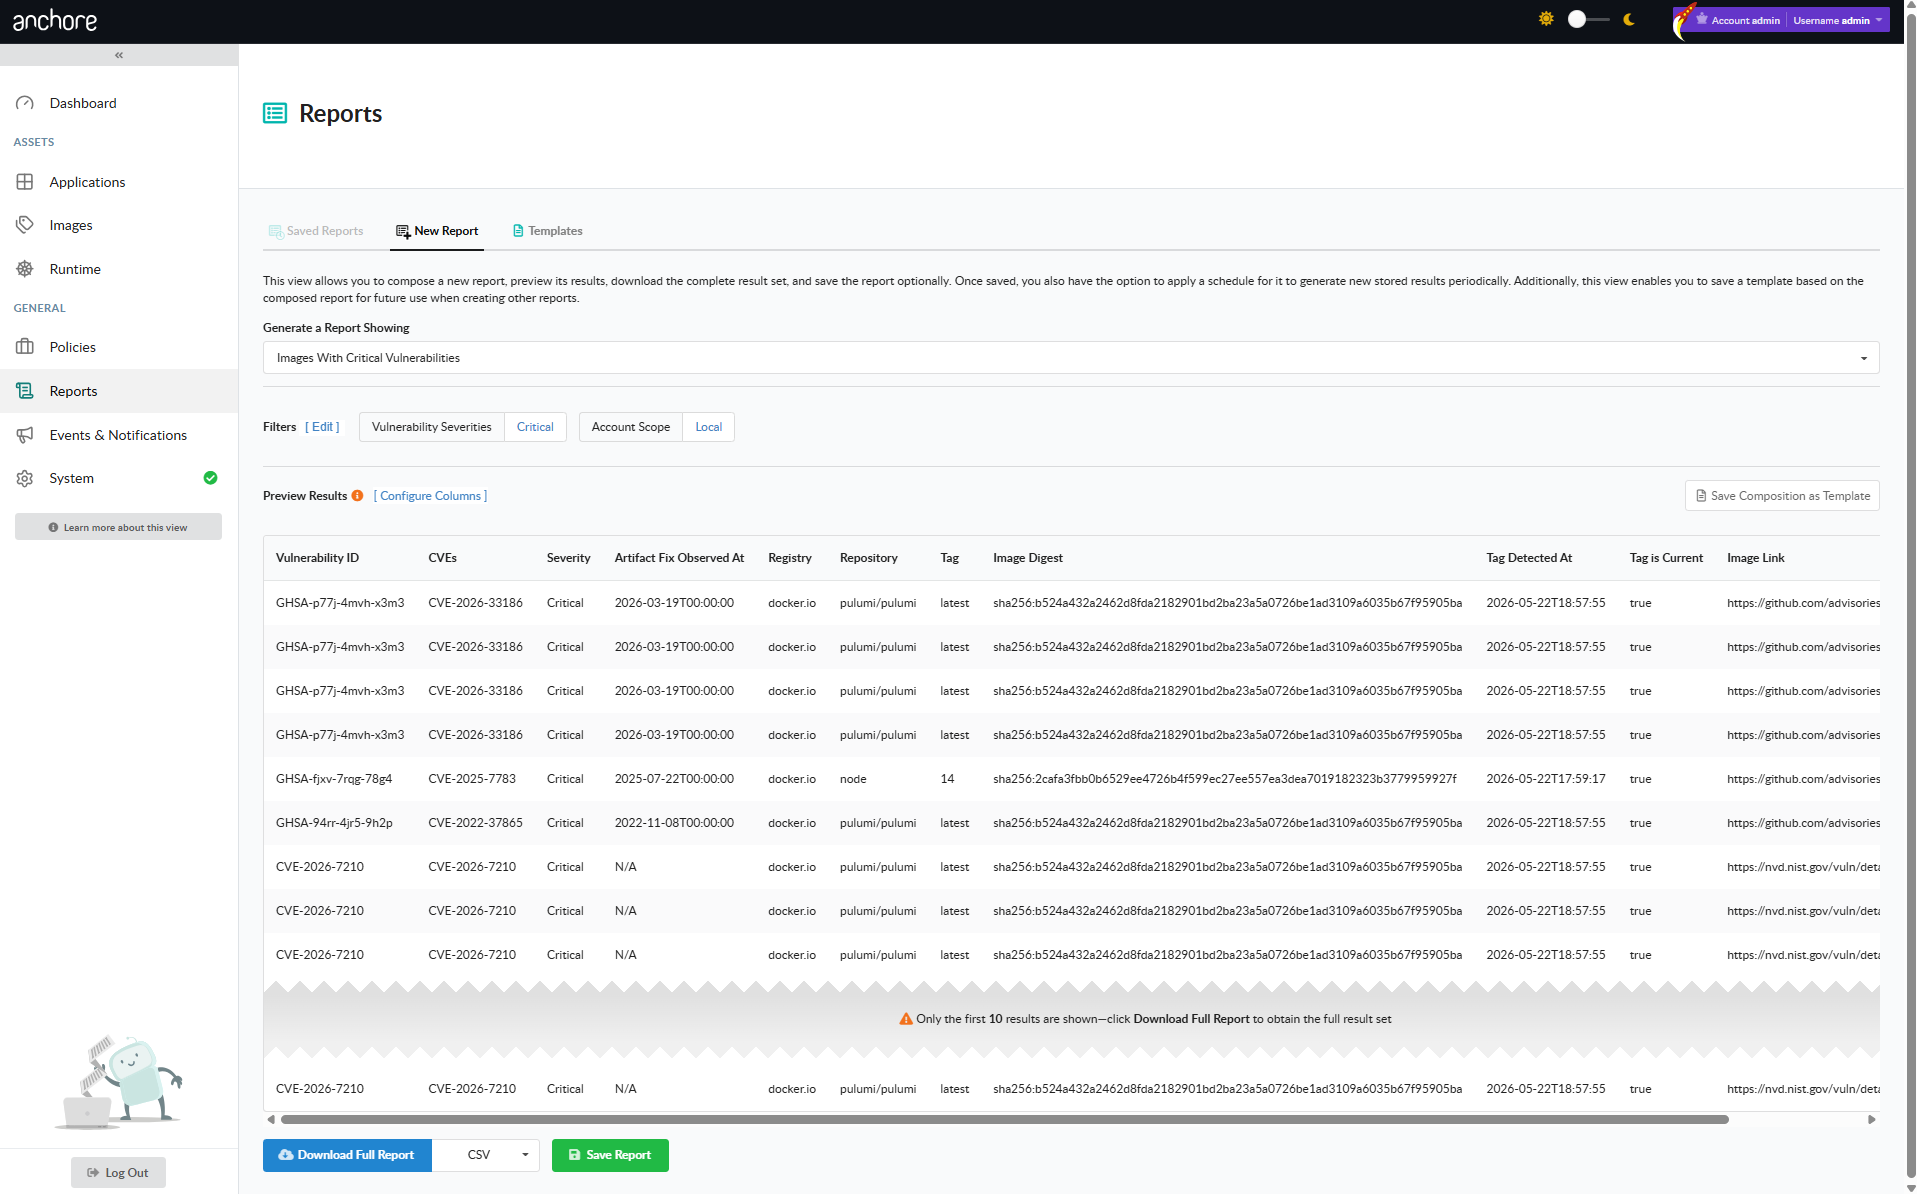
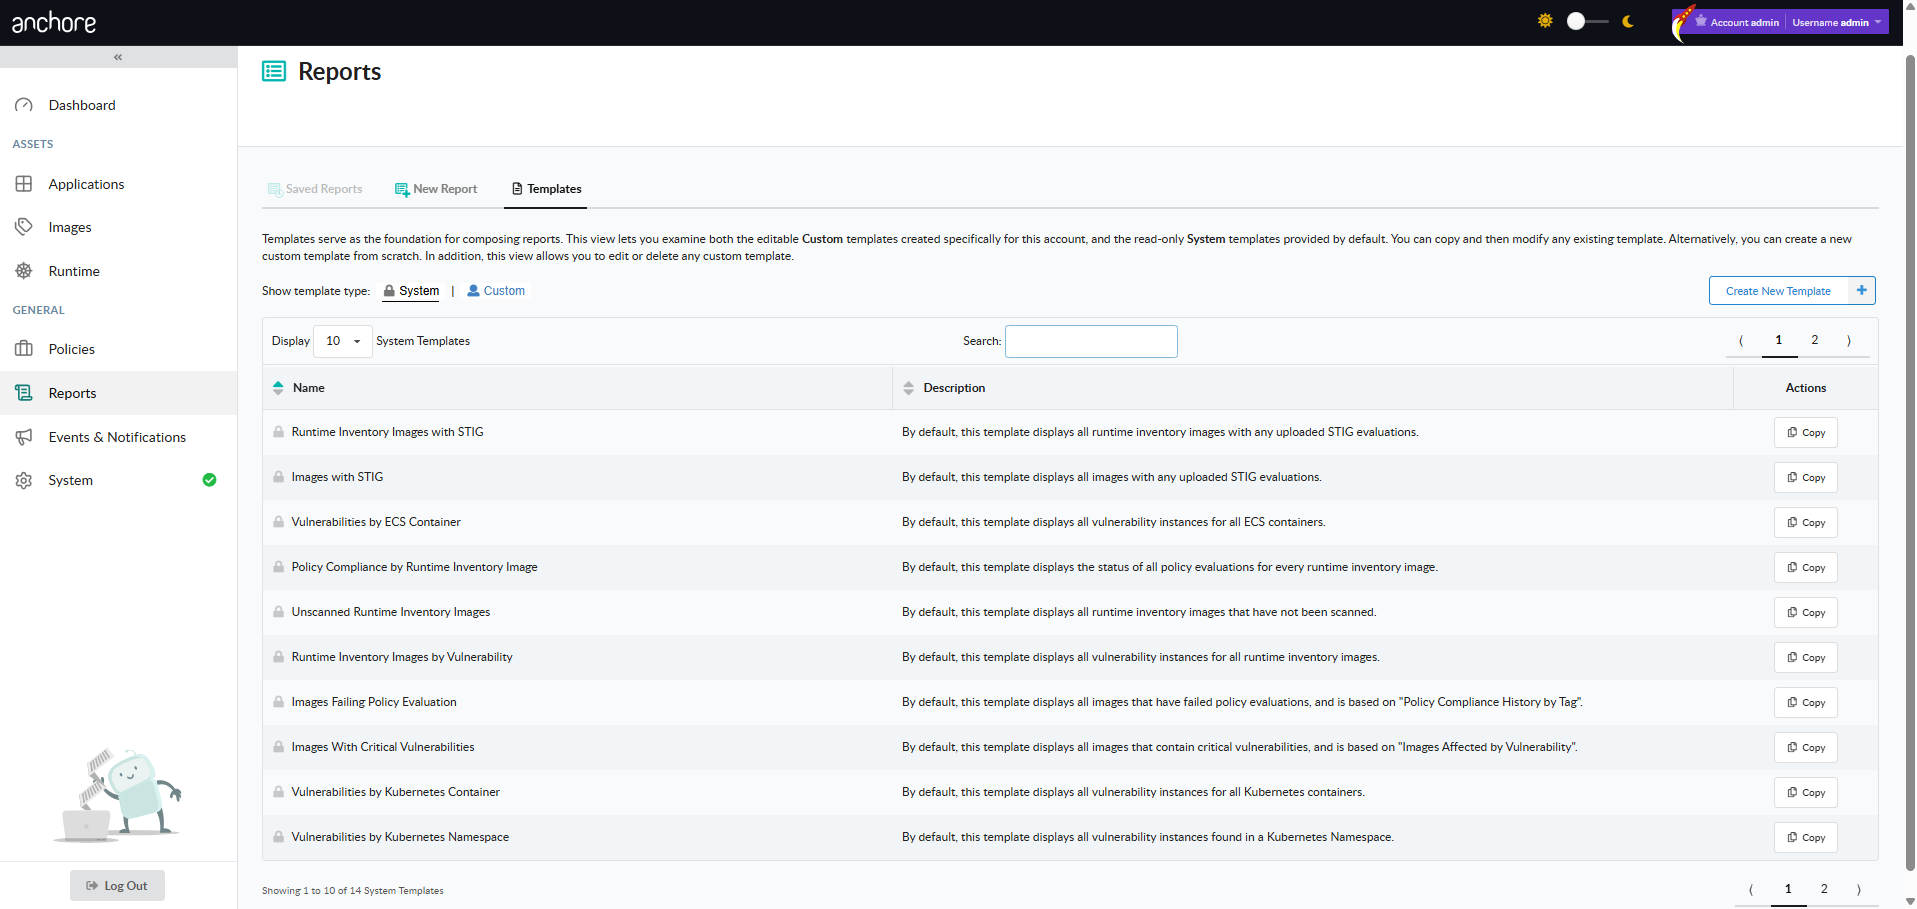
If you know the vulnerability ID, which could be either a CVE, GHSA, or other identifier, you can utilize the native reporting capability in Anchore Enterprise.
Click the Reports menu item
Choose a new report of Artifacts by Vulnerability.
Choose the Vulnerability Id filter and enter the appropriate identifier.
As you preview results, you can toggle the report scope. If you are the administrator you can run the report against all assets across all accounts.
Changing account scope: local or global
Once you have validated the desired outcome in the report preview, you can opt to Save Report, provide some details, and tick the option to Generate immediately on save.
You can also use this panel to schedule report generation for future dates and times, see Reporting & Remediation
Saving the report.
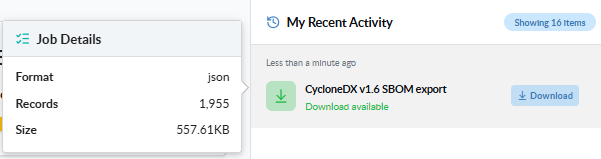
The report will then be generated in order to provide you results across the SBOMs for all of your assets. Once complete, the results are ready for download.
Ready for download!
You now have an understanding of where in your software supply chain this vulnerability can be found. Go remediate!
Search for Affected Packages
Sometimes you won’t have a vulnerability record available because it has not been created or appropriately updated. Another way to assess impact during a zero-day is to search for the specific package or library version known to be vulnerable. Fortunately, this can be done via the Anchore Enterprise API.
Use the Query API to look for specific package versions. In the case of CVE-2025-1974 (GHSA-mgvx-rpfc-9mpv), the impacted packages were k8s.io/ingress-nginx with versions v1.11.0 - 1.11.4.
The following query would be used to look for a particular version:
With this information, you can now remediate the impacted asset!
1.5 - Identify & Evaluate Images in Kubernetes Clusters
Identifying and analyzing images running in a Kubernetes cluster
Summary
This quickstart page outlines how Anchore Enterprise integrates directly with Kubernetes environments to support continuous security and operational assurance. By connecting the Kubernetes Inventory Agent and running it in your cluster, Anchore Enterprise collects a real-time software inventory of running workloads, aligning containerized operations with vulnerability detection, configuration assessment, and policy controls.
As organizations scale Kubernetes deployments, Anchore Enterprise enables continuous monitoring of runtime images, automated policy evaluation, and actionable reporting to strengthen workload hardening and operational compliance. Through runtime inventory and policy enforcement, teams can standardize security across clusters, surface risk early, and ensure that live container images meet organizational and regulatory requirements.
This quickstart is the fast path to a working agent. For deeper operational coverage:
Create a native user in Anchore Enterprise that uses the inventory-agent role permissions.
Create a values.yaml for the chart, setting your cluster name, Anchore Enterprise URL, and the credentials and account for the inventory-agent user you created above. See Kubernetes Runtime Inventory for the full values reference, including secret handling and inventory-retention options.
Install the Kubernetes Inventory Agent using Helm and the values file you built:
After deployment, verify the pod is up and running:
kubectl get pods -n anchore
The agent will automatically:
Discover all running pods and containers.
Collect image metadata and digest information.
Submit inventory to Anchore Enterprise.
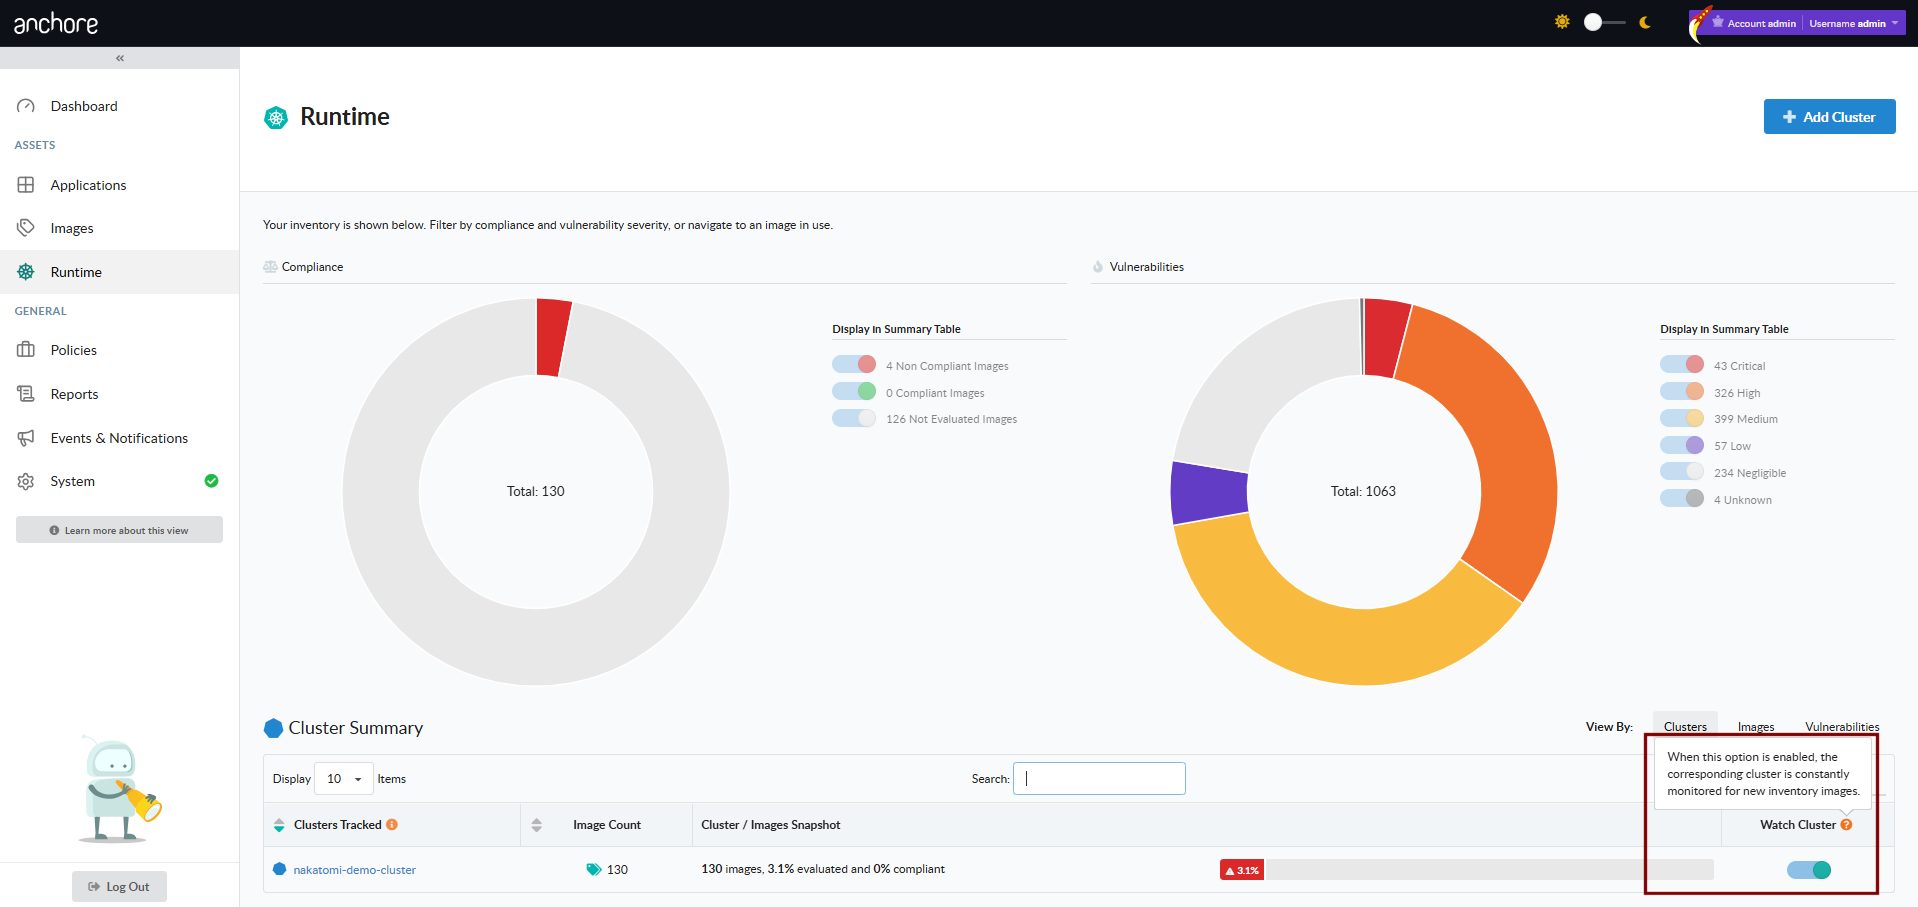
To have Anchore Enterprise automatically analyze the images the agent reports from a given cluster or namespace, activate a runtime_inventory subscription against the relevant key:
Once your cluster is connected, verify agent connectivity by checking the logs to confirm it’s reporting inventory and status as expected:
kubectl logs -n anchore <inventory-agent-pod>
View the Vulnerability Results of Running Images
Log in to the Anchore Enterprise GUI.
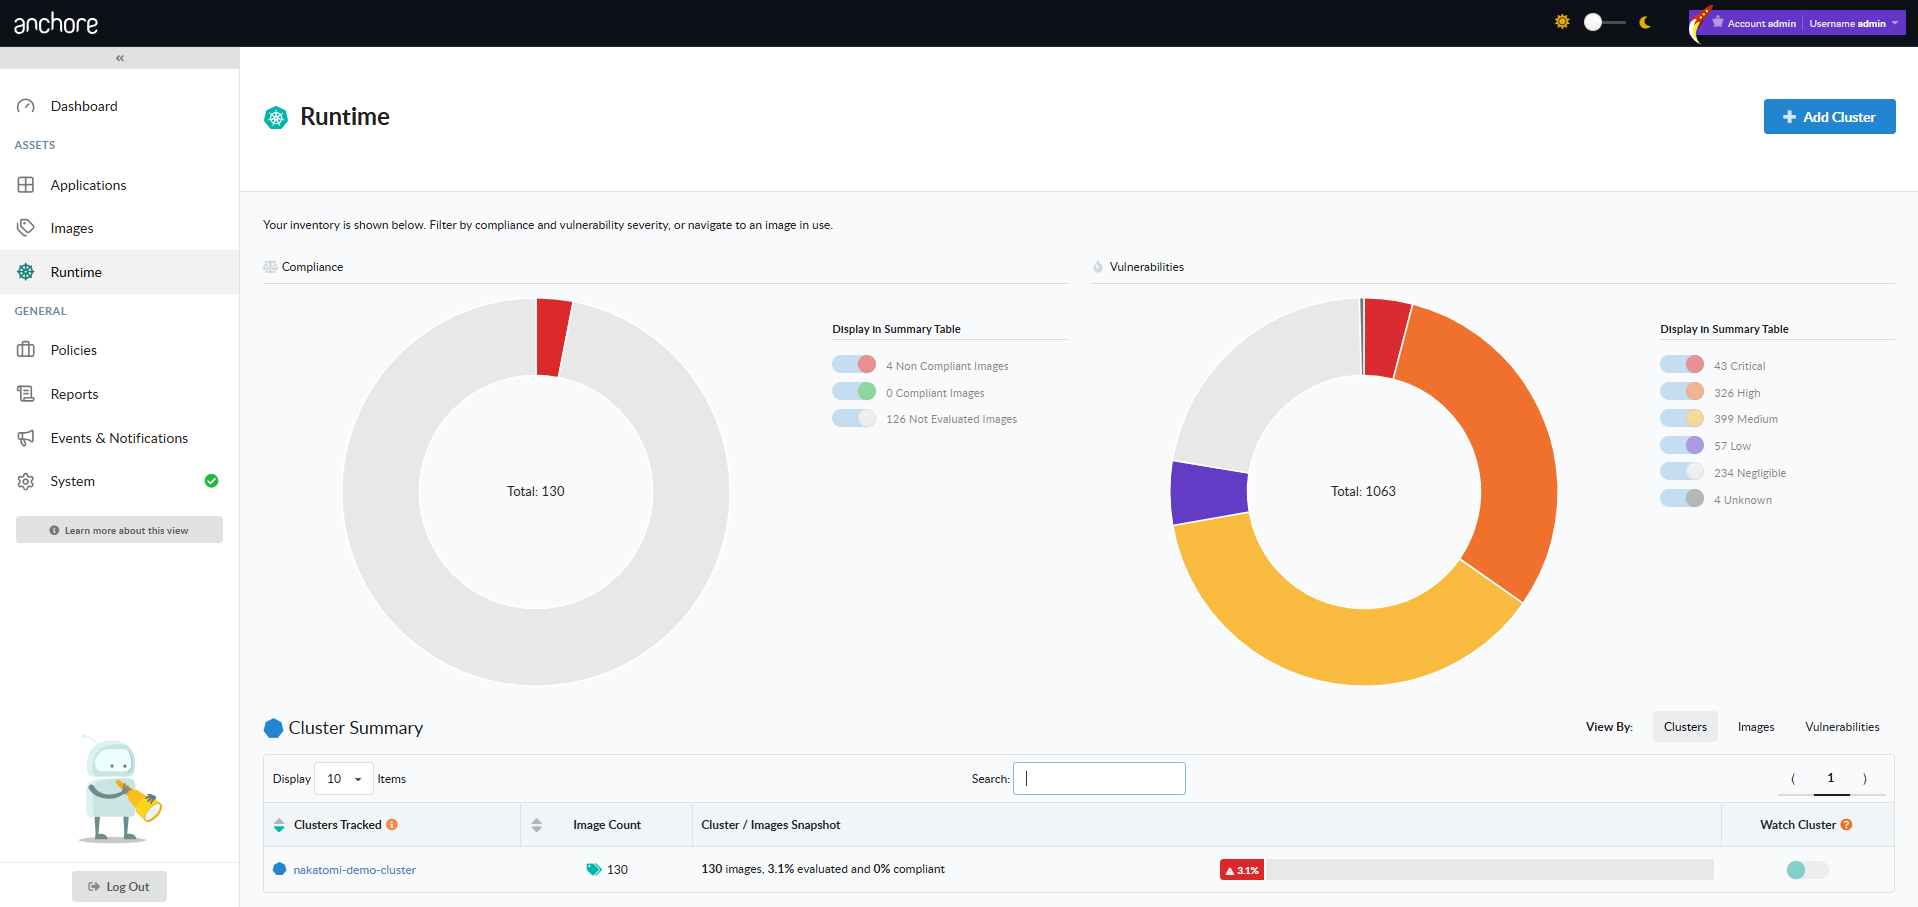
Navigate to the Kubernetes tab to access your running cluster data. Be aware that you may need to wait for a brief period for discovered data to appear.
Select your desired cluster. From here, You will get a real-time snapshot of what images are running and also be able to view:
The complete list of the running container images currently in use.
Vulnerabilities associated with each image, mapped to known CVEs.
CVSS scoring, severity distribution, and other helpful risk indicators so you can quickly spot anything that needs attention.
View and Enforce Policy Evaluations
Anchore Enterprise also lets you apply and enforce security policies directly against your running images—so you’re not just observing problems, you’re controlling them.
In the UI, go to Policies → Evaluation.
Choose the policy bundle you want to assess or enforce (for example, minimum CVSS severity thresholds, banned packages, or disallowed images).
Review the results, including:
Pass/Fail status for each image or cluster.
Detailed reasoning for policy violations, helping to guide remediation.
Optionally - if you want to take things a step further, configure notifications or enforcement actions (e.g., blocking deployment of non-compliant workloads) to keep risky images out of production.
Notes:
Confirm version compatibility between Anchore Enterprise and the Kubernetes Inventory Agent—mismatched versions can cause subtle reporting gaps or failed collections.
Keep the agent and policy bundles current, so you’re always scanning against the latest CVE data and enforcement rules rather than working off stale definitions.
Consider using role-based access control(RBAC) in Anchore Enterprise to protect sensitive results, ensuring that only authorized users can view vulnerability and policy data—especially in environments where findings may have compliance or confidentiality implications.
1.6 - Best Practices for Using Anchore Enterprise in CI
Integrating Anchore Enterprise into CI systems
This quickstart will walk you through the typical steps required to integrate Anchore Enterprise policy checks and vulnerability scans into your CI jobs.
Before You Start
In order to start instrumenting your CI pipelines with AnchoreCTL, you need to ensure the following:
You have access to a fully operational Anchore Enterprise deployment, with a provisioned account/tenant for your use.
The Anchore Enterprise API should be accessible from your CI runner(s).
Your Anchore Enterprise deployment and your CI runner(s) can reach any relevant container registries from which to source images.
Get AnchoreCTL
Anchore Enterprise can be integrated into various CI systems in a vendor-agnostic manner using the AnchoreCTL tool. AnchoreCTL is a golang binary which can be used to interact with an Anchore Enterprise deployment. To ensure compatibility and simplify runner configuration, AnchoreCTL should always be version-aligned with your Anchore Enterprise deployment.
A recommended practice is to fetch AnchoreCTL directly from your Anchore Enterprise installation during the CI job. This guarantees the client version matches the server. Insert a command such as the following into your job before you want to conduct a scan and evaluation:
curl -X GET "https://my-anchore.example.com/v2/system/anchorectl?operating_system=linux&architecture=amd64"\
-H "accept: */*" | tar -zx anchorectl
AnchoreCTL can talk to an Anchore Enterprise deployment using username and password for authentication, or via API keys. The latter is recommended and otherwise commonly used if you are signing into Anchore Enterprise via SSO.
Configure an API key so your job can talk to the Anchore Enterprise API, see Using API keys for instructions.
Add Environment Variables
You’ll typically want to store AnchoreCTL configuration such as connection details in environment variables for your CI job. At a minimum, you will want to set or configure the following in your CI job specification:
ANCHORECTL_URL
ANCHORECTL_USERNAME
ANCHORECTL_PASSWORD
ANCHORECTL_UI_URL
The ANCHORECTL_UI_URL variable ensures that HTML outputs from anchorectl commands will contain deep links to the Anchore Enterprise GUI for assets.
Alternatively, you could also construct an AnchoreCTL configuration file and use that. See Configuring AnchoreCTL for further details on possible parameters.
You can also run anchorectl –help | grep ANCHORECTL_ to see a list of common environment variables
Choose Your Pathway
Two CI integration shapes are supported in Anchore Enterprise v6. Pick the one that matches what your CI job is already doing — both work with any CI system and both use AnchoreCTL, but the Anchore Enterprise step in your pipeline is different in each case.
Your CI builds container images and you want fast pass/fail gating on vulnerabilities and policy, without binding the result to a release
AnchoreCTL adds the image to the image catalog, then reads vulnerability and policy results back inline
Pathway A fits teams who have standardized on producing SBOMs upstream and treat Anchore Enterprise as the evaluation, aggregation, and evidence layer over those SBOMs. Pathway B is a straightforward entry point for CI jobs that build container images — image in, results out, no app or version bookkeeping.
The rest of this quickstart documents both pathways. Click into the one that matches your situation and follow it through to the conclusion — the two pathways are independent.
Pathway A — SBOM Upload to an App Version
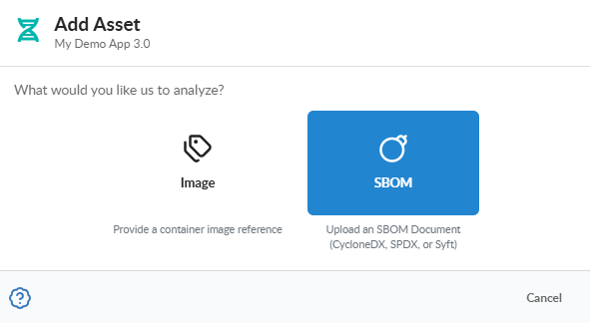
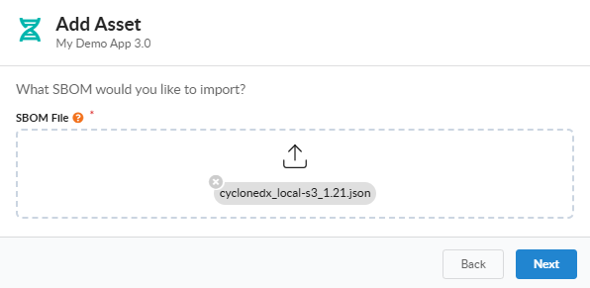
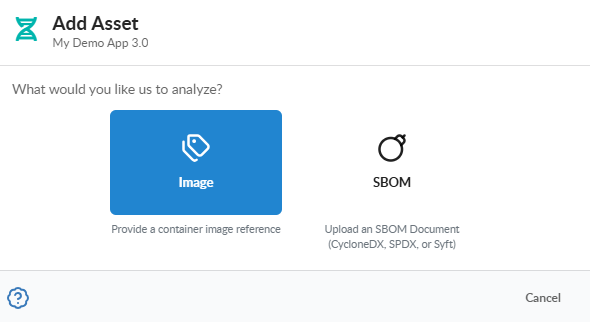
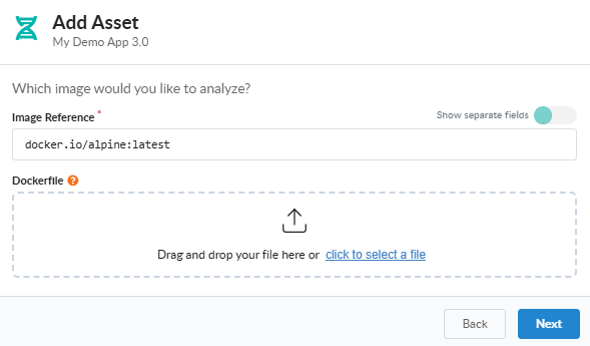
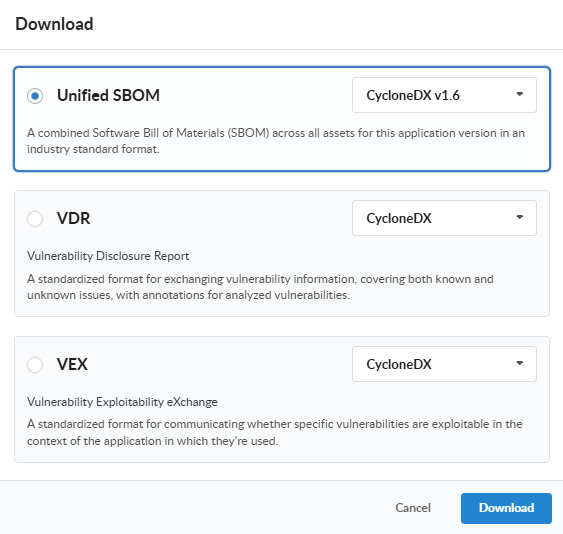
In this pathway your CI job has already produced an SBOM in an earlier step. Any supported SBOM format — CycloneDX, SPDX, or Syft-native JSON — can be uploaded. The Anchore Enterprise step then attaches the SBOM to an app version as an asset, and reads vulnerability and policy results back at the version level.
App and Version Setup
Pathway A presumes the target app and version already exist in Anchore Enterprise. You can create them once during release setup, or as part of the CI job itself:
Builds the artifact and produces an SBOM via the user’s chosen tool
Downloads AnchoreCTL from Anchore Enterprise
Uploads the SBOM as an asset on the target app version
Reads vulnerability and policy results back at the version level
Fails the CI job step if the policy evaluation result is fail
The sequence of commands looks something like this (simplified):
# Earlier step has produced ./api.sbom.json — any CycloneDX / SPDX / Syft JSON document# Download AnchoreCTLcurl -X GET "https://my-anchore.example.com/v2/system/anchorectl?operating_system=linux&architecture=amd64"\
-H "accept: */*" | tar -zx anchorectl
# Upload the SBOM as an asset on the target app versionanchorectl app version asset add sbom ./api.sbom.json \
--app my-service \
--version 1.4.0 \
--asset api-image \
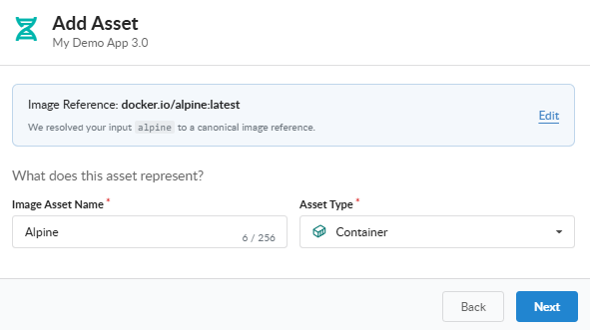
--type container \
--wait
# Get vulnerability results for the app versionanchorectl app version vuln list 1.4.0 --app my-service
# Get the per-finding detail — specific gates, triggers, and remediation recommendations behind the verdictanchorectl app version policy findings list 1.4.0 --app my-service
# Check policy statusanchorectl app version policy status get 1.4.0 --app my-service -f
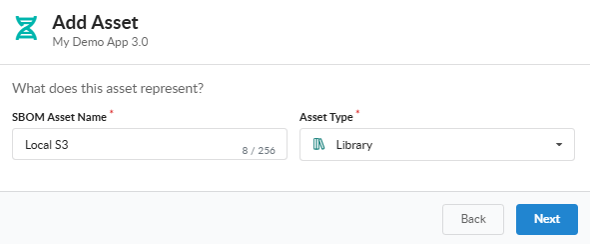
The --type flag on the asset-add declares what the SBOM describes — set container for a container image SBOM, filesystem for a directory analysis, library for a single library binary, and so on. See Asset Types for the full enum.
The --wait flag blocks until the asset-add job reaches a terminal state, so the subsequent vuln list and policy commands operate on fully processed data.
The -f flag — shorthand for --fail-based-on-results — gives the policy status get command a return code of 1 when the policy evaluation result is fail. The non-zero exit is what fails the CI job step.
Customize Artifacts
The app version vuln, app version policy, and app version export command trees all expose -o for output format selection. Common patterns:
app version vuln list ... -o json — programmatic vulnerability results for downstream tooling.
app version policy findings list ... -o json — programmatic policy results for build-gating logic.
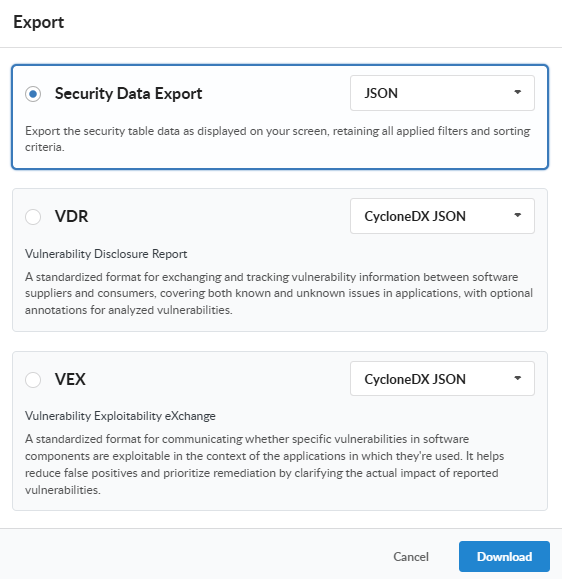
app version export vulnerabilities and app version export vex produce formal documents (CSV vulnerability report and CycloneDX VEX, respectively) that you can attach as build artifacts. See Evidence for the full export surface.
Use Policy Checks
Pathway A’s policy gating operates at the app-version level. Use the following command to retrieve the app version’s policy status and fail the CI job if it does not meet compliance requirements:
anchorectl app version policy status get 1.4.0 --app my-service -f
For the per-finding detail — the specific gates, triggers, and remediation recommendations behind a failing result — list the findings:
anchorectl app version policy findings list 1.4.0 --app my-service
Performance tuning happens upstream. Because the SBOM is generated by your CI’s chosen tool before the Anchore Enterprise step, SBOM-generation performance is determined by that tool’s settings rather than by AnchoreCTL. The ANCHORECTL_SYFT_PARALLELISM knob covered in Pathway B’s Optimize Performance section applies only when AnchoreCTL is the SBOM generator.
No app-version equivalent of One-Time Scan. Pathway A currently has no stateless mode — every uploaded SBOM is stored against the app version. If you need a stateless evaluation flow, anchorectl image one-time-scan in Pathway B is the only path today.
In this pathway your CI job builds a container image and asks Anchore Enterprise to analyze it directly. The image and its findings live in the image catalog; no app or app version is involved.
Both modes work with any CI/CD system as long as the AnchoreCTL binary can be installed and run, and you can access the Enterprise APIs directly.
Distributed Analysis (Recommended)
In Distributed Analysis, SBOM generation happens locally on the runner and is then sent to Anchore Enterprise for evaluation.
It is the recommended approach because it offers maximum flexibility in resourcing. You can potentially reduce the time to generate an SBOM by customising your AnchoreCTL configuration and providing more CPU and fast I/O to your pipeline runners.
Distributed analysis does not currently support malware scanning. If malware scanning is required, use Centralized Analysis below.
To use distributed analysis, construct your CI job to use AnchoreCTL with the --from parameter, for example:
This will cause AnchoreCTL in your job to download the image from the given source and generate the SBOM locally on the runner.
Centralized Analysis
In Centralized Analysis, the AnchoreCTL command is used to ask your Anchore Enterprise deployment to download and analyze the image content. This is necessary if you require the malware scanning service to unpack and scan container layers.
If you are using Centralized Analysis for Malware support, you may need to enable this in your deployment configuration, see Malware Scanning.
To use centralized analysis, omit the --from parameter, for example:
Centralized analysis will have a different performance profile for SBOM generation, since you may not have direct control over resourcing of your Anchore Enterprise shared service.
Construct Your Workflow
You’re now ready to put AnchoreCTL commands into your CI jobs. For a container-focused use-case, you will generally construct a job which:
Builds a container image and pushes to a staging registry
Downloads AnchoreCTL from Anchore Enterprise
Generates an SBOM of the container image
Conducts a vulnerability analysis, returning results
Conducts a policy check, returning the evaluation result
The sequence of commands looks something like this (simplified):
# Build a docker image for your projectdocker build -t <DOCKER_USERNAME>/getting-started-todo-app .
# Push the image to a staging registry (you can also skip this step by using --from docker in the next command)docker push <DOCKER_USERNAME>/getting-started-todo-app
# Download AnchoreCTLcurl -X GET "https://my-anchore.example.com/v2/system/anchorectl?operating_system=linux&architecture=amd64"\
-H "accept: */*" | tar -zx anchorectl
# Generate the SBOM for the image (distributed in this example) and wait for analysis to completeanchorectl image add <DOCKER_USERNAME>/getting-started-todo-app --from registry --wait
# Get vulnerability results for the imageanchorectl image vulnerabilities <DOCKER_USERNAME>/getting-started-todo-app
# Get policy evaluation results for the imageanchorectl image check <DOCKER_USERNAME>/getting-started-todo-app
Based on the results returned by Anchore Enterprise, you can then decide what additional steps to take in your CI job.
Customize Artifacts
The various anchorectl image commands have options for outputs, selected using the -o parameter. You might opt to return results as text, machine-readable JSON, CSV, or HTML. This material can be useful if you intend to have additional steps in your job work based on results, rather than just pass or fail.
AnchoreCTL supports an HTML format for vulnerability and policy check reports, for example:
anchorectl image check ghcr.io/place/thing:v0.1.0 --detail -f -o html > policy.html
If you set ANCHORECTL_UI_URL or ui-url in your AnchoreCTL configuration, you’ll get a handy link in the HTML which takes you straight into the Anchore Enterprise GUI for that image.
Optimize Performance
With a basic workflow constructed, you might want to optimize SBOM generation, vulnerability scan, and policy check times.
If you are using Distributed Analysis, ensure your CI runners have fast CPU and I/O to optimize the cataloging and SBOM generation process used by AnchoreCTL.
If your container images contain a large number of files and packages, you may be able to significantly reduce SBOM generation time by enabling parallelism. AnchoreCTL can run catalogers in parallel rather than sequentially.
You can configure the number of concurrent worker processes using the ANCHORECTL_SYFT_PARALLELISM environment variable (or set it in anchorectl.yaml). For optimal performance, try aligning the number of workers with your runner’s available vCPUs:
# Example for an 8 vCPU runnerANCHORECTL_SYFT_PARALLELISM=8
Rather than just reviewing a raw list of vulnerabilities, which can be daunting and lack context, it is a best practice to use the Anchore Enterprise policy engine to conduct compliance checks.
Policy-driven gating provides developers with precise, actionable feedback based on your own organizational policy or industry standards (e.g., NIST 800-53, CIS).
Use the following command to evaluate an image against your default policy and fail the CI job if it does not meet compliance requirements:
The --detail flag provides the specific gate, trigger, and remediation recommendations needed to resolve policy violations — useful for developer-facing feedback.
The -f flag (shorthand for --fail-based-on-results) gives the command a return code of 1 if the policy evaluation result is fail. This is what fails the CI job step.
If you wish to store output as artifacts, use the -o parameter and save accordingly.
Switch to Stateless Scans (One-Time Scan)
By default, adding an image to Anchore Enterprise for analysis means the SBOM is stored persistently in the deployment, until archived or deleted. For some CI use cases you may not need the SBOM to persist.
Anchore Enterprise has a feature called One-Time Scan which delivers fast feedback in your pipeline jobs — vulnerability and policy analysis results — without persisting the SBOM. Use the anchorectl image one-time-scan command to conduct analysis in this mode. You can also pass a flag to fail the pipeline job if the policy analysis fails:
By default this command returns a policy check. Using the -o json parameter, JSON results for policy check, vulnerability scan, and the SBOM are returned together. These results can then be machine-parsed by the CI job to determine actions.
You’ve now fully instrumented your pipeline to add high-fidelity SBOM-based vulnerability and compliance checks to your CI jobs.
2 - Deploying Anchore Enterprise
Anchore Enterprise and its components are delivered as Docker container images which can be deployed as co-located, fully distributed, or anything in-between. Anchore Enterprise can run on a single host or be deployed in a scale out pattern for increased analysis throughput.
To get up and running, jump to the following guides of your choosing:
Anchore Enterprise Container Images
You need a Dockerhub PAT from Anchore Customer Success in order to download the Anchore Enterprise Container Images
This section details the general requirements for running Anchore Enterprise. For a conceptual understanding of Anchore Enterprise, please see the Overview topic prior to deploying the software.
Runtime
Anchore Enterprise requires a Docker compatible runtime (version 1.12 or higher) on either AMD or Intel-based amd64 architecture.
Deployment is supported on:
Docker Compose (only recommended for testing, for example demo or proof-of-concept < 1000 SBOMs)
Any Kubernetes Certified Service Provider (KSCP) as certified by the Cloud Native Computing Foundation (CNCF) via Helm.
Any Kubernetes Certified Distribution as certified by the Cloud Native Computing Foundation (CNCF) via Helm.
Amazon Elastic Container Service (ECS) via Helm.
Resourcing
Use-case and usage patterns will determine the resource requirements for Anchore Enterprise. When deploying via Helm (package manager for Kubernetes), requests and limits are set in the values.yaml file. When deploying via Docker Compose, add reservations and limits into your Docker Compose file. The following recommendations can get you started:
Requests specify the desired resource amounts for the container, while limits specify the maximum resource amounts the container is allowed. To achieve best QoS (quality-of-service) with Helm deployments, it’s recommended to set requests equal to limits for allocated memory units and to set requests only with no limits set for allocated CPU units.
It’s not recommended to set less than 1 CPU unit for any container. Less than this could result in unexpected behaviour and should only be used in testing scenarios.
For the api, catalog, policy, and postgresql service containers, a minimum of 2 CPU units is recommended.
For Production use with Helm deployments, it’s recommended to set memory units to a minimum of 16G for the analyzer and policy services and 8G for all other services - where requests equals limits for all services. Less than these values could result in OOM errors or containers restarting unexpectedly.
If you intend on using Kubernetes, the default values.yaml found in the Anchore Enterprise Helm Chart provides some resourcing recommendations to get you started.
The memory footprint for Production use is recommended to better support performance improvements with the image analysis system in recent versions of Anchore Enterprise in addition to high-volume workloads, where a substantial number of images are being analyzed.
When considering horizontal scaling, generally look to maintain a 4:1 analyzer service to core services (api, catalog, and policy) ratio. For example, an 4 analyzer deployment should generally have 1 api, 1 catalog, and 1 policy replica. An 8 analyzer deployment should generally have 2 api, 2 catalog, and 2 policy replicas.
Database
The only service dependency strictly required by Anchore Enterprise is a PostgreSQL database (17.x or higher) that all services connect to. The database is centralized simply for ease of management and operation. For an architectural overview, go to Anchore Enterprise Architecture.
Anchore Enterprise v6 now requires the pg_cron extension in addition to PostgreSQL 17 or higher. We also recommend setting cron.use_background_workers = on in the PostgreSQL configuration.
Use a managed service such as Amazon RDS for PostgreSQL, or a self-managed instance such as CloudNativePG (CNPG).
For production deployments, Anchore Enterprise does not ship with a database service.
Helm: The Anchore Enterprise Helm chart does not include a bundled PostgreSQL database. Provision an external PostgreSQL 17 instance with the pg_cron extension before deploying. This may mean building a custom PostgreSQL 17 image that includes pg_cron and pushing it to a registry your cluster can reach.
Docker Compose: The Compose deployment includes a PostgreSQL container, built from a Dockerfile that adds pg_cron automatically. Docker Compose is intended for testing and evaluation only; use an external, managed database for production.
Anchore Enterprise is database-intensive. Depending on the scale of the deployment, hundreds to thousands of concurrent connections may be required. The PostgreSQL database used for Anchore Enterprise should be dedicated and not co-located with any other applications that use a PostgreSQL backend. Anchore Enterprise requires a readable and writable PostgreSQL endpoint; read replica endpoints are not supported at this time.
Anchore Enterprise uses this database to provide persistent storage for image, policy and analysis data. Database storage requirements are based on the number of SBOMs and how long these need to be stored in the active set (i.e. not archived to analysis archive/s3 or deleted). Each SBOM and its respective packages are indexed in the DB, so SBOM complexity also requires increased database storage. Runtime adds a further requirement here.
As an Anchore Enterprise deployment grows (whether through a larger volume of SBOMs, higher analysis throughput, or longer data retention), the database requires proportionally more storage, CPU, and memory. Plan to scale these resources in step with your deployment’s growth.
We suggest configuring a default artifact lifecycle policy and/or archival rules and monitoring database storage usage closely according to your use-case. Size your initial DB as roughly 50MB per image in your active set and use object storage for archive (see below).
For production deployments, we recommend monitoring database storage, CPU, and memory usage continuously (for example, using Prometheus and Grafana). Set alerts for approaching resource thresholds so you can scale proactively. Also keep in mind that certain backup strategies (for example, logical dumps or snapshot-based backups) may temporarily require a significant amount of additional free storage on the database volume.
Anchore Enterprise upgrade paths are forward-only; rollback is not supported. A database backup taken immediately before an upgrade is your only recovery path. Due to the wide variation in deployment methodologies and configurations inherent to on-premise software, Anchore cannot prescribe a specific backup strategy. You are responsible for establishing and testing a backup and recovery procedure that is appropriate for your environment.
We recommend against using connection pooling for your database (such as pg_bouncer), as it has been known to cause issues with Anchore Enterprise, which does its own connection pooling using SQLAlchemy.
Shared Memory
Anchore Enterprise ingests SBOMs through PostgreSQL queries that may execute in parallel. PostgreSQL’s parallel workers communicate via dynamic shared memory (/dev/shm on Linux), and ingesting large SBOMs can request 20 MiB or more per query. Ensure the database host has sufficient shared memory available:
Kubernetes / Helm: If running PostgreSQL in-cluster, mount a tmpfs volume at /dev/shm of at least 1 GiB on the database container, with 2-4 GiB recommended for high-throughput deployments or when work_mem is tuned above defaults. When using an external managed database, this is handled by your provider.
Amazon RDS / Aurora: AWS sizes shared memory per instance class. No customer-side tuning is required, but very small instance classes (for example db.t3.micro) may struggle with large SBOMs under concurrency. Size your instance to your expected SBOM workload.
Self-managed PostgreSQL: The Linux tmpfs default (typically half of system RAM) is generally sufficient. If you have explicitly constrained /dev/shm, size it as roughly work_mem × max_parallel_workers_per_gather per concurrent query, with a minimum of 1 GiB.
Insufficient shared memory typically manifests as transient could not resize shared memory segment errors during SBOM upload, particularly for SBOMs containing many thousands of packages.
External Object Store
Configuring an external object store can significantly reduce database size and total cost of ownership (TCO) by offloading analysis data to object storage (for example, Amazon S3).
When using an external object store alongside the database, both must be backed up at the exact same point in time to ensure data consistency. Use a coordinated backup service (for example, AWS Backup) that can snapshot both resources simultaneously.
Network
An Anchore Enterprise deployment requires the following three categories of network access:
Service Access
Connectivity between Anchore Enterprise services, including access to an external database.
Registry Access
Network connectivity, including DNS resolution, to the registries from which Anchore Enterprise needs to download images.
Anchore Data Service (ADS) Access
Anchore Enterprise requires access to the datasets in order to perform analysis and vulnerability matching. See Anchore Enterprise Data Feeds for more information.
The Data Syncer service needs to communicate with the Anchore Data Service and it may be necessary to whitelist the Anchore Data Service endpoint if it’s blocked within your environment for proper dataset retrieval. See Data Feeds for more information.
Security
Anchore Enterprise is deployed from source repositories or container images that can be run manually using Docker Compose, Kubernetes, or any other supported container platform.
By default, Anchore Enterprise does not require any special permissions. It can be run as an unprivileged container with no access to the underlying Docker host.
Anchore Enterprise can be configured to pull images through the Docker socket. However, this configuration is not recommended, as it grants the Anchore Enterprise container added privileges and may incur a performance impact on the underlying Docker host.
Storage
Anchore Enterprise can be configured to depend on other storage for various artifacts. For full details on storage configuration, see Storage Configuration.
Configuration volumes:
this volume is used to provide persistent storage to the container from which it will read its configuration files, and optionally - certificates. Requirement: Less than 1MB.
[Optional] Scratch space:
this temporary storage volume is recommended but not required. During the analysis of images, Anchore Enterprise downloads and extracts all of the layers required for an image. These layers are extracted and analyzed, after which, the layers and extracted data are deleted. If a temporary storage is not configured, then the container’s/worker node’s ephemeral storage will be used to store temporary files. However, performance is likely be improved by using a dedicated volume. Scratch volumes do not need storage redundancy. For further information see Scratch
[Optional] Layer cache:
another temporary storage volume may also be used for image-layer caching to speed up analysis. This caches image layers for re-use by analyzers when generating an SBOM / analyzing an image. For further information see Layer Caching
When configuring scratch and layer cache, the size of these volumes should generally be three times the uncompressed image size to be analyzed.
A temporary volume is required to work around a kernel driver bug for container hosts that use OverlayFS or OverlayFS2 storage, with a kernel older than 4.13.
[Optional] Object Storage and Analysis Archiving:
Anchore Enterprise stores image analysis data and policy documents as JSON objects. By default these are stored in PostgreSQL. For larger deployments, the active data set can be offloaded to Amazon S3 or an S3-compatible provider, and completed analyses can be moved to a separate archive to reduce database load. Requirement: approximately 10MB per image. For further information, see Object Storage Configuration and Analysis Archive Configuration.
The estimated storage requirements for object should be the total number of images x 10MB
Anchore Enterprise UI
The Anchore Enterprise UI module interfaces with Anchore API using the external API endpoint. The UI requires access to the Anchore database where it creates its own namespace for persistent configuration storage. Additionally, a Redis database deployed and managed by Anchore Enterprise through the supported deployment mechanisms is used to store session information.
Network
Ingress
The Anchore Enterprise UI module publishes a web UI service by default on port 3000, however, this port can be remapped.
Egress
The Anchore Enterprise UI module requires access to three network services at the minimum:
External API endpoint (typically port 8228)
Redis Database (typically port 6379)
PostgreSQL Database (typically port 5432)
Redis Service
Version 7.4.6 or higher
Optimize Your Deployment
Optimizing your Anchore Enterprise deployment on Kubernetes, involves various strategies to enhance performance, reliability, and scalability. Here are some key tips:
Ensure that your Analyzer, API, Catalog, and Policy service containers have adequate CPU and memory resources. Each service has reference recommendations which can be found in the Anchore Enterprise chart values.yaml.
Each pod can make between 30 and 100 connections to the database so ensure max_connections is set appropriately (at least 500).
Integrate with monitoring tools like Prometheus and Grafana to monitor key metrics like CPU, memory usage, analysis times, and feed sync status. You can also Set up alerts for critical thresholds. Follow our guide on Prometheus and Grafana setup Monitoring guides
For large deployments, it is good practice to Schedule regular vacuuming, indexing, and performance tuning to keep the database running efficiently.
Layer caching in Docker can significantly speed up the image build process by reusing layers that haven’t changed, reducing build times and improving efficiency. Follow our guide on Layer Caching setup
Keep in mind Anchore Enterprise supports tenancy by means of Accounts. We suggest at a minimum creating an
account besides the admin account to use for normal Anchore Enterprise tasks.
Next Steps
If you feel you have a solid grasp of the requirements for deploying Anchore Enterprise, we recommend following one of our installation guides.
2.2 - Deploy using Docker Compose
In this topic, you’ll learn how to use Docker Compose to get up and running with a stand-alone Anchore Enterprise deployment.
Deploying in an air-gapped (offline) environment? Start with Deploy Air-Gapped using Docker Compose, which covers preparing and moving the container images before you return to the deployment steps on this page.
Docker Compose is only recommended for testing (e.g. demo or proof-of-concept) (< 1000 SBOMs), production is by support exception from Anchore Customer Success. For all other usage patterns, customers should use either the Anchore Enterprise Cloud Image, or a Helm-based deployment on K8s which enables easier scaling, modular deployment and fine-grained configuration
Before moving further with Anchore Enterprise, it is highly recommended to read the Overview sections to gain a deeper understanding of fundamentals, concepts, and proper usage.
The anchore-db service is built from the provided Dockerfile.anchore-db, which produces the PostgreSQL 17 image with the pg_cron extension that Anchore Enterprise requires.
System Requirements
The following instructions assume you are using a system running Docker Engine v20.10 or later, with access to APT (Advanced Package Tool, the Debian/Ubuntu package manager) repositories for installing packages, and a version of Docker Compose that supports at least v2 of the Compose configuration format.
To keep analysis performance responsive, 4 or more vCPUs and at least 32GB of RAM is recommended.
Plan for at least 40GB of disk space, although 100GB or more is recommended. Anchore Enterprise needs room to store and analyze the container images and SBOMs you submit, so the extra headroom prevents analysis failures as your usage grows.
To access Anchore Enterprise, you need a valid license.yaml file that has been issued to you by Anchore Customer Success. If you do not have a license yet, visit the Anchore Contact page to request one.
You need root or sudo access to the system where you will be running docker and deploying Anchore Enterprise, all commands in this document are run as root.
Get Started
Follow the steps below to get up and running!
Step 1: Authenticate with the Official Anchore Registry
You’ll need authenticated access to the anchore/enterprise and anchore/enterprise-ui repositories on Docker Hub to pull the images. The Anchore Account or Customer Success team will provide a Docker Hub PAT (Personal Access Token) for access to images. Log in with your Docker PAT to push and pull images from Docker Hub:
Create a dedicated project directory to store your configuration files, system license, and database variables. Subsequent steps assume you are working from this directory.
mkdir anchore-enterprise && cd anchore-enterprise
Step 3: Download the Deployment Files
Download the Docker Compose file and the Dockerfile database into your working directory, alongside the license file you received from Anchore. You may need to rename that file to license.yaml.
Place your license.yaml file in the working directory:
cp /path/to/your/license.yaml ./license.yaml
Download the official Anchore Enterprise v6.0 Docker Compose configuration file:
Edit docker-compose.yaml to set the deployment secrets. Several of the variables ship commented out and must be uncommented and given a value, while others ship with a default. The secrets fall into two groups, configured in different services.
We strongly recommend changing any default secret values you find before starting the stack.
Database password — set this on the anchore-db service only:
Variable
Description
POSTGRES_PASSWORD
The password PostgreSQL initializes with. Set on the anchore-db service only. ANCHORE_DB_PASSWORD (below) must be set to this same value.
For example, the environment block of the anchore-db service looks like this:
The ui service connects to the database through its ANCHORE_APPDB_URI variable, which embeds the default database password (postgres://postgres:mysecretpassword@anchore-db:5432/postgres). If you change POSTGRES_PASSWORD from the default, update the password in ANCHORE_APPDB_URI on the ui service to match, or the GUI will fail to connect to the database.
Anchore Enterprise service secrets — set these on every Anchore Enterprise service, but not on the anchore-db service. Each value must be identical across all of those services:
Variable
Description
ANCHORE_ADMIN_PASSWORD
Strong password for the Anchore Enterprise admin account.
ANCHORE_AUTH_SECRET
Shared authentication secret used for internal service communication.
ANCHORE_DB_PASSWORD
Database password the Anchore Enterprise services use to connect to PostgreSQL. Must match POSTGRES_PASSWORD above.
For example, the environment block of each Anchore Enterprise service should look like this:
The Anchore Enterprise service secrets must be identical across every Anchore Enterprise service, and ANCHORE_DB_PASSWORD must match POSTGRES_PASSWORD on the anchore-db service. Mismatched secrets prevent services from starting or authenticating.
Step 5: Start the Deployment
Start your environment from the working directory. This builds the database image and starts Anchore Enterprise:
docker compose up -d
[+] up 14/14
 ✔ Network anchore-6000_default               Created                      0.4s
 ✔ Container anchore-6000-anchore-db-1        Healthy                      43.5s
 ✔ Container anchore-6000-ui-redis-1          Healthy                      43.6s
 ✔ Container anchore-6000-queue-1             Healthy                      37.3s
 ✔ Container anchore-6000-catalog-1           Healthy                      43.4s
 ✔ Container anchore-6000-reports_worker-1    Started                      43.3s
 ✔ Container anchore-6000-analyzer-1          Started                      42.8s
 ✔ Container anchore-6000-notifications-1     Started                      43.3s
 ✔ Container anchore-6000-component-catalog-1 Started                      43.3s
 ✔ Container anchore-6000-reports-1           Started                      42.8s
 ✔ Container anchore-6000-api-1               Healthy                      53.6s
 ✔ Container anchore-6000-data-syncer-1       Healthy                      48.4s
 ✔ Container anchore-6000-policy-engine-1     Started                      48.7s
 ✔ Container anchore-6000-ui-1                Started                      54.0s
Step 6: Install AnchoreCTL
anchorectl is the native CLI utility used to manage and orchestrate Anchore Enterprise.
In this step, we’ll install the lightweight Anchore Enterprise client tool, quickly test it using the version operation, and set up a few environment variables to allow it to interact with your deployment using the admin password you set during configuration.
In this guide, AnchoreCTL is installed to /usr/local/bin/ and uses environment variables throughout. For more details on using and configuring AnchoreCTL, see Using AnchoreCTL.
Download and Install the Binary
Run the curl command below to download anchorectl and install it into your /usr/local/bin directory, which should be in your $PATH:
To persist these settings for future terminal sessions, append these lines to your shell profile (~/.bashrc or ~/.zshrc).
Step 7: Verify Service Availability
After a few minutes (depending on system speed) Anchore Enterprise and Anchore UI services should be up and running, ready to use. You can verify the containers are running with docker compose, as shown in the following example.
docker compose ps
NAME                               IMAGE                                                 COMMAND                  SERVICE             CREATED         STATUS                   PORTS
anchore-6000-analyzer-1            docker.io/anchore/enterprise-dev:v6.0.0-rc16          "/docker-entrypoint.…"   analyzer            2 minutes ago   Up 2 minutes (healthy)   8228/tcp
anchore-6000-anchore-db-1          anchore-6000-anchore-db                               "docker-entrypoint.s…"   anchore-db          2 minutes ago   Up 2 minutes (healthy)   5432/tcp
anchore-6000-api-1                 docker.io/anchore/enterprise-dev:v6.0.0-rc16          "/docker-entrypoint.…"   api                 2 minutes ago   Up 2 minutes (healthy)   0.0.0.0:8228->8228/tcp, [::]:8228->8228/tcp
anchore-6000-catalog-1             docker.io/anchore/enterprise-dev:v6.0.0-rc16          "/docker-entrypoint.…"   catalog             2 minutes ago   Up 2 minutes (healthy)   8228/tcp
anchore-6000-component-catalog-1   docker.io/anchore/enterprise-dev:v6.0.0-rc16          "/docker-entrypoint.…"   component-catalog   2 minutes ago   Up 2 minutes (healthy)   8228/tcp
anchore-6000-data-syncer-1         docker.io/anchore/enterprise-dev:v6.0.0-rc16          "/docker-entrypoint.…"   data-syncer         2 minutes ago   Up 2 minutes (healthy)   0.0.0.0:8778->8228/tcp, [::]:8778->8228/tcp
anchore-6000-notifications-1       docker.io/anchore/enterprise-dev:v6.0.0-rc16          "/docker-entrypoint.…"   notifications       2 minutes ago   Up 2 minutes (healthy)   0.0.0.0:8668->8228/tcp, [::]:8668->8228/tcp
anchore-6000-policy-engine-1       docker.io/anchore/enterprise-dev:v6.0.0-rc16          "/docker-entrypoint.…"   policy-engine       2 minutes ago   Up 2 minutes (healthy)   8228/tcp
anchore-6000-queue-1               docker.io/anchore/enterprise-dev:v6.0.0-rc16          "/docker-entrypoint.…"   queue               2 minutes ago   Up 2 minutes (healthy)   8228/tcp
anchore-6000-reports-1             docker.io/anchore/enterprise-dev:v6.0.0-rc16          "/docker-entrypoint.…"   reports             2 minutes ago   Up 2 minutes (healthy)   0.0.0.0:8558->8228/tcp, [::]:8558->8228/tcp
anchore-6000-reports_worker-1      docker.io/anchore/enterprise-dev:v6.0.0-rc16          "/docker-entrypoint.…"   reports_worker      2 minutes ago   Up 2 minutes (healthy)   8228/tcp
anchore-6000-ui-1                  docker.io/anchore/anchore-on-prem-ui-dev:v6.0.0-rc4   "/docker-entrypoint.…"   ui                  2 minutes ago   Up 2 minutes (healthy)   0.0.0.0:3000->3000/tcp, [::]:3000->3000/tcp
anchore-6000-ui-redis-1            docker.io/library/redis:7.4.6                         "docker-entrypoint.s…"   ui-redis            2 minutes ago   Up 2 minutes (healthy)   6379/tcp
You can then run a command to get the status of the Anchore Enterprise services:
anchorectl system status
 ✔ Status system
┌───────────────────┬────────────────────┬───────────────────────────────┬──────┬────────────────┬────────────┬──────────────┐
│ SERVICE           │ HOST ID            │ URL                           │ UP   │ STATUS MESSAGE │ DB VERSION │ CODE VERSION │
├───────────────────┼────────────────────┼───────────────────────────────┼──────┼────────────────┼────────────┼──────────────┤
│ simplequeue       │ anchore-quickstart │ http://queue:8228             │ true │ available      │ 6000       │ 6.0.0       │
│ data_syncer       │ anchore-quickstart │ http://data-syncer:8228       │ true │ available      │ 6000       │ 6.0.0       │
│ reports_worker    │ anchore-quickstart │ http://reports_worker:8228    │ true │ available      │ 6000       │ 6.0.0       │
│ notifications     │ anchore-quickstart │ http://notifications:8228     │ true │ available      │ 6000       │ 6.0.0       │
│ reports           │ anchore-quickstart │ http://reports:8228           │ true │ available      │ 6000       │ 6.0.0       │
│ analyzer          │ anchore-quickstart │ http://analyzer:8228          │ true │ available      │ 6000       │ 6.0.0       │
│ component_catalog │ anchore-quickstart │ http://component-catalog:8228 │ true │ available      │ 6000       │ 6.0.0       │
│ catalog           │ anchore-quickstart │ http://catalog:8228           │ true │ available      │ 6000       │ 6.0.0       │
│ apiext            │ anchore-quickstart │ http://api:8228               │ true │ available      │ 6000       │ 6.0.0       │
│ policy_engine     │ anchore-quickstart │ http://policy-engine:8228     │ true │ available      │ 6000       │ 6.0.0       │
└───────────────────┴────────────────────┴───────────────────────────────┴──────┴────────────────┴────────────┴──────────────┘
The first time you run Anchore Enterprise, vulnerability data will sync to the system in a few minutes. For the best experience, wait until the core vulnerability data feeds have completed before proceeding.
You can check the status of your feed sync using AnchoreCTL:
As soon as you see RecordCount values set for all vulnerability groups, the system is fully populated and ready to present vulnerability results. Note that data syncs are incremental, so the next time you start up Anchore Enterprise it will be ready immediately. The AnchoreCTL includes a useful utility that will block until the feeds have completed a successful sync:
anchorectl system wait
 ✔ API available                                                                                        system
 ✔ Services available                        [10 up]                                                    system
 ✔ Vulnerabilities feed ready                                                                           system
Step 8: Verify Functionality and Start Using Anchore Enterprise
Add an image to confirm that analysis works end to end. The --wait flag blocks until analysis completes:
If the command prints the success message, point your browser at the Anchore Enterprise GUI at http://localhost:3000/ and log in with the username admin and the ANCHORE_ADMIN_PASSWORD you set in Step 4. If it instead reports a connection error, wait a few moments for the ui service to finish starting and try again.
To put your deployment to work, follow the end-to-end workflows in the documentation:
Uncomment the following section at the bottom of the docker-compose.yaml file:
# # Uncomment this section to add a prometheus instance to gather metrics. This is mostly for quickstart to demonstrate prometheus metrics exported# prometheus:# image: docker.io/prom/prometheus:latest# depends_on:# - api# volumes:# - ./anchore-prometheus.yml:/etc/prometheus/prometheus.yml:z# logging:# driver: "json-file"# options:# max-size: 100m# ports:# - "9090:9090"#
For each service entry in the docker-compose.yaml file, enable metrics in the API by changing:
ANCHORE_ENABLE_METRICS=false
to
ANCHORE_ENABLE_METRICS=true
Download the example Prometheus configuration into the same directory as the docker-compose.yaml file, with the name anchore-prometheus.yml:
curl https://docs.anchore.com/current/docs/deployment/anchore-prometheus.yml > anchore-prometheus.yml
docker compose up -d
Result: You should see a new container started, and can access Prometheus via your browser at http://localhost:9090.
Enable Swagger UI
Uncomment the swagger-ui-nginx and swagger-ui services at the bottom of the docker-compose.yaml file (the section is labelled with a “Uncomment this section to run a swagger UI service” comment).
Download the nginx configuration into the same directory as the docker-compose.yaml file, with the name anchore-swaggerui-nginx.conf:
curl https://docs.anchore.com/current/docs/deployment/anchore-swaggerui-nginx.conf > anchore-swaggerui-nginx.conf
docker compose up -d
Result: You should see a new container started, and can access Swagger UI via your browser at http://localhost:8080.
2.2.1 - Deploy Air-Gapped using Docker Compose
Anchore Enterprise can run in an air-gapped environment with no outbound internet access. The only air-gapped-specific work is getting the container images onto the air-gapped network: you pull and build them on an internet-connected system, then move them across. Once the images are in place, deployment follows the standard Docker Compose procedure.
Throughout this guide, the low side is the internet-facing system and the high side is the air-gapped system.
Prerequisites
Low side (internet-facing) — the Docker static binary, used only to pull, build, and save images.
High side (air-gapped) — Docker Engine/CE and a Docker Compose that supports at least v2 of the Compose configuration format, used to run Anchore Enterprise.
Detailed sizing and other requirements are in System Requirements on the Docker Compose page.
The anchore-db image is built from the provided Dockerfile.anchore-db, which produces the PostgreSQL 17 image with the pg_cron extension that Anchore Enterprise requires. The build installs pg_cron using APT (Advanced Package Tool, the Debian/Ubuntu package manager), so the low side needs access to APT repositories. If APT resources are not reachable on your network, work with Anchore Customer Success for alternatives.
Prepare the Images (low side)
Run these commands on the low side. You will need the Anchore-provided Docker Hub credentials and PAT (Personal Access Token), and roughly 2–4 GB of free disk space for the pulled images.
Download the current Docker Compose file and the database Dockerfile:
Build the database image from Dockerfile.anchore-db. This Dockerfile produces the PostgreSQL 17 image with the pg_cron extension that Anchore Enterprise requires.
Choose one of the following. A private container registry is the recommended path; use a local image tarball only if no registry is available on the air-gapped network.
Re-tag the images for your private registry, replacing <registry> with your registry domain (for example, core.harbor.domain):
docker tag docker.io/anchore/enterprise:v6.0.0 \
  <registry>/anchore/enterprise:v6.0.0
docker tag docker.io/anchore/enterprise-ui:v6.0.0 \
  <registry>/anchore/enterprise-ui:v6.0.0
docker tag docker.io/redis:7.4.6 <registry>/redis:7.4.6
docker tag anchore:db <registry>/anchore:db
If the registry is only reachable from the high side, save the tagged images and transfer them across (along with docker-compose.yaml, Dockerfile.anchore-db, and your license.yaml), then load them on the high side:
# Low sidedocker save -o anchore-airgap-images.tar \
<registry>/anchore/enterprise:v6.0.0 \
<registry>/anchore/enterprise-ui:v6.0.0 \
<registry>/redis:7.4.6 \
<registry>/anchore:db
# High sidedocker load -i anchore-airgap-images.tar
Push the images to your private registry from a system that can reach it:
Besides the images, the air-gapped host needs your docker-compose.yaml and license.yaml in the working directory. You downloaded the Compose file on the low side in Prepare the Images; if you have not already copied it and the license across with the images, do so now. The database is deployed from the pre-built anchore:db image you moved, so there is nothing to build here. Configure the deployment as described in Step 4: Configure Secrets, with two additional air-gapped-specific changes:
Point every image: line at your air-gapped images instead of Docker Hub. Use your private-registry tags for Option 1, or the local names you loaded for Option 2. The enterprise image is referenced by many services (api, catalog, analyzer, policy-engine, and others), so update every instance. The anchore-db service builds its image from the Dockerfile by default, so replace its build: section with a reference to the anchore:db image you built and moved earlier.
For example, the api service ships referencing Docker Hub, and anchore-db builds its image locally:
Remove the build: section (the context and dockerfile lines) from the anchore-db service when you add its image: line. The database image was already built and moved, so there is no need to build it again on the air-gapped host.
Configure the deployment for air-gapped feed handling. Because the deployment cannot reach the Anchore Data Service, you must disable the Data Syncer’s automatic feed sync and then download and import feed bundles manually with AnchoreCTL. Both steps are described in Air-Gapped Feed Configuration.
Until you complete the air-gapped feed configuration, you will not be able to upload feed bundles into the system, and the deployment will have no vulnerability data.
The supported method for deploying Anchore Enterprise on Kubernetes is with Helm. The Anchore Enterprise Helm Chart includes configuration options for a full Enterprise deployment.
Anchore Enterprise 6.0 does not support a helm deployment, this will be released with 6.1. This page and subsequent pages will be updated with the 6.1 release.
2.3.1 - Deploying Anchore Enterprise on Azure Kubernetes Service (AKS)
Instructions for deploying Anchore Enterprise on Azure Kubernetes Service (AKS) with Helm are coming in Anchore Enterprise 6.1.
2.3.2 - Deploying Anchore Enterprise on Amazon EKS
Instructions for deploying Anchore Enterprise on Amazon Elastic Kubernetes Service (EKS) with Helm are coming in Anchore Enterprise 6.1.
2.3.3 - Deploying Anchore Enterprise on Google Kubernetes Engine (GKE)
Instructions for deploying Anchore Enterprise on Google Kubernetes Engine (GKE) with Helm are coming in Anchore Enterprise 6.1.
2.3.4 - Deploying Anchore Enterprise on OpenShift
Instructions for deploying Anchore Enterprise on OpenShift with Helm are coming in Anchore Enterprise 6.1.
2.4 - Anchore Enterprise Cloud Image
Overview
The Anchore Enterprise Cloud Image (AECI) is a fully functional machine image with an Anchore Enterprise deployment that
is pre-configured with the goal of simplifying deployment complexity for our end users.
Anchore Enterprise Cloud Image is currently available for users of Amazon Web Services only. AECI 6.x is expected to be released in the coming weeks
All /v2 API endpoints referenced throughout our documentation are accessed via /api/v2 when using AECI.
AECI contains a proprietary tool known as Cloud Image Manager. It allows users to manage their deployment by providing an easy way to install, configure and upgrade. For more information about the Cloud Image
Manager, see the Cloud Image Manager.
To get started with deploying Anchore Enterprise Cloud Image, please see AECI - AWS.
Supported Limits
The Cloud Image has the following limits, independent of instance type:
10,000 Image SBOMs
Max Image Size is 10 GB
300 Report Executions
100 System Users
Non-supported Features
The Cloud Image does not currently support the following Anchore Enterprise features:
Air-gapped Deployment
Runtime Inventory
Application Groups and Source Code Analysis
Windows Image Analysis
Legacy Image Archive
To discuss further, contact Anchore Customer Success.
The baseline supported instance type on Amazon Web Services is the r7a.xlarge. This gives the best mix of
performance to cost for running Anchore Enterprise in alignment with the supported system limits.
Cloud Image Manager will not enforce the use of this instance type but will check for the minimum resources needed to run the software. If you would like to use a different instance type, please contact Anchore Customer Success for further guidance.
For more information on Amazon EC2 Instance types Please review the following links
Memory Requirement - Anchore Enterprise Cloud Image (AECI) requires a minimum of 32 GB of memory to operate.
Disk Requirement - AECI requires a minimum of 128 GB of disk space for root volume and 1 TB for data volume to operate.
Note: The data volume by default will not delete on termination of your AMI.
CPU Requirement - AECI requires a minimum of 4 vCPU to operate.
License
The Anchore Enterprise Cloud Image requires a valid license entitlement to operate. The license is provided by Anchore during the purchase process. The license file is required to be uploaded via the Cloud Image Manager during the initial setup. Please have it available before starting the installation process.
EC2 Key Pair Type
Anchore Enterprise Cloud Image is running with FIPS enabled. When creating your Key Pair, you must use an RSA key. The ED25519 key will be rejected as a non-FIPS-compliant algorithm.
A quick Demo on getting started with Anchore Enterprise Cloud Image
Once the instance is launched, please review the Cloud Image Manager documentation for the next steps on
Accessing the Cloud Image Manager. The Cloud Image Manager will walk you through the preflight checks, configuration,
and management of your Anchore Enterprise Cloud Image deployment.
Operations
With AECI up and running, there is some limited feeding and watering required. You’ll want to consider the following activities:
Backups
It is important that you have a backup and restore strategy in place to protect your data. Cloud Image Manager will prompt you to create a snapshot prior to upgrading your Anchore Enterprise Cloud Image or
expanding your disks. It is also reasonable for you to consider using AWS Backup and/or creating snapshots of your EBS volume on a regular basis:
During the course of using the product, you may wish to expand the size of your disks. It is strongly recommended
that you create a snapshot of your EBS volume prior to expanding your disks.
Once you have expanded your disk, you will need to resize the filesystem to take advantage of the additional space.
Cloud Image Manager provides a utility to resize the filesystem. Please refer to the Cloud Image Manager
Configuration Disk Expansion for more information.
Upgrade
Occasionally, Anchore will release updates to the Anchore Enterprise Cloud Image and the subsequent version of Anchore Enterprise shipped with it. The Cloud Image Manager will provide
you with upgrades that are available and allow you to determine when you want to upgrade. It is strongly
recommended that you create a snapshot of your EBS volume prior to upgrading your Anchore Enterprise Cloud Image.
During operation of Anchore Enterprise Cloud Image, you may require support from Anchore Customer Success. The
Cloud Image Manager provides you with a seamless way to generate a support bundle and upload it to Anchore.
The Cloud Image Manager is a proprietary tool that allows users to seamlessly manage their Anchore Enterprise
Cloud Image deployments. It walks users through the process of installing, configuring, and upgrading their
Anchore Enterprise Cloud Image deployment.
Best Practices
The Cloud Image Manager uses Textual (a TUI framework for Python) to provide
a terminal-based interface. For your best user experience, please use the following terminal emulators
when connecting to the Cloud Image Manager.
Note: We recommend against using the default macOS Terminal application as it may not render the TUI correctly. For more
information on why, please see Textual FAQ.
Access the Cloud Image Manager
After your instance is launched, you can access the Cloud Image Manager by connecting to the instance via SSH.
Using your private key file used for authentication (likely generated when setting up the instance) and the
public IP address of the instance, connect using the following example command:
Permissions on key file - If you get a WARNING: UNPROTECTED PRIVATE KEY FILE error, fix it by setting the
correct permissions on your key file. Run the following command to set the correct permissions:
chmod 400 ~/my-keypair.pem
Connection Issues - If you experience a Connection Timeout or Host Unreachable error, verify that the instance
is running and that the security group allows SSH traffic on port 22.
You should now be connected to the Cloud Image Manager.
Preflight Checks
The Cloud Image Manager will perform a series of preflight checks to ensure that the system is ready for installation.
These checks include ensuring that the machine image has met memory, disk space, and CPU requirements. If the system
does not meet the requirements, the preflight checks will fail and the installation will not proceed.
Initial Install
The Cloud Image Manager will walk you through the initial installation process. At the end of this process, the
Cloud Image Manager will provide you with the URL to access the Anchore Enterprise UI as well as your administrator
credentials.
Upgrade
The Cloud Image Manager will determine if there are any upgrades available for your Anchore Enterprise Cloud Image
deployment. If an upgrade is available, the Cloud Image Manager will walk you through the upgrade process. If
downtime is required, the Cloud Image Manager will notify you prior to proceeding. This will allow you to plan
for the upgrade when it is convenient for you. It is highly recommended that you take a snapshot of your EBS
volume prior to upgrade.
Configuration
The Cloud Image Manager configuration screen allows the following options:
Adding and updating the Anchore Enterprise License.
Providing any Server Certificates required for TLS access to Anchore Enterprise services.
Providing a custom Root Certificate if one is required for your environment.
Configuring any optional proxy settings required for your environment.
Disk Expansion
Reconfigure Proxy Settings
Changing Proxy settings after completing the installation process currently requires manual intervention for the settings to be fully applied.
If you must change the Proxy settings, please contact customer support for assistance.
Expand Disks
The Cloud Image Manager provides a utility to expand the root and data volumes once your virtual hard disk has been
increased in size. This step is necessary to take advantage of the additional space. The Cloud Image Manager will
shut down Anchore Enterprise during this operation. It is highly recommended that you take a snapshot of your EBS
volume prior to any operation that may modify your disk volumes.
System Status
The Cloud Image Manager provides a system status screen that shows the current service and container status
of the Anchore Enterprise services.
It also provides the list of currently deployed versions of Anchore Enterprise, Anchore Enterprise UI as well as
the other infrastructure components that are automatically deployed within the Anchore Enterprise Cloud Image.
Support
The Cloud Image Manager provides a support screen that allows you to:
Generate a support bundle. This will result with the location of the support bundle.
Upload a generated support bundle. This will be automatically uploaded to Anchore. You must create a support
ticket and provide the Support Bundle ID and Filename to the support team.
As part of the Cloud Image deployment, you have access to Grafana data that is collected for your deployment.
This data can be used to monitor the health of your deployment. The Cloud Image Manager provides a link and
credentials to access the Grafana dashboard.
2.5 - Deploying AnchoreCTL
In this section you will learn how to deploy and configure AnchoreCTL, the Anchore Enterprise Command Line Interface.
AnchoreCTL is published as a simple binary available for download either from your Anchore Enterprise deployment or Anchore’s release site.
Using AnchoreCTL, you can manage and inspect all aspects of your Anchore Enterprise deployments, either as a manual
human-readable configuration/instrumentation/control tool or as a CLI that is designed to be used in scripted environments
such as CI/CD and other automation environments.
Installation
AnchoreCTL’s major and minor release version coincides with the release version of Anchore Enterprise, however patch versions may differ. For example,
Enterprise v6.0.0
AnchoreCTL v6.0.0
AnchoreCTL should be version-aligned with Anchore Enterprise for major/minor releases. Please refer to the Enterprise Release Notes for the supported version of AnchoreCTL.
MacOS / Linux
Download a local (from your Anchore Enterprise deployment) or remote (from Anchore servers) version without installation:
Linux Intel/AMD64
[Local]
curl -X GET "https://my-anchore.example.com/v2/system/anchorectl?operating_system=linux&architecture=amd64"\
-H "accept: */*" | tar -zx anchorectl
Anchore Enterprise is a software supply chain security platform that uses SBOMs (Software Bills of Materials) to provide continuous visibility, vulnerability detection, policy enforcement, and compliance management for container images, filesystems (including source code repositories, build artifact directories, and mounted VMs), and externally supplied SBOMs. It is designed for organizations that need to secure software at scale across development, CI/CD, and production environments.
Watch: an introduction to Anchore Enterprise v6 and what’s changed since v5.
How Anchore Enterprise Secures the Software Supply Chain
Anchore Enterprise takes a data-driven approach to software supply chain security. At the core of every operation is a high-fidelity SBOM that captures detailed metadata about software components, dependencies, licenses, file permissions, and more. This SBOM becomes the foundation for all downstream security analysis — see SBOMs for what an SBOM is in the context of Anchore Enterprise and the full set of uses a stored SBOM supports.
Organize SBOMs into Apps and Versions
Anchore Enterprise organizes SBOM data around a three-level hierarchy:
App — a piece of software you ship or host (a service, a product line, a microservice).
Version — a point-in-time release of an app.
Asset — a concrete artifact analyzed and attached to a version: a container image, a filesystem, or an externally supplied SBOM document.
A version aggregates packages, vulnerabilities, and policy results across every asset it contains, so a release made up of multiple components produces one unified vulnerability and compliance surface. See Apps, Versions and Assets for how to model your software and Managing Assets in an App Version for the asset-attachment workflow.
Container images can also be analyzed in a standalone image catalog without being attached to an app, which fits ad-hoc CI gating and image-level workflows. See Scan a Container Image for the image-scope path.
Generate and Store SBOMs
Anchore Enterprise automatically generates SBOMs when analyzing container images or filesystem artifacts. Filesystem analysis covers source code repositories, build artifact directories, mounted VMs, and any other directory tree the AnchoreCTL filesystem analyzer can read. SBOMs can be generated server-side (centralized analysis) or locally on a CI runner using AnchoreCTL (distributed analysis). Anchore Enterprise stores all SBOMs in a centralized repository, enabling continuous monitoring for new vulnerabilities even after deployment. SBOMs can be exported in industry-standard formats including SPDX and CycloneDX.
Identify Vulnerabilities and Security Risks
Using the SBOM, Anchore Enterprise matches software components against multiple vulnerability data sources including the National Vulnerability Database (NVD), GitHub Security Advisories (GHSA), and vendor-specific feeds for distributions like RHEL, Debian, Ubuntu, Alpine, and more. A precision matching algorithm selects the most accurate data source for each component, reducing false positives and false negatives. Anchore Enterprise also enriches vulnerability data with EPSS (Exploit Prediction Scoring System) scores and CISA KEV (Known Exploited Vulnerabilities) status. The computed Anchore Score, our composite multi-factor risk index, helps to organize vulnerabilities by impact to prioritize remediation.
Beyond vulnerabilities, Anchore Enterprise detects malware using ClamAV signatures, identifies embedded secrets and credentials, and flags misconfigurations.
Enforce Compliance with Policy-as-Code
Anchore Enterprise includes a policy engine that evaluates SBOMs and their associated scan results against customizable rules. Policies use a gate-and-trigger model where gates define categories of checks (vulnerabilities, licenses, file permissions, secrets, metadata) and triggers define specific conditions within each gate. Policy evaluations return pass, warn, or fail results that can be used to gate CI/CD pipelines, block non-compliant deployments via Kubernetes admission control, or generate compliance reports.
Anchore Enterprise ships with pre-built policy packs mapped to industry standards including NIST 800-53, FedRAMP, CIS Benchmarks, and DoD requirements.
Monitor Runtime Environments
Anchore Enterprise integrates with Kubernetes and Amazon ECS to maintain a real-time inventory of container images running in production. The Kubernetes Inventory Agent and ECS Inventory Agent report running workloads back to Anchore Enterprise, enabling continuous policy evaluation and vulnerability monitoring of live deployments. Combined with the Kubernetes Admission Controller, organizations can prevent non-compliant images from being deployed.
Key Components
Component
Description
Anchore Enterprise API
RESTful API (v2) providing all platform capabilities for automation and integration
Anchore Enterprise GUI
Web-based interface for managing apps, versions, and assets — plus policies, reports, and system configuration
AnchoreCTL
Go-based CLI tool for interacting with Anchore Enterprise, with built-in SBOM generation via Syft
Anchore Data Service
Hosted service providing vulnerability databases, malware signatures, EPSS data, and STIG profiles
Learn More
SBOMs for the foundational concept Anchore Enterprise is built around
Anchore Enterprise provides a comprehensive set of capabilities for securing the software supply chain, from SBOM generation and management through vulnerability remediation and compliance enforcement. It builds and integrates Anchore’s proven open source tooling — Syft, Grype, and more.
Watch: a tour of the Anchore Enterprise GUI summary view.
SBOM Generation
Anchore Enterprise generates SBOMs using an embedded version of Syft, Anchore’s open-source SBOM generation tool. Both AnchoreCTL (the command-line client) and the server-side Analyzer embed Syft, so SBOMs produced locally on a CI runner, on a developer workstation, or centrally by the Anchore Enterprise deployment are consistent in structure and fidelity.
Two analysis modes are supported:
Distributed analysis — AnchoreCTL generates the SBOM locally on a CI runner or workstation and uploads the result to Anchore Enterprise. Image content never leaves the build environment.
Centralized analysis — The Analyzer service pulls images from registries, unpacks them, and generates SBOMs server-side. Required for malware scanning.
Anchore Enterprise generates SBOMs that include a rich superset of data beyond what standard SBOM formats capture. This additional metadata enables detection of secrets, file permissions issues, misconfigurations, and malware — in addition to standard package identification.
Anchore Enterprise SBOMs identify:
Open source and proprietary packages with ecosystem metadata (OS, language, binary)
Nested dependencies in archive files (JAR, WAR, EAR, and more)
Package details including name, version, creator, and license information
Filesystem metadata including file name, size, permissions, creation time, modification time, and hashes
Malware and cryptominers (via ClamAV signatures)
Embedded secrets, keys, and credentials
Supported Ecosystems
Anchore Enterprise supports the following packaging ecosystems for SBOM content identification:
Operating System Packages:
RPM, DEB, APK, Linux kernel archives (vmlinuz), Linux kernel modules (ko)
Language Packages:
C/C++ (conan), Dart (pubs), Dotnet (deps.json), Elixir (mix), Erlang (rebar3), Go (go.mod, Go binaries), Haskell (cabal, stack), Java (jar, ear, war, par, sar, nar, native-image), JavaScript (npm, yarn), Jenkins Plugins (jpi, hpi), Nix (outputs in /nix/store), Objective-C (cocoapods), PHP (composer), Python (wheel, egg, poetry, requirements.txt), Ruby (gem), Rust (cargo.lock), Swift (cocoapods, swift-package-manager)
Anchore Enterprise organizes SBOM data around a three-level hierarchy that mirrors how software is actually shipped: apps group versions, and each version holds the assets that make up that release.
App — a piece of software you ship or host: a service, a product line, a microservice.
Version — a point-in-time release of an app, with a release lifecycle (in_progress, released, eol) and optional chaining to its predecessor.
Asset — a concrete artifact analyzed and attached to a version. Three types are supported today: container images, filesystems (including source code repositories analyzed as a filesystem), and externally supplied SBOM documents (CycloneDX, SPDX, or Syft-native JSON).
A single app version can hold a mix of asset types, and Anchore Enterprise aggregates the results across all of them — packages, vulnerabilities, and policy findings appear at the version level as a single deduplicated surface, regardless of which asset surfaced them. A release made up of multiple components produces one unified vulnerability and compliance picture; a VEX annotation against a (vulnerability, package) pair on the version covers every asset that contains the affected package.
Generated SBOMs — whether produced by Anchore Enterprise or imported from external tooling — are stored in a centralized repository. Anchore Enterprise continuously re-evaluates stored SBOMs as new vulnerability data or policy rules arrive, so existing artifacts do not need to be re-scanned to pick up newly disclosed issues. This storage-first model turns SBOMs from a point-in-time artifact into an ongoing source of insight.
Insights delivered from stored SBOMs include:
Vulnerability matching — SBOMs are matched against vulnerability feeds from the Anchore Data Service on every sync cycle, with EPSS and CISA KEV enrichment applied.
Policy evaluation — Policies are re-evaluated automatically when the SBOM, the policy, or the underlying data feeds change.
Drift detection — Changes between successive SBOMs for the same artifact are surfaced (see below).
Anchore Enterprise detects changes in SBOMs between builds — components added, removed, or changed. Policy rules can alert or block deployments when unexpected changes occur, helping identify developer errors, unauthorized modifications, or supply chain attacks. See SBOM Drift for more information.
SBOM Export and Compliance
Individual image SBOMs can be exported via the GUI or API in SPDX, CycloneDX, and Anchore’s native Syft JSON formats. For an entire application version, Anchore Enterprise can export a single aggregated SBOM in CycloneDX (1.6) or SPDX (2.3) format, to meet customer and federal compliance requirements including the US Cyber Executive Order, the EU CRA, and NTIA/CISA minimum element guidelines. See SBOM Export for the supported formats and workflows.
Vulnerability and Security Scanning
Anchore Enterprise scans for vulnerabilities and security risks at every stage of the software development process: build environments (including source code repositories analyzed as a filesystem), CI/CD pipelines, container registries, and runtime environments.
Precision Vulnerability Matching
Anchore Enterprise applies a precision matching algorithm that selects the most accurate vulnerability data source for each component. When the SBOM identifies a specific Linux distribution (such as RHEL or Ubuntu), Anchore Enterprise automatically uses that vendor’s security advisory feed rather than generic NVD data. This approach significantly reduces both false positives and false negatives.
Multiple Vulnerability Data Sources
Vulnerability data is sourced from 20+ providers, including the National Vulnerability Database (NVD), GitHub Security Advisories (GHSA), and vendor-specific feeds for all major Linux distributions. Anchore also maintains a curated dataset of known false-positive matches for automatic suppression. See Anchore Data Service for the complete list of sources.
EPSS and KEV Enrichment
Vulnerability findings are enriched with EPSS (Exploit Prediction Scoring System) scores that provide a probability estimate of exploitation, and CISA KEV (Known Exploited Vulnerabilities) flags that identify vulnerabilities with confirmed active exploitation in the wild. These data points help security teams prioritize remediation based on real-world risk.
Zero-Day Vulnerability Response
When a zero-day vulnerability is disclosed, Anchore Enterprise can instantly identify impacted components by querying stored SBOMs. There is no need to re-scan images or repositories — the existing SBOM data is matched against the updated vulnerability records.
Malware Detection
Anchore Enterprise scans container image layers for malware, cryptominers, and other malicious content using ClamAV signatures that are kept current through the Anchore Data Service.
Vulnerability Management and Remediation
Anchore Enterprise provides tools beyond detection to help teams manage and remediate security findings efficiently.
Manage False Positives
Anchore Enterprise reduces false positives through precision matching, Anchore-curated match exclusions, and user-defined corrections. Corrections allow teams to override CPE-based matching for specific packages, improving accuracy over time. Allowlists and time-limited allowlists provide exceptions for known acceptable risks.
VEX Annotations
Anchore Enterprise supports VEX (Vulnerability Exploitability eXchange) annotations that allow teams to document the exploitability status of specific vulnerabilities. Annotations can be set to Not Affected, Affected, Fixed, or Under Investigation, and can include action statements describing planned remediation. VEX documents can be exported in CycloneDX and OpenVEX formats.
Reporting and Notifications
Anchore Enterprise includes a reporting service with scheduled report generation, filterable by vulnerability severity, annotation status, and account scope. Reports can be exported as CSV or JSON. Notifications can be routed through webhooks, Slack, Microsoft Teams, Jira, GitHub, and email to alert teams when vulnerability states change, policy evaluations update, or analysis completes.
Policy Enforcement and Compliance
Anchore Enterprise includes a policy engine that enables automated compliance checking against customizable rules, industry standards, and regulatory requirements.
Gate-and-Trigger Policy Model
Policies use a gate-and-trigger model. Gates define categories of checks (vulnerabilities, licenses, secrets, file permissions, metadata), and triggers define specific conditions within each gate. Each trigger evaluation produces a stop, warn, or go action. Multiple rule sets can be combined into a single policy and mapped to specific registries, repositories, or tags.
DoD Iron Bank — Validates images against U.S. Air Force security standards at Platform One and Iron Bank.
CIS — Validates against container image best practices and a subset of NIST 800-53 and NIST 800-190 controls. Customizable for alignment with CIS Benchmarks.
NIST — Validates content against NIST 800-53 and NIST 800-190 controls.
DISA STIG Compliance
Anchore Enterprise can scan container images against DISA Security Technical Implementation Guides (STIGs). Scan results are output in OASIS Heimdall Data Format (OHDF) and can be converted to XCCDF and CKL formats for import into STIG Viewer using MITRE SAF CLI tools.
CI/CD Pipeline Integration
Policies can be enforced directly in CI/CD pipelines using AnchoreCTL. The anchorectl image check command evaluates images against the active policy and returns a pass/fail result that can gate pipeline progression. Distributed analysis mode allows SBOM generation to happen locally on CI runners for faster feedback.
Kubernetes Admission Control
The Kubernetes Admission Controller evaluates container images against Anchore Enterprise policies before allowing deployment. Images that fail policy evaluation can be blocked, providing a runtime enforcement point for production environments.
Runtime Monitoring
Anchore Enterprise integrates with container orchestration platforms to provide continuous visibility into running workloads.
Kubernetes Runtime Inventory
The Kubernetes Inventory Agent (anchore-k8s-inventory) runs inside your cluster and continuously reports running container images back to Anchore Enterprise. This enables real-time vulnerability monitoring and policy compliance checking of production workloads.
ECS Runtime Inventory
The ECS Inventory Agent (anchore-ecs-inventory) provides the same runtime inventory capability for Amazon ECS environments.
Open Source Dependency and License Management
Anchore Enterprise identifies open source dependencies incorporated at any stage of the software lifecycle, including both direct and transitive dependencies. License information is extracted for all identified packages, and license policies can be configured to enforce compliance with organizational open source requirements.
Anchore Enterprise is a distributed application deployed as a set of container images that communicate through RESTful APIs and a shared PostgreSQL database. The platform can be deployed on Kubernetes (via Helm), Docker Compose, or as a pre-configured cloud image. Each service runs independently and can be scaled horizontally to meet throughput requirements.
Services
API Service
The API service is the primary external-facing gateway for Anchore Enterprise. All client interactions — from AnchoreCTL, the GUI, and third-party integrations — route through this service. It exposes a RESTful API (v2) that provides access to image management, policy evaluation, vulnerability queries, user and account administration, SBOM operations, reporting, and system configuration.
Catalog
The catalog is the central state manager for the image catalog. It coordinates the lifecycle of analyzed container images, tracks analysis state, manages subscriptions and event notifications, and provides data access to other services from the backend PostgreSQL database. The catalog also handles artifact lifecycle policies (automatic archiving and deletion), garbage collection, and Kubernetes runtime inventory tracking.
Component Catalog
The component catalog manages the v6 application graph — apps, versions, and the assets (container images, filesystems, and externally supplied SBOMs) attached to each version. It owns the app, version, and asset APIs, aggregates packages, vulnerabilities, and policy results up to the version level, and runs the asynchronous jobs that attach assets and produce version-scoped exports (SBOM, VEX, VDR, and vulnerability reports).
Analyzer
The analyzer generates SBOMs from container images and filesystem artifacts (including source code repositories, build directories, and mounted VM disks). It unpacks image layers, catalogs all software packages and dependencies, detects malware using ClamAV signatures, searches for embedded secrets, and extracts filesystem metadata. Each analyzer instance processes one artifact at a time; scaling analyzer replicas increases parallel analysis throughput.
In distributed analysis mode, SBOM generation happens locally on the AnchoreCTL client and the resulting SBOM is uploaded to Anchore Enterprise for evaluation — bypassing the need for the analyzer to pull images directly.
Policy Engine
The policy engine loads SBOMs and evaluates them against the configured policy rules. It uses a gate-and-trigger model where each gate (vulnerabilities, licenses, secrets, file permissions, metadata) contains triggers with configurable parameters. The policy engine also handles vulnerability matching, applying the precision matching algorithm against the appropriate data feeds, and incorporates EPSS scores and KEV status into results. Policy evaluation results are stored and returned as pass, warn, or fail outcomes.
Data Syncer
The data syncer periodically downloads and normalizes datasets from the hosted Anchore Data Service. These datasets include vulnerability databases from 20+ sources, CISA KEV annotations, EPSS exploit prediction scores, ClamAV malware signatures, and STIG compliance profiles. By default, the data syncer checks for updates hourly. In air-gapped deployments, data synchronization is performed manually using AnchoreCTL.
Reports and Reports Worker
The reports service provides a GraphQL-based API for querying vulnerability, policy, and inventory data across the deployment. Users can create, schedule, and export reports in CSV or JSON format. The reports worker handles asynchronous report generation and scheduled report execution in the background.
Notifications
The notifications service manages event-driven alerts. When analysis completes, policy evaluations change, or vulnerability states are updated, the notification service delivers alerts through configurable endpoints including webhooks, Slack, Jira, and email. Notifications can be filtered using selectors to route specific event types to specific destinations.
SimpleQueue
The SimpleQueue is a PostgreSQL-backed internal task queue used by other services for asynchronous task distribution, worker coordination, and background job processing.
Clients
AnchoreCTL
AnchoreCTL is the Go-based command-line tool for Anchore Enterprise. It provides 100+ commands covering image analysis, policy evaluation, vulnerability scanning, SBOM management, feed synchronization, user administration, and system operations. AnchoreCTL includes an embedded Syft library for local SBOM generation, enabling distributed analysis without requiring the server to pull images. It supports multiple output formats including text tables, JSON, YAML, CSV, and HTML.
Anchore Enterprise GUI
The GUI provides a browser-based interface for managing images, creating and editing policies, viewing vulnerabilities, generating reports, configuring notifications, managing user accounts and registries, and monitoring system health. It also offers WYSIWYG configuration for custom login messages, banners, and links.
Integrations
Kubernetes Admission Controller
The Kubernetes Admission Controller intercepts image deployments and evaluates them against Anchore Enterprise policies before allowing them into the cluster. Images that fail policy evaluation can be blocked, providing a runtime enforcement point.
Kubernetes and ECS Runtime Inventory
The Kubernetes Inventory Agent (anchore-k8s-inventory) and ECS Inventory Agent (anchore-ecs-inventory) run inside runtime environments and continuously report the container images in use back to Anchore Enterprise. This enables ongoing vulnerability monitoring and policy compliance checking of live workloads.
Multi-Tenancy
Accounts
Accounts provide data isolation boundaries within Anchore Enterprise. Each account has its own images, SBOMs, policies, notifications, and users. Accounts can be mapped to teams, projects, or applications. Cross-account access is available for administrative users.
Users and RBAC
Users belong to accounts and are assigned roles through role-based access control (RBAC). Anchore Enterprise supports local authentication with hashed passwords (Argon2), OAuth2 token-based authentication, SAML2 SSO, and API key authentication. Usernames are unique across the deployment to enable direct API authentication.
This section covers the foundational concepts behind how Anchore Enterprise analyzes software, evaluates compliance, and manages security findings. Understanding these concepts helps you get the most out of the platform.
How Anchore Enterprise Works
Anchore Enterprise takes a data-driven approach to analysis and policy enforcement. The system processes each artifact through the following phases:
Fetch the content (a container image or a filesystem) and extract it, or import a pre-existing SBOM generated outside of Anchore Enterprise by another tool or AnchoreCTL.
Analyze the content by running catalogers to extract and classify packages, dependencies, files, licenses, secrets, and other metadata into a comprehensive SBOM.
Store the resulting SBOM and analysis data in the database for future use, audit, and continuous monitoring.
Evaluate policies against the analysis result, including vulnerability matches on the artifacts discovered in the SBOM.
Update vulnerability data and other external datasets on a recurring schedule, automatically re-evaluating stored SBOMs against new data.
Notify users of changes to policy evaluations, vulnerability matches, and other system events.
Steps 5 and 6 repeat on intervals to ensure you always have the latest external data and updated evaluations, even for images analyzed weeks or months ago.
Key Concepts
SBOMs
A Software Bill of Materials (SBOM) is the machine-readable inventory of packages, files, licenses, and relationships extracted from an analyzed artifact. SBOMs are the foundational record Anchore Enterprise stores and re-evaluates over time — the same SBOM drives vulnerability matching, policy evaluation, reporting, VEX generation, base-image comparison, and drift detection. Container images are one kind of asset from which an SBOM can be derived; filesystems (including source code repositories) and pre-built SBOMs from other tools are also supported.
Anchore Enterprise organizes SBOM data around a three-level hierarchy. An app represents a piece of software you ship or host, an app version captures a point-in-time release of that app, and each version contains one or more assets — the concrete container images, filesystems, or externally supplied SBOM documents that make up that release. Versions aggregate packages, vulnerabilities, and policy results across every asset they contain, so a release composed of multiple components produces a single unified surface for triage, search, and evidence export.
Anchore Enterprise analyzes container images by unpacking their layers and cataloging all software components into an SBOM. Analysis can happen centrally (the server pulls and unpacks the image) or in a distributed fashion (AnchoreCTL generates the SBOM locally and uploads it). The result is a stored SBOM that drives all subsequent vulnerability matching and policy evaluation.
Policies define the compliance rules that Anchore Enterprise evaluates against analyzed artifacts. A policy contains one or more rule sets, each composed of gates (categories of checks) and triggers (specific conditions). Gates cover vulnerabilities, licenses, secrets, file permissions, metadata, and more. Evaluations produce pass, warn, or fail outcomes that can drive CI/CD decisions or admission control.
The Reporting engine lets teams query stored SBOMs, policy evaluations, and vulnerability matches across the fleet to answer questions like “which images are failing policy?” or “which Kubernetes namespaces are running containers with critical vulnerabilities?” Template-based reports can be run ad hoc or scheduled for continuous delivery via notification endpoints, and results are available in tabular, JSON, and CSV formats. Reporting is distinct from raw SBOM and vulnerability export — it is the platform’s internal query layer over its own data.
Anchore Enterprise provides multiple mechanisms to manage and remediate vulnerability findings. VEX (Vulnerability Exploitability eXchange) annotations allow teams to document the exploitability status of specific vulnerabilities. Corrections can override CPE-based matching to reduce false positives. Reporting and policy-driven workflows help prioritize and track remediation efforts.
Anchore Enterprise stores every analyzed artifact and its derived data — SBOMs, vulnerability matches, and policy evaluations — so the same record can be re-evaluated, audited, and compared over time. The analysis archive moves older or less-active analyses to cheaper object storage (such as S3) while retaining the ability to restore them, and artifact lifecycle policies automatically delete analysis data based on age, tag history, or runtime-inventory status. Together they give deployments a multi-tier retention model that keeps storage growth under control without losing data the organization actively uses.
A Software Bill of Materials (SBOM) is a structured, machine-readable inventory of the components that make up a piece of software — operating-system packages, language-ecosystem libraries, files, licenses, and the relationships between them. The common analogy is a nutrition label: an explicit declaration of the “ingredients” inside a piece of software, from which consumers can answer “what’s actually in here?” without needing to crack it open themselves.
In Anchore Enterprise, the SBOM is the foundation. It is not a downstream artifact produced as a side-effect of scanning; it is the central record that every other capability depends on. SBOMs are derived from analyzed assets — most commonly container images, but also filesystems (including source code repositories analyzed as a filesystem) and externally supplied SBOMs. Each asset is attached to an app version, which aggregates packages, vulnerabilities, and policy results across every asset in the version. Once an SBOM is stored, the platform re-evaluates, exports, matches, and compares it over time.
Why SBOMs Matter
SBOMs moved from a nice-to-have to a board-level requirement over a short period of time. Three drivers converged:
Regulatory mandates — U.S. Executive Order 14028 (2021) required SBOMs for software delivered to federal agencies, and subsequent guidance from NIST (SP 800-53, SP 800-218 / SSDF), FedRAMP, and the EU Cyber Resilience Act extended the expectation into broader commercial procurement.
High-profile supply-chain incidents — SolarWinds, Codecov, and the Log4Shell vulnerability in Log4j each demonstrated that organizations could not quickly answer a basic question: “do we use this component, and where?” An SBOM inventory turns that question from a weeks-long audit into a database lookup.
Interoperability standards — the NTIA’s Minimum Elements for a Software Bill of Materials (2021) established a baseline — component name, supplier, version, unique identifier, dependency relationships, SBOM author, and timestamp — that modern SBOM formats satisfy. This baseline makes SBOMs exchangeable across organizations and tools rather than stuck in vendor-specific representations.
Anchore Enterprise is designed around these drivers: SBOMs are stored as first-class records, exchanged in open formats, and reused for as many security, compliance, and audit questions as possible.
What an SBOM Captures
Anchore Enterprise extracts a single SBOM per analyzed artifact. The SBOM records the material that downstream scanning and policy decisions need:
Packages — operating-system packages (dpkg, rpm, apk, etc.) and language-ecosystem packages (Java, Python, Node.js, Go, Ruby, .NET, and others), each with name, version, license, and package-type metadata.
Files — a file inventory with coordinates and optional content hashes, used for checks that depend on file layout as well as language-ecosystem package discovery.
Distribution metadata — the detected Linux distribution and release for container images, which determines which vulnerability feeds are consulted.
Source metadata — identifying information for the analyzed artifact: image reference, repository digests, architecture, OS, and, for container images, the raw manifest and config.
Relationships — the dependency graph connecting packages to the files and parents that declared them, used for precise vulnerability localization.
Several related content types travel alongside the SBOM rather than inside it — secret-scan results, content-search results, retrieved file contents, image manifest, parent manifest, and Dockerfile. These are stored as separate content records tied to the same image record, so they can be queried independently without bloating the SBOM itself.
How SBOMs Are Produced and Exchanged
Anchore Enterprise treats SBOMs as a two-way flow: the platform generates SBOMs for the software an organization produces, and also consumes SBOMs the organization receives from its suppliers.
SBOMs land in Anchore Enterprise from three distinct sources, all of which participate in the same downstream flows once stored:
Centralized analysis — the Anchore Enterprise deployment pulls an image from a registry, unpacks it, and generates the SBOM server-side.
Distributed analysis — AnchoreCTL pulls the image (or source tree) locally, runs Syft to generate the SBOM client-side, and uploads the result. Source content never leaves the client. Syft is Anchore’s open-source SBOM generator, and Anchore Enterprise builds on that foundation to store, evaluate, and enforce policy against SBOMs at scale. See Images for when to pick which mode.
External import (“Bring Your Own SBOM”) — an SBOM produced by another tool or vendor is uploaded directly, without requiring the underlying artifact. This is how procurement teams ingest supplier SBOMs, how M&A due-diligence and third-party audits are brought into the same analysis pipeline, and how components that were never built by Anchore Enterprise get vulnerability and license visibility.
Supported Formats
Internally, Anchore Enterprise stores SBOMs in the Syft native JSON format. At the edges of the system, the two dominant open standards are supported for both import and export:
CycloneDX (OWASP) — imported and exported in JSON and XML.
SPDX (Linux Foundation) — imported and exported in JSON and tag-value formats.
Syft — the native internal format; produced by AnchoreCTL distributed analysis and by Anchore Enterprise centralized analysis.
Both CycloneDX and SPDX satisfy the NTIA minimum-elements baseline, which is why an SBOM generated once can be re-emitted in whichever format a downstream consumer requires — auditor, customer, or another security tool. For the exact schema versions supported for upload and download, see Supported SBOM Formats.
How Anchore Enterprise Uses the SBOM
Storing the SBOM means every downstream capability can be derived from the same canonical record, without re-analyzing the artifact. The same SBOM answers a range of questions well beyond “what CVEs apply”:
Vulnerability matching — the packages in the SBOM are matched against Anchore Enterprise’s consolidated vulnerability data on a recurring schedule, so newly disclosed CVEs surface automatically on previously analyzed software. For how matching is performed, see How It Works.
License compliance — the SBOM records per-package license metadata, which policy rules use to enforce allow-lists, denylists, or obligations (for example, flagging GPL-licensed components in proprietary releases).
Policy evaluation — rule sets evaluate the SBOM’s packages, files, licenses, metadata, and Dockerfile instructions to produce a pass/warn/fail outcome. See Policy.
Reporting, audit, and procurement responses — stored SBOMs feed scheduled and ad-hoc reports and can be re-emitted as CycloneDX or SPDX for auditors, customers, regulators, or downstream tooling. This is the primary mechanism for responding to customer or procurement requests that require an SBOM alongside a delivered product.
VEX generation — vulnerability annotations applied on the SBOM’s findings are emitted as OpenVEX or CycloneDX VEX documents, combining the SBOM with its exploitability statements. See Remediation.
Base-image comparison — because both an image’s SBOM and its base image’s SBOM are stored, findings can be partitioned into “inherited from base” versus “introduced by this image”. See Compare Against a Base Image.
SBOM drift detection — successive SBOMs for the same image can be diffed to detect added, removed, or changed components, and the drift result can drive policy to catch unauthorized modifications, developer error, or supply-chain attacks. See SBOM Drift.
Component provenance and trend analysis — stored historical SBOMs let teams trace when a specific component entered the codebase, identify every release that carries a given library version, and track the evolution of the software’s composition over time.
Application grouping — individual SBOMs can be grouped into higher-level applications that reflect the way an organization actually delivers software, making batch reporting and policy management possible across related artifacts.
Because the SBOM is persistent and the data sources around it (vulnerability feeds, policy definitions, annotations) change over time, a single analysis remains useful for the full life of the software it describes.
3.3.2 - Analyzing Images
In Anchore Enterprise v6, container images are one asset type that can be attached to an app version, alongside filesystem assets and externally supplied SBOMs. Container images can also be analyzed in a standalone image catalog without being attached to an app — both paths use the same analysis machinery described below.
When an image is submitted to Anchore Enterprise, the deployment retrieves the image manifest from the configured registry and hands it off to an analyzer worker. Analyzer workers run in parallel and pull from a shared queue, so scaling throughput is a matter of adding more analyzer replicas.
During analysis, a set of catalogers inspects every package, software library, and file, producing a comprehensive SBOM. The SBOM is persisted to the database and drives all downstream vulnerability matching and policy evaluation.
Centralized and Distributed Analysis
Anchore Enterprise supports two analysis models that differ only in where SBOM generation happens:
Centralized analysis — the Anchore Enterprise deployment pulls the image from the registry, unpacks it, and generates the SBOM server-side.
Distributed analysis — AnchoreCTL pulls the image locally, generates the SBOM on the client, and uploads the result. Source image content never leaves the client machine.
sequenceDiagram
    participant A as AnchoreCTL
    participant R as Registry
    participant E as Anchore Enterprise
    A->>E: Request image analysis
    E->>R: Get image content
    R-->>E: Image content
    E->>E: Generate SBOM, secret scan, etc.
    E->>E: Scan SBOM for vulns and evaluate compliance
Centralized analysis — all image content is handled by the deployment.
sequenceDiagram
    participant A as AnchoreCTL
    participant R as Registry/Docker Daemon
    participant E as Anchore Enterprise
    A->>R: Get image content
    R-->>A: Image content
    A->>A: Generate SBOM, secret scan, etc.
    A->>E: Import SBOM, secret search, fs metadata
    E->>E: Scan SBOM for vulns and evaluate compliance
Distributed analysis — image content stays on the client; only the SBOM is uploaded.
Representative commands:
# Centralized — the deployment pulls and analyzesanchorectl image add docker.io/library/nginx:latest
# Distributed — anchorectl pulls from the registry and analyzes locallyanchorectl image add docker.io/library/nginx:latest --from registry
One-Time Scan
A stateless variant of distributed analysis is available via anchorectl image one-time-scan. It runs the same client-side flow and returns policy and vulnerability results to the caller, but the SBOM is never persisted in Anchore Enterprise, which suits CI pipelines that want fast pass/fail feedback without growing the deployment’s SBOM history.
--fail-on-policy-error returns a non-zero exit code when the policy evaluation fails. By default the command returns a policy check; add -o json to return the policy check, vulnerability scan, and SBOM together for machine parsing, or -o html for a shareable report. One-Time Scans are recorded as Stateless Evaluations in the System > Usage reporting in the Anchore Enterprise GUI.
Analysis State
Analysis is asynchronous. Workers poll an internal queue and update the image’s analysis_status as processing progresses.
stateDiagram
    [*] --> not_analyzed: analysis queued
    not_analyzed --> analyzing: analyzer starts processing
    analyzing --> analyzed: analysis completed successfully
    analyzing --> analysis_failed: analysis fails
    analyzing --> not_analyzed: re-queue by timeout or analyzer shutdown
    analysis_failed --> not_analyzed: re-queued by user request
    analyzed --> not_analyzed: re-queued for re-processing by user request
Monitor Images for Updates
Anchore Enterprise watches the external world on your behalf:
Repository updates — new tags appearing on a watched repository are automatically added as subscriptions.
Tag updates — when the image digest a tag points to changes, the new image is pulled and re-analyzed.
Both checks are driven by the Catalog component on a configurable duty cycle. To manage subscriptions and tune cycle intervals, see Subscriptions.
Base and Parent Images
Container images are built on top of other images via the FROM clause. Docker calls the referenced image the parent image; the broader community uses base image for the same concept, and Anchore Enterprise follows the latter convention. A chain of images related via FROM is an image’s ancestry.
Docker itself defines a base image as an image declared with FROM scratch. Anchore Enterprise does not use that definition — throughout these docs, base image means the image a given image was built from.
Ancestry is reconstructed automatically by comparing layer digests: image B is a descendant of image A only if every layer of A is present in B. No configuration is required — Anchore Enterprise computes ancestry as new images are analyzed.
graph LR
debian:10-->|parent of|mynode:latest
mynode:latest-->|parent of|myapp:v1
Choose the Base Image
By default, the base image is the closest ancestor — mynode:latest for myapp:v1 above. You can override the default by marking a specific ancestor with an annotation, useful for designating a platform team’s “golden image” as the base rather than the immediate parent. The selection rules are:
graph TD
start([start])-->image[image]
image-->first_parent_exists{Does this image have a parent?}
first_parent_exists-->|No|no_base_image
first_parent_exists-->|Yes|first_parent_image[Parent image]
first_parent_image-->config{User base annotations enabled?}
config-->|No|base_image
config-->|Yes|check_parent{Parent has anchore.user/marked_base_image: true?}
check_parent-->|No|parent_exists{Does the parent have a parent?}
parent_exists-->|Yes|parent_image[/Move to next parent image/]
parent_image-->check_parent
parent_exists-->|No|no_base_image
check_parent-->|Yes|base_image
base_image([Found base image])
no_base_image([No base image exists])
The base image filters inherited findings out of policy evaluations and vulnerability scans so developers can focus on issues introduced by their own changes. For the full base-comparison feature, see Compare Against a Base Image.
For the annotation syntax, AnchoreCTL command, and the configuration flag that enables user-marked base images, see Base Image Annotations.
Malware Scanning
During centralized analysis, Anchore Enterprise runs a ClamAV-based malware scan over the image content. Findings are exposed on the image record and can be acted on via the Malware Policy Gate. For enabling scanning, tuning signature-database refresh behavior, and handling images larger than 2 GB, see Scanning Configuration.
3.3.3 - Policy
Policy is how Anchore Enterprise turns findings into decisions. Once an artifact has been analyzed into an SBOM, a policy evaluates that SBOM — together with its vulnerability matches, metadata, and file content — and produces a pass-or-fail verdict that a CI pipeline, admission controller, or reviewer can act on. Policies are authored as JSON documents and managed through the GUI, AnchoreCTL, or the API; they can be evaluated against an artifact on demand, or continuously as vulnerability data and SBOM contents change over time.
Components of a Policy
A policy is a JSON document (a policy bundle) composed of four kinds of configuration, each with its own editor and API surface:
Mappings — ordered selection rules that pick which rule sets and allowlists apply to a given artifact. The first mapping that matches wins. See Policy Mappings.
Allowlists — per-trigger exclusions that downgrade a specific finding (for example, a known false-positive CVE) to go, so it no longer contributes to a failing evaluation. See Allowlists.
Allowlisted and denylisted images — deployment-wide overrides that force an image’s final result to pass or fail regardless of the rest of the evaluation. See Allowed / Denied Images.
Rule sets target one of two artifact types in v6: image for analyzed container images, or sbom for SBOM-typed assets (filesystems and externally supplied SBOMs attached to an app version). Mappings link each artifact type to its applicable rule sets, so evaluating a container image consults image rule sets while evaluating an SBOM asset consults SBOM rule sets. See Policy Mappings for the matching rules.
Rule Sets, Gates, and Triggers
A rule set is a named collection of rules. Each rule specifies four things:
A gate — the category of check (for example, vulnerabilities, metadata, dockerfile, secrets, files).
A trigger — the specific condition within that gate that should match (for example, a vulnerability at or above a severity threshold).
A set of parameters — gate- and trigger-specific inputs that refine the match.
An action — stop, warn, or go — emitted whenever the trigger fires.
Gates provide a logical namespace for triggers, so the same trigger name can exist in different gates without collision. A trigger can fire many times within a single evaluation — one match per detected instance — and each firing produces a finding that carries a unique trigger ID, the rule’s action, and a human-readable message. Findings are the audit-trail unit: every rule that matches contributes one or more findings to the evaluation result.
For the full catalog of gates and their triggers, see Policy Checks.
Actions and the Final Action
Each rule declares a per-rule action — stop, warn, or go. When the rule’s trigger matches, that action is recorded alongside the finding. Once all rules have run, Anchore Enterprise aggregates every recorded action into a single final action for the evaluation:
stop — at least one finding carried action stop (and was not downgraded by an allowlist). The artifact fails evaluation.
warn — no stop actions survived, but at least one warn did. The artifact passes with a warning.
go — no stop or warn actions. The artifact passes cleanly.
go findings never affect the outcome on their own, but they are still recorded in the evaluation response so historical audits can see that a check ran and produced no issue.
A full evaluation takes two slightly different paths depending on the artifact type. Container images go through image-based mapping, every supported gate, and the deployment-wide allowlisted/denylisted image overrides. Imported SBOMs go through SBOM-based mapping and evaluate only the vulnerabilities gate; they are not subject to image-level overrides. Both paths converge on the same action-aggregation logic and the same pass/warn/fail terminal states.
At every step the finding-by-finding output is preserved in the evaluation response, so reviewers can see not just whether an artifact passed but why — every trigger that fired, every allowlist that matched, and every image-level override is recorded alongside the final action.
Pass and Fail
A policy evaluation resolves to one of two terminal states:
Pass — the artifact may proceed. Pass covers both “no findings” (go) and “findings with warnings, but nothing blocking” (warn). Warning findings are recorded for audit purposes but do not block.
Fail — the artifact is blocked. Either an image-level denylist matched (container images only), or at least one rule fired with action stop that was not downgraded by an allowlist.
Because pass/fail is a deterministic function of the policy bundle, the SBOM, and the available vulnerability data, the same evaluation can be re-run later — as vulnerability feeds update or as the policy itself evolves — and the verdict may change without the artifact itself changing. Continuous re-evaluation is how Anchore Enterprise surfaces newly disclosed vulnerabilities against images that were analyzed weeks or months ago.
Further Reading
Policy Checks — the full catalog of gates, triggers, and parameters.
Managing Policies — authoring, uploading, downloading, and activating policy bundles, including the JSON bundle reference.
Testing Policies — previewing evaluations and inspecting detailed findings output.
3.3.4 - Reporting
Analyzing software produces a continuous stream of data — SBOMs, vulnerability matches, policy evaluations, runtime inventory snapshots — and none of it is actionable until someone can ask the right question against it. Anchore Enterprise includes a reporting engine, driven by the Enterprise Reporting Service, that lets teams query the platform’s own data in structured, repeatable ways to answer questions like “which images are failing policy?”, “which tags are affected by a specific CVE?”, or “which Kubernetes namespaces are running containers with critical vulnerabilities?”
The Reports view in v6 operates on the image catalog. App-version-scoped search and reporting — the equivalent queries against apps, versions, and their attached assets — is on the roadmap. For per-version data today, use the endpoints documented in Scan an App Version.
Reporting is distinct from the platform’s export mechanisms. Exports emit SBOMs (SPDX, CycloneDX, Syft), vulnerability disclosure documents, and VEX statements for consumption by downstream tools, auditors, or customers. Reporting, by contrast, is the platform’s internal query layer — it takes stored SBOMs, policy evaluations, and vulnerability matches and produces structured results for the team operating Anchore Enterprise itself.
Templates, Filters, and Columns
Every report is generated from a template that defines the filters a user can apply and the columns that appear in the output. Templates come in two varieties:
System templates — shipped with Anchore Enterprise and maintained by the platform.
User templates — copies of system templates (or of other user templates) with filters, default values, and column layouts adjusted for a particular team’s workflow. User templates can be edited or deleted; system templates cannot.
Anchore Enterprise ships a set of system templates that cover the most common questions, organized around three themes:
Policy compliance — Images Failing Policy Evaluation and Policy Compliance History by Tag identify non-compliant images and track compliance movement over time.
Vulnerability discovery — Images With Critical Vulnerabilities, Artifacts by Vulnerability, Tags by Vulnerability, and Images Affected by Vulnerability locate vulnerable software and the specific images it appears in, allowing queries that start from either the image or the CVE.
Runtime pivots — Vulnerabilities by Kubernetes Namespace, Vulnerabilities by Kubernetes Container, and Vulnerabilities by ECS Container cross fleet-wide findings with runtime inventory, so security teams can focus on workloads that are actually running.
Ad-Hoc and Scheduled Execution
Reports can be run in two modes:
Ad hoc — a user selects a template, applies filters, previews the results, and downloads the output. Appropriate for one-off questions and exploratory analysis.
Scheduled — a saved report is configured to run daily, weekly, or monthly on a chosen day and time. Scheduled runs feed the results into the platform’s notification system, so the team receives the report through the same channels they use for other Anchore Enterprise alerts (email, Slack, Microsoft Teams, Jira, GitHub, or webhook).
Scheduled reporting is what turns point-in-time answers into continuous awareness. A weekly “Images With Critical Vulnerabilities” report, delivered to a security channel every Monday morning, makes remediation work visible before it becomes urgent.
Output Formats
Report results are available in several formats to match how they are consumed:
Tabular — an in-browser view for interactive review.
JSON — machine-readable output for ingestion into other tools or dashboards.
CSV — spreadsheet-friendly output for manual analysis, sharing, or archive.
The CSV format in particular is useful when the underlying result set is large: the GUI may truncate a long list for display, but the CSV download contains the full filtered record set.
Where Reporting Fits
Because reporting reads from the same stored SBOMs and evaluations that every other part of Anchore Enterprise writes to, it supports several distinct workflows with the same underlying engine:
Finding what to remediate — the primary discovery input for Remediation. Before a team can triage, annotate, or fix a finding, they have to find it across a fleet.
Audit and compliance evidence — scheduled reports produce a time-stamped record of policy evaluations and vulnerability exposure, suitable for regulatory and customer audits.
Stakeholder communication — engineering, security, and executive audiences each want a different slice of the same data. User templates make it practical to produce a tailored view for each without maintaining parallel tooling.
Anchore Enterprise produces a continuous stream of findings against your images: enumerated vulnerabilities discovered in the SBOMs extracted from container images, plus policy failures produced during compliance evaluation. Teams typically learn that a finding needs attention through the Reporting engine (for example, a scheduled “Images With Critical Vulnerabilities” report landing in a team channel, or a “Policy Compliance History by Tag” report showing a newly failing tag), or through direct Notifications when a tag’s vulnerability list or policy-evaluation result changes. Either path surfaces the same underlying data; the difference is whether the team pulls it via a query or is pushed to it via an event.
Knowing about a finding is only the first step; remediation is how teams triage, document, and close out those findings. Anchore Enterprise supports three complementary remediation mechanisms, each suited to a different kind of response.
VEX Annotations on Vulnerability Findings
A VEX annotation (Vulnerability Exploitability eXchange) is a per-vulnerability statement declaring whether a given CVE is actually exploitable in the context of a particular app version. Annotations are anchored at the version level, so a single annotation against a (vulnerability, package) pair covers every asset attached to that version. Annotated vulnerabilities are filtered out of reports and dashboards by default, so teams stop re-triaging the same non-exploitable findings on every scan.
Each annotation carries:
A status — Not Affected, Affected, Fixed, or Under Investigation.
A justification (for Not Affected) — for example, Vulnerable Code Not in Execute Path or Inline Mitigation Already Exists.
Free-form impact, action, and additional-detail statements that explain the decision to downstream consumers.
Annotations can be exported as machine-readable VEX documents and shared with customers, auditors, or other stakeholders. Image-scoped VEX exports are available in OpenVEX or CycloneDX format, while app-version VEX exports are available in CycloneDX format only. They can also drive policy decisions: the vulnerabilities gate’s package trigger accepts missing annotation and annotation status parameters to enforce an annotation discipline, available on image rule sets in v6.
When an image fails a policy evaluation, the Action Workbench in the Anchore Enterprise GUI is where teams plan, assign, and communicate the response. Action Workbench lives on the image’s Artifact Analysis view and surfaces two capabilities:
Action plans — a structured grouping of resolutions for the specific policy failures and vulnerabilities on an image. Each resolution associates a remediation message with one or more trigger IDs from the policy evaluation, so the context of the failure travels with the remediation.
Notification delivery — an action plan can be dispatched to various destinations such as email, chat tools, and issue trackers through a preconfigured notification endpoint. This makes the workbench the natural bridge from “Anchore Enterprise flagged this” to “the team responsible has been told what to do.” For the canonical list of destinations and their setup, see Supported Endpoints.
Action plans are also available via the API, which lets CI jobs or custom integrations generate them programmatically.
For the action-plan payload, supported types, and permission requirements, see Reporting and Remediation.
Corrections for False-Positive Matches
Not every finding is an exploitability question; some are simply wrong. A vulnerability match is only as accurate as the identifiers Anchore Enterprise attaches to each package, and those identifiers (primarily Package URLs and CPEs) are synthesized from the metadata available at analysis time. That metadata is often incomplete or ambiguous:
Java/Maven packages frequently omit the canonical groupId and artifactId from their JAR manifests, so the analyzer has to guess a purl from partial information.
Multi-valued version fields in JAR manifests mean the analyzer must pick a “best” version, which may not be the one the vulnerability feed keyed against.
CPE candidates are synthesized heuristically from vendor, product, and version metadata, and the synthesized vendor/product string does not always agree with what downstream feeds (NVD, GHSA, vendor feeds) use to describe the same component.
When any of these guesses drifts from the identifier the vulnerability feed actually uses, the package is matched against the wrong vulnerability records: a finding that looks real but does not reflect the software actually installed.
A correction overrides the extracted metadata (CPEs, Package URLs, package name, and related fields) at scan time so subsequent evaluations match against the right identifiers. Corrections are the appropriate tool when the match itself is wrong, as opposed to correct-but-not-exploitable (a VEX case).
For the correction format, supported package types, and worked examples, see Corrections.
3.3.6 - Data Management
Anchore Enterprise is a data-intensive system. Every analyzed artifact produces records — SBOMs, vulnerability matches, policy evaluations, annotations — that continue to pay returns long after the initial analysis: re-evaluation against new vulnerability feeds, audit trails, base-image comparison, and drift detection all rely on stored history. But that history grows without bound as new artifacts are analyzed, and large deployments need a way to control storage consumption without losing the data that is actually in use.
The mechanisms below operate on the image catalog and the SBOMs held in it. They do not apply to v6 apps, versions, and assets.
Anchore Enterprise provides two complementary mechanisms for managing image-catalog analysis data over its life: the analysis archive, which moves old records to cheaper storage while keeping them restorable, and artifact lifecycle policies, which delete old records outright.
Working Set and Archive Set
Analysis data lives in one of two sets at any given time:
Working set — analyses in the analyzed state, fully available for policy evaluation, content queries, feed-driven re-evaluation, and vulnerability updates. This is where the platform operates day-to-day.
Archive set — point-in-time snapshots held in (optionally separate) object storage. Archived analyses preserve all annotations, tags, metadata, and policy history, consume minimal database space, and are not updated with new vulnerability feeds unless restored. The archive set is designed for long-term retention at low cost.
An analysis may exist in both sets simultaneously — the archive is not exclusive. An archived analysis can be restored to the working set at any time without re-downloading or re-analyzing the original artifact, because the archive captures everything needed to rehydrate the record.
Automatic Archiving
Anchore Enterprise supports archive rules that automatically move analyses from the working set to the archive based on criteria like analysis age, tag history depth, or runtime-inventory last-seen date. Rules can be scoped to an account or made system-global, and they run on a recurring catalog duty cycle. When an archive rule matches, the analysis is moved — the archive copy is created and the working-set copy removed — keeping the working set focused on artifacts the organization actively cares about.
The same rule framework also supports a delete transition that operates on the archive set, purging old archived analyses entirely. For the rule fields, JSON structure, and CLI management, see Analysis Archive.
Artifact Lifecycle Policies
Artifact lifecycle policies are a stricter, delete-only counterpart to archive rules. They evaluate a set of criteria — analysis age, tag history, runtime-inventory status — and when a matching image in the catalog is found, the policy permanently deletes the record. There is no archive step; the goal is simply to keep the deployment lean.
Artifact lifecycle policies are system-global by design and can be administered only by system administrators. They apply across every account and execute on a scheduled catalog cycle. They are the right tool when retention is not required — for example, short-lived scratch accounts that never need historical lookups, or compliance regimes that actively prefer data minimization.
If you need the data later — for audit, customer lookup, historical comparison, or slow-moving compliance review — use archive rules to move it out of the hot working set while keeping it recoverable.
If you do not need the data later — flush old, low-value analyses to keep the database lean — use artifact lifecycle policies to delete outright.
Many deployments combine the two: archive rules move analyses older than N days to cheaper storage, and artifact lifecycle policies delete records older than M months. This yields a multi-tier retention model — hot working set, cheap archive tier, eventual purge — without requiring anyone to touch the data manually.
For the storage backend that backs the archive tier (Postgres by default, or an S3-compatible object store for scale and cost), see Object Store: Analysis Archive.
3.4 - Anchore Data Service
Anchore Enterprise relies on external vulnerability and security data to perform accurate analysis. The Anchore Data Service is a hosted service operated by Anchore that aggregates, normalizes, and serves pre-built datasets to customer deployments. Authentication is handled automatically through your Anchore Enterprise license — no additional credentials are required.
Datasets
The Anchore Data Service currently provides the following datasets. Upstream pipelines refresh these datasets every 6 hours, and each Anchore Enterprise deployment polls for updates hourly by default (configurable via the Data Syncer service).
Vulnerability Database
The vulnerability database (vulnerability_db) contains vulnerability records aggregated from 20+ sources, including:
NVD (National Vulnerability Database), with additional data enrichment by Anchore
GitHub Security Advisories (GHSA)
RHEL (Red Hat Enterprise Linux)
Debian
Ubuntu
Alpine
Amazon Linux
Oracle Linux
SLES (SUSE Linux Enterprise Server)
Fedora
Arch Linux
Mariner / Azure Linux
VMware PhotonOS
Wolfi
Chainguard (Libraries and OS)
Bitnami
MSRC (Microsoft Security Response Center)
Echo
MinimOS
SecureOS
Vulnerability Match Exclusions
The vulnerability match exclusions database (vulnerability_match_exclusions_db) contains CVEs that Anchore has identified as false positives and excluded from matching. This is an Anchore Enterprise-exclusive dataset — it is manually curated by Anchore and is not included in the open-source Grype vulnerability data, providing noise reduction beyond what public feeds offer.
EPSS and KEV Data
Vulnerability records are enriched with:
EPSS (Exploit Prediction Scoring System) scores and percentiles, providing a probability estimate of exploitation in the wild
CISA KEV (Known Exploited Vulnerabilities) annotations, flagging vulnerabilities with confirmed active exploitation
ClamAV Malware Database
The malware database (clamav_db) contains ClamAV signatures used to detect malware, cryptominers, and other malicious content within container image layers during analysis.
STIG Profiles
The STIG profiles database (stig_profile_db) contains Anchore-supported DISA STIG profiles for evaluating container image compliance against Security Technical Implementation Guides.
Data Syncer Service
Anchore Enterprise includes a Data Syncer service that is responsible for downloading datasets from the Anchore Data Service and making them available to the rest of the deployment. The Data Syncer runs on a configurable schedule (hourly by default) and manages the full lifecycle of dataset synchronization. It communicates with the Anchore Data Service at https://data.anchore-enterprise.com, which must be reachable from your deployment — see Data Syncer Service Configuration for network requirements.
flowchart LR
    SRC["Upstream sources<br/>collected and normalized"]
    ADS["Anchore Data Service<br/>aggregates and publishes<br/>(rebuilt every 6hrs)"]
    ENT["Anchore Enterprise<br/>deployment"]

    SRC --> ADS
    ADS -->|"Data Syncer pulls<br/>updates hourly"| ENT
Air-Gapped Deployments
For environments without internet connectivity, datasets can be downloaded externally using AnchoreCTL and then uploaded to the air-gapped deployment. See Air-Gapped Configuration for instructions.
Anchore Enterprise exposes an API that lets the software entities (agents, plugins, and
other components) integrating external systems with Enterprise be tracked and monitored.
Today this API is used by the Kubernetes Inventory agent; other integration instances
will adopt it over time. Existing agents and plugins continue to function whether or not
they participate in this API — participating instances simply gain the ability to be
tracked and monitored.
The API has two parts: integration registration and integration health reporting.
Both are described below.
Terminology
Integration instance: A software entity, like an agent or plugin, that integrates and
external system with Anchore Enterprise. A deployed Kubernetes Inventory agent, Kubernetes Admission
Controller, and ECS Inventory agent are all examples of integration instances.
Integration status: The (life-cycle) status of the integration instance as perceived
by Enterprise. After registration is completed, this status is determined based on if
health reports are received or not.
Reported status: The status of the integration instance as perceived by the integration
instance itself. This is determined from the contents of the health reports, if they contain
any errors or not.
Integration registration
When an integration instance that supports integration registration and health reporting
is started it will perform registration with Anchore Enterprise. This is a kind of
handshake where the integration instance introduces itself, declaring which type it is
and presenting various other information about itself. In response, Anchore Enterprise
provides the integration instance with the uuid that identifies the integration
instance from that point onwards.
The registration request includes two identifiers: registration_id and
registration_instance_id. Anchore Enterprise maintains a record of the association
between integration uuid and <registration_id, registration_instance_id>.
If an integration instance is restarted, it will perform registration again. Assuming the
<registration_id, registration_instance_id> pair in that re-registration remains the
same as in the original registration, Enterprise will consider the integration instance
to be the same (and thus provide the integration instance with the same uuid). Should
the <registration_id, registration_instance_id> pair be different, then Enterprise will
consider the integration instance to be different and assign it a new uuid.
Integrations deployed as multiple replicas
An integration can be deployed as multiple replicas. An example is the Kubernetes Inventory agent,
which helm chart deploys it as a K8s Deployment. That deployment can be specified to have
replicas > 1 (although it is not advisable as the agent is strictly speaking not
implemented to be executed as multiple replicas, it will work but only add unnecessary load).
In such a case, each replica will have identical configuration. They will register as
integration instances and be given their own uuid. By inspecting the registration_id and
registration_instance_id it is often possible to determine if they instances are part of
the same replica set. They will then have registered with identical registration_id but
different registration_instance_id. The exception is if each integration instance
self-generated a unique registration_id that they used during registration. In that case
they cannot be identified to belong to the same replica set this way.
Integration health reporting
Once registered, an integration instance can send periodic health reports to Anchore Enterprise
Enterprise. The interval between two health reports can be configured to be 30 to 600
seconds. A default values will typically be 60 seconds.
Each health report includes a uuid that identifies it and timestamp when it was sent.
These can be used when searching the integration instance’s log file during troubleshooting.
The health report also includes the uptime of the integration instance as well as an
’errors’ property that contains errors that the integration wants to make Anchore Enterprise
aware of. In addition to the above, health reports can also include data specific to the
type of integration.
Reported status derived from health reports
When Anchore Enterprise receives a health report that contains errors from an integration
instance, it will set that instance’s reportedStatus.state to unhealthy and the
reportedStatus.healthReportUuid is set to the uuid of the health report.
If subsequent health reports do no contain errors, the instance’s reportedStatus.state
is set to healthy and the reportedStatus.healthReportUuid is unset.
This is an example of what the reported status can look like from an integration instance
that sends health reports indicating errors:
{
    "reportedStatus": {
      "details": {
        "errors": [
          "unable to report Inventory to Anchore account account0: failed to report data to Anchore: \u0026{Status:4",
          "user account not found (account1) | ",
          "unable to report Inventory to Anchore account account2: failed to report data to Anchore: \u0026{Status:4",
          "user account not found (account3) | "
        ],
        "healthReportUuid": "d676f221-0cc7-485e-b909-a5a1dd8d244e"
      },
      "reason": "Health report included errors",
      "state": "unhealthy"
    }
}
The details.errors list indicates that there is some issues related to ‘account0’,
‘account1’, ‘account2’ and ‘account3’. To fully triage and troubleshoot these issues one
will typically have to search the log file for the integration instance.
This is an example of reported status for case without errors:
{
    "reportedStatus": {
      "state": "healthy"
    }
}
The below figure illustrates how the reportedStatus.state property will transition
between its states.
Integration status derived from health reports
When an integration instance registers with Anchore Enterprise, it will declare at what
interval it will send health reports. A typical value will be 60 seconds.
As long as health reports are received from an integration instance, Enterprise will consider
it to be active. This is reflected in the integration instance’s integrationStatus.state
which is set to active.
If three (3) consecutive health reports fail to be received by Anchore Enterprise, it will
set the integration instance’s integrationStatus.state to inactive.
This is an example of what the integration status can look like when health reports have
not been received from an integration instance:
{
  "integrationStatus": {
    "reason": "Integration last_seen timestamp is older than 2024-10-21 15:33:07.534974",
    "state": "inactive",
    "updatedAt": "2024-10-21T15:46:07Z"
    }
}
A next step to triage this could be to check if the integration instance is actually
running or if there is some network connectivity issue preventing health reports from
being received.
This is an example of integration status when health reports are received as expected:
The below figure illustrates how the integrationStatus.state will transition between
its (lifecycle) states.
Integration instance properties
An integration instance has the below properties. Some properties may not have a value.
accountName: The account that integration instance used during registration (and thus
belongs to).
accounts: List of account names that the integration instance handles. The list is
updated from information contained in health reports from the integration instance.
For the Kubernetes Inventory agent, this list holds all accounts that the agent has
recently attempted to send inventory reports for (regardless if the attempt
succeeded or not).
clusterName: The cluster where the integration instance executes. This will typically
be a Kubernetes cluster.
description: Short arbitrary text description of the integration instance.
explicitlyAccountBound: List of account names that the integration instance is
explicitly configured to handle. This does not include account names that an
integration instance could learn dynamically. For instance, the Kubernetes Inventory agent
can learn about account names to handle via a special label set on the namespaces.
Such account names are not included in this property.
healthReportInterval: Interval in seconds between health reports from the integration
instance.
integrationStatus: The (life cycle) status of the integration instance.
lastSeen: Timestamp when the last health report was received from the integration
instance.
name: Name of the integration instance.
namespace: The namespace where the integration executes. This will typically be a
Kubernetes namespace.
namespaces: List of namespaces that the integration is explicitly configured to handle.
registrationId: Registration id that the integration instance used during registration.
registrationInstanceId: Registration instance id that the integration instance used
during registration.
"reportedStatus: The health status of the integration instance derived from information
reported in the last health report.
startedAt: Timestamp when the integration instance was started.
type: The type of the integration instance. In Enterprise v5.11.0,
k8s_inventory_agent is the only value.
uptime: Uptime (in seconds) of the integration instance.
username: Username that the integration instance registered using.
uuid: The UUID of the integration instance. Used in REST API to specify instance.
version: Software version that the integration instance runs.
4.1 - Container Registries
Anchore Enterprise can analyze images from any Docker V2 compatible registry. A registry in Anchore Enterprise is a stored credential configuration: it tells the deployment how to authenticate to a registry host, and on its own it does not pull or analyze any images. (Repositories are the unit of analysis; see Watch a Repository.)
Anchore Enterprise attempts to download images from any registry without further configuration. You only need to define a registry when it requires authentication: once a registry and its credentials are defined, every pull for an image from that registry uses them.
A few options and behaviors apply to every registry, regardless of how you add it:
TLS certificate verification is on by default. Anchore Enterprise verifies the registry’s TLS certificate. You can turn verification off for a registry that presents a self-signed certificate or one signed by an unknown CA.
Credential validation is on by default. Anchore Enterprise validates the credential when a registry is added. Because validation methods for public registries change over time, you can skip the check, which is useful when a valid credential fails validation or when adding a credential before it is active at the registry.
Multiple credentials per host. You can store different credentials for different repositories on the same host (for example, two private repositories on docker.io) by qualifying each entry with a repository path.
Passwords are write-only. A registry’s password cannot be retrieved through the GUI, AnchoreCTL, or the API.
Most Docker V2 registries authenticate with a username and password. Amazon ECR, Google GCR, and Microsoft Azure also support their own native credentialing; see the registry-specific configuration below.
Manage Registries in the Anchore Enterprise GUI
Registry management lives under System → Configuration → Registries. Listing and creating registries requires a user in the admin account or a member of the read-write role for the account.
To add a registry, open the Registries tab and select Let’s add one! (or Add New Registry if registries already exist). In the modal, provide the Registry (hostname with optional port), the Type (for example docker_v2 or awsecr), and the Username and Password. Two toggles set the behavior described above: Allow Self Signed turns off TLS certificate verification, and Validate on Add skips credential validation.
After a registry is added, edit its credentials and options from the Actions column. The setup help for each registry type is also available inline via “Need some help setting up your registry?” near the bottom of the modal.
To store different credentials for repositories on the same host, add each entry with a repository path (for example, docker.io/anchore/*).
Manage Registries with AnchoreCTL
List the defined registries:
anchorectl registry list
Add a registry. The registry argument is the fully qualified hostname and optional port (for example registry.example.com:5000):
Both registry add and registry update accept --secure-connection=<true|false> (TLS certificate verification) and --validate=<true|false> (credential validation at add time); each defaults to true.
Get the details of a specific registry (the password is never returned):
anchorectl registry get <registry>
Update a registry’s username, password, or connection options:
Delete a registry. Deleting a registry record does not delete the image or tag records associated with it:
anchorectl registry delete <registry>
Manage Registries with the API
Registry configuration is managed through the Registries endpoints:
Method
Endpoint
Description
GET
/registries
List configured registries (list_registries)
POST
/registries
Add a registry (create_registry)
GET
/registries/{registry}
Get a registry configuration (get_registry)
PUT
/registries/{registry}
Update a registry (update_registry)
DELETE
/registries/{registry}
Delete a registry (delete_registry)
The full request and response schemas are in the API browser; search for the Registries tag.
Registry-Specific Configuration
The credential fields are the same whether you add a registry through the GUI, AnchoreCTL, or the API. For registries with native credentialing, see the registry-specific guides:
Amazon AWS typically uses keys instead of traditional usernames & passwords. These keys consist of an access key ID and a secret access key. While it is possible to use the aws ecr get-login command to create an access token, this will expire after 12 hours so it is not appropriate for use with Anchore Enterprise, otherwise a user would need to update their registry credentials regularly. So when adding an Amazon ECR registry to Anchore Enterprise you should pass the aws_access_key_id and aws_secret_access_key.
The registry-type parameter instructs Anchore Enterprise to handle these credentials as AWS credentials rather than traditional usernames and passwords. Currently Anchore Enterprise supports two types of registry authentication standard username and password for most Docker V2 registries and Amazon ECR. In this example we specified the registry type on the command line however if this parameter is omitted then AnchoreCTL will attempt to guess the registry type from the URL which uses a standard format.
Anchore Enterprise will use the AWS access key and secret access keys to generate authentication tokens to access the Amazon ECR registry, Anchore Enterprise will manage regeneration of these tokens which typically expire after 12 hours.
In addition to supporting AWS access key credentials Anchore also supports the use of IAM roles for authenticating with Amazon ECR if Anchore Enterprise is run on an EC2 instance.
In this case you can configure Anchore Enterprise to inherit the IAM role from the EC2 instance hosting the system.
When launching the EC2 instance that will run Anchore Enterprise you need to specify a role that includes the AmazonEC2ContainerRegistryReadOnly policy.
While this is best performed using a CloudFormation template, you can manually configure from the launch instance wizard.
Step 1: Select Create new IAM role.
Step 2: Under type of trusted entity select EC2.
Ensure that the AmazonEC2ContainerRegistryReadOnly policy is selected.
Step 3: Attach Permissions to the Role.
Step 4: Name the role.
Give a name to the role and add this role to the Instance you are launching.
On the running EC2 instance you can manually verify that the instance has inherited the correct role by running the following command:
Step 5: Enable IAM Authentication in Anchore Enterprise.
By default the support for inheriting the IAM role is disabled.
To enable IAM based authentication add the following entry to the top of Anchore Enterprise config.yaml file:
allow_awsecr_iam_auto: True
Step 6: Add the Registry using the AWSAUTO user.
When IAM support is enabled instead of passing the access key and secret access key use “awsauto” for both username and password. This will instruct Anchore Enterprise to inherit the role from the underlying EC2 instance.
To use an Azure Registry, you can configure Anchore Enterprise to use either the admin credential(s) or a service principal. Refer to Azure documentation for differences and how to setup each. When you’ve chosen a credential type, use the following to determine which registry command options correspond to each value for your credential type
Admin Account
Registry: The login server (Ex. myregistry1.azurecr.io)
Username: The username in the ‘az acr credential show –name ’ output
Password: The password or password2 value from the ‘az acr credential show’ command result
Service Principal
Registry: The login server (Ex. myregistry1.azurecr.io)
Username: The service principal app id
Password: The service principal password Note: You can follow Microsoft Documentation for creating a Service Principal.
To add an azure registry credential, invoke anchorectl as follows:
Once a registry has been added, any image that is added (e.g. anchorectl image add <Registry>/some/repo:sometag) will use the provided credential to download/inspect and analyze the image.
4.1.3 - Google Container Registry
When working with Google Container Registry it is recommended that you use JSON keys rather than the short lived access tokens.
JSON key files are long-lived and are tightly scoped to individual projects and resources. You can read more about JSON credentials in Google’s documentation at the following URL: Google Container Registry advanced authentication
Once a JSON key file has been created with permissions to read from the container registry then the registry should be added with the username _json_key and the password should be the contents of the key file.
In the following example a file named key.json in the current directory contains the JSON key with readonly access to the my-repo repository within the my-project Google Cloud project.
Harbor is an open-source, cloud-native container registry. Anchore Enterprise integrates with Harbor in two ways: as a registry it pulls images from for analysis, and as a scanner that Harbor delegates its vulnerability scans to.
Use Harbor as a Registry
To let Anchore Enterprise pull and analyze images from Harbor, add it as a Docker V2 registry with your Harbor credentials:
Harbor URL — the base URL of your Harbor registry.
Harbor username — a Harbor account with access to the repositories you want analyzed (for example, the admin account).
Once the registry is added, any image you add (for example, anchorectl image add core.harbor.domain/some/repo:sometag) uses the stored credential to download, inspect, and analyze the image. See Container Registries for the full registry-management surface across the GUI, AnchoreCTL, and the API.
Harbor Scanner Adapter
For a deeper integration, the Harbor Scanner Adapter for Anchore lets Harbor issue scans to Anchore Enterprise directly. The adapter is a bridge between the two systems: Harbor schedules scans — on push, on a recurring schedule, or on demand — and the adapter forwards them to your Anchore Enterprise deployment, with results surfaced in both Harbor and the Anchore Enterprise GUI.
Using Harbor with Anchore — push images, run and schedule scans, gate on results, use Harbor as a proxy cache, and troubleshoot.
4.1.4.1 - Harbor Scanner Adapter Setup
Integrating Harbor
The Harbor Scanner Adapter for Anchore can be used to integrate Harbor with Anchore Enterprise. This scanner provides a gateway for Harbor to communicate with your Anchore Enterprise deployment thereby making it possible for jobs to be scheduled for scans through Harbor.
The adapter’s configuration can be customized using environment variables defined in the harbor-adapter-anchore.yaml.
You can edit this file to adjust the environment variables as needed to fit your deployment. You must configure how the adapter connects to Anchore Enterprise. The following variables are compulsory to be configured:
Note: It is highly recommended that you create a new account in the Anchore Enterprise deployment and a new user with credentials dedicated to the Harbor adapter. When using Enterprise 5+, you can also utilize api keys. Learn how to generate them here
For full Harbor Adapter configuration options, see here
Once you have edited the value file, use the updated file to deploy the Harbor Scanner Adapter by executing:
kubectl apply -f harbor-adapter-anchore.yaml
Once the adapter has been configured as shown above, you will need to add Anchore as the default scanner in Harbor.
Adding Anchore as default scanner
Setting Anchore as the default scanner in Harbor ensures that all image scans, unless specified otherwise, are automatically sent to your Anchore Enterprise deployment for scanning. Follow the steps below to add Anchore as a scanner and set it as the default:
In the Harbor UI login as an admin and navigate to Administration->Interrogation Services->Scanners and click “+ New Scanner”. In older versions of Harbor, this can be found under Configuration->Scanners.
In ‘Endpoint’, use the adapter hostname/url. The default is the following:
http://harbor-scanner-anchore:8080
Leave the authorization field empty, as no API key was set in the adapter deployment environment for this example.
Please untick use internal registry address. Anchore Enterprise could have issues accessing the Harbor registry otherwise
Click “Test Connection” to verify the connection. Then, click “Add” to add the scanner.
Now to ensure all projects in Harbor makes use of the newly configured Anchore scanner, you must make the Anchore scanner your default Scanner. In the Harbor UI, navigate to the project->scanner and click “Select Scanner” click on the radio button next to the selected Anchore Scanner to make it the default scanner.
Configuring Timeouts
Since Harbor and Anchore Enterprise are separate systems, an API call is needed for communication between them. As a result, configuring timeouts may be necessary depending on factors such as your network, the proximity of the two systems, and overall latency.
The ANCHORE_CLIENT_TIMEOUT_SECONDS setting determines the timeout duration (in seconds) for API calls from the Harbor Adapter to the Anchore Enterprise service. By default, it is set to 60 seconds. If the API call to Anchore exceeds this time, the scan may fail or be delayed. A shorter timeout can result in more frequent timeouts during scans, especially if the system is under heavy load or if Anchore’s response time is slower than expected.
The proximity of Anchore Enterprise to the registry also plays a crucial role in scan performance. If Anchore Enterprise is geographically distant or on a separate network from the registry, network latency could increase, leading to slower scan times or potential timeouts. Keeping Anchore Enterprise close to the registry in terms of network topology can reduce latency, improving scan efficiency and reducing the likelihood of timeouts.
To increase the ANCHORE_CLIENT_TIMEOUT_SECONDS, set the environment variable in your harbor-adapter-anchore.yaml file and reapply it.
You can now see the pushed image in the Harbor UI by Navigating to the project under the project menu
Initiate a Vulnerability Scan
To scan your image for vulnerabilities select the image from the repository list. Click SCAN VULNERABILITY under the Actions menu:
During integration you will have configured Anchore Enterprise as your default scanner. This means vulnerability scan requests will be sent to your Anchore Enterprise deployment. Once the scan is complete, the results will appear in both Harbor and the Anchore Enterprise GUI. You can view details about the vulnerabilities, including severity and remediation options.
Scheduling a Vulnerability Scan
Harbor allows you to schedule automated vulnerability scans on your container images. These scans can be performed using the configured scanner (Anchore Enterprise) and will help identify vulnerabilities within the images.
Navigate to Interrogation Services. Under the Vulnerability tab you will see options on scheduling scans (Hourly, daily, weekly or custom). You can also initiate scan of all your images immediately by clicking the SCAN NOW button.
Information regarding scan in progress will be provided on this page.
It is important to note that weekly scans can take time, especially if you have many images. Anchore Enterprise will fetch the latest vulnerability results only if it hasn’t scanned the image before since it caches images it has previously seen. This helps to reduce the overall time required for weekly scans. Additionally, number of analyzers, network latency and timeouts can impact the time taken for a weekly scan to complete.
Enable Image Scanning on Push
By enabling the Scan on Push option under the project’s configuration, Harbor will automatically scan any new images pushed to the project, helping you identify and manage potential security risks efficiently. To enable this. Navigate to the desired project -> configuration and look for the option vulnerability scanning as shown in the picture
Prevent vulnerable images from running
To prevent vulnerable images from being pulled and run, you can set up a policy which uses the last known vulnerability results.
Please note: Anchore Enterprise is still able to pull images to conduct scans.
To do this, navigate to the desired Project -> Configuration and enable the Vulnerability Scanning option
Locate the Deployment Security option, enable it, and choose the severity level to enforce.
Adding Proxy Registries
Harbor has the ability to act as a proxy registry linking to preconfigured upstream registries like DockerHub. This allows users to pull images from Harbor directly which in turn using pre configured credentials pulls and caches the images from an upstream source.
Use Case:
A common use case is that customers want to restrict registry access in a production and/or secure environment to only their Harbor registry and as such Anchore’s own Enterprise images are published and accessible via DockerHub and Iron Bank which might not be accessible. To resolve this, you can setup a proxy cache registry in Harbor and then pull the image from your Harbor deployment.
Don’t forget you can also configure your Anchore Enterprise values.yaml file so that your deployment will pull the images from your private Harbor registry
Finally, an added benefit is that you have a local copy of the Anchore Enterprise Images rather than relying on a public services such as DockerHub or Iron Bank.
Debugging scan issues
When image scanning fails in Harbor using Anchore, it’s important to review logs from three key components: Harbor, the Anchore Adapter, and Anchore Enterprise. Collecting these logs and generating a support bundle can help diagnose the issue. You can then share this information with the Anchore Customer Success team for further assistance.
For Anchore Enterprise, follow instructions here to generate a support bundle
4.2 - CI / CD Integration
Integrating Anchore Enterprise into your CI/CD pipeline enables fast shift-left feedback, so developers can identify and resolve security issues early in the software development lifecycle.
Platform-specific guides are available for GitHub, GitLab, Jenkins, Azure Pipelines, and AWS CodeBuild; see the subpages in this section. This page covers the requirements and the integration patterns common to all of them.
Requirements
Network access. Anchore Enterprise must be deployed so its API is reachable from your pipeline runners. For centralized analysis, the deployment must also be able to reach the container registries that host your images.
Authentication.API keys are recommended for authenticating from a pipeline, though username and password authentication is also supported.
AnchoreCTL.AnchoreCTL is the primary interface for CI/CD automation and should be version-aligned with your deployment. A common practice is to fetch it from your Anchore Enterprise deployment during the job so the client always matches the server.
Distributed analysis is the recommended default for CI. AnchoreCTL generates the SBOM on the runner and uploads it, so image content never leaves the pipeline. Give your runners fast CPU and I/O, and enable cataloger parallelism to speed up SBOM generation. See Using Distributed Analysis Mode for the AnchoreCTL configuration.
Centralized analysis is required only when you need malware scanning, which unpacks image layers server-side. The deployment pulls and analyzes the image itself.
Gate the Pipeline on Policy
Use the Anchore Enterprise policy engine to turn raw findings into a pass/fail decision the pipeline can act on. Both policy evaluation scopes expose --fail-based-on-results, which returns a non-zero exit code when the result is fail and so fails the CI step.
Evaluate a standalone image in the image catalog against the active policy:
Or check the status of an app version, which rolls up policy results across every asset attached to the version:
anchorectl app version policy status get <VERSION> --app <APP> --fail-based-on-results
On image check, --detail adds the gate, trigger, and remediation detail developers need to resolve violations; for an app version, list the findings behind the verdict with anchorectl app version policy findings list <VERSION> --app <APP>.
One-Time Scan (Stateless Evaluation)
When a pipeline only needs fast pass/fail feedback and does not need the build’s SBOM persisted in the deployment, use a stateless One-Time Scan:
For the full behavior, output options, and how it appears in usage reporting, see One-Time Scan.
4.2.1 - AWS CodeBuild
Image scanning can be integrated into your AWS CodeBuild pipeline using anchorectl. This guide provides an end-to-end example that creates all required AWS resources (ECR, CodeCommit, S3, IAM roles, CodeBuild, and CodePipeline) from scratch. If you already have an existing CodeBuild project and CodePipeline, the key integration points are the install phase (to install anchorectl), the post_build commands, and the artifacts section of the buildspec.yml in Step 5.
Requirements
Anchore Enterprise is deployed in your environment, with the API accessible from your AWS CodeBuild environment.
An AWS account with permissions to create ECR repositories, CodeCommit repositories, CodeBuild projects, CodePipeline pipelines, S3 buckets, and IAM roles.
The AWS CLI installed and configured with valid credentials.
1. Configure Variables
Set the following shell variables for use throughout the guide. Replace the placeholder values with your actual Anchore Enterprise deployment URL, username, and password. The ANCHORECTL_PASSWORD value should be treated as a secret to prevent exposure in logs.
Create an ECR repository to store your container images. Image tag immutability is enabled to ensure each build produces a unique, traceable image tag derived from the git commit hash.
Create an S3 bucket for CodePipeline to store build artifacts (including Anchore scan results). Versioning, encryption, and public access blocking are enabled for security best practices.
The CodeBuild project defines the build environment and passes Anchore Enterprise credentials as environment variables. The privilegedMode setting is required for Docker-in-Docker builds.
Note: The ANCHORECTL_PASSWORD is included as a PLAINTEXT environment variable here for simplicity. For production use, store it in AWS Secrets Manager or SSM Parameter Store and reference it with type: SECRETS_MANAGER or type: PARAMETER_STORE in the environmentVariables block.
This is the most easily scalable method for scanning images. Distributed scanning uses the anchorectl utility to build the SBOM directly on the CodeBuild runner and then pushes the SBOM to Anchore Enterprise through the API. This avoids the need to provide registry credentials in the Enterprise backend, since the image is loaded directly from the local Docker daemon.
Clone the CodeCommit repository and create a buildspec.yml with the following content. The buildspec installs anchorectl directly from your Anchore Enterprise deployment (ensuring version compatibility), builds and tags the Docker image using the git commit hash, scans the image with Anchore Enterprise, and exports all scan artifacts.
git clone "$(aws codecommit get-repository \
--region "$AWS_REGION"\
--repository-name "$CODECOMMIT_REPO_NAME"\
--query 'repositoryMetadata.cloneUrlHttp'\
--output text)"cd "$CODECOMMIT_REPO_NAME"git checkout -b main
cat > buildspec.yml <<'EOF'
version: 0.2
phases:
install:
commands:
### install anchorectl from your Anchore Enterprise deployment to ensure version compatibility
- curl -sSfL -u "${ANCHORECTL_USERNAME}:${ANCHORECTL_PASSWORD}" "${ANCHORECTL_URL}/v2/system/anchorectl?operating_system=linux&architecture=amd64" | tar -zx -C /usr/local/bin anchorectl
pre_build:
commands:
- AWS_ACCOUNT_ID=$(aws sts get-caller-identity --query Account --output text)
### use the short git commit hash as the image tag for traceability
- IMAGE_TAG=$(echo "$CODEBUILD_RESOLVED_SOURCE_VERSION" | cut -c1-7)
- IMAGE_URI=${AWS_ACCOUNT_ID}.dkr.ecr.${AWS_REGION}.amazonaws.com/${IMAGE_REPO_NAME}:${IMAGE_TAG}
- aws ecr get-login-password --region "$AWS_REGION" | docker login --username AWS --password-stdin ${AWS_ACCOUNT_ID}.dkr.ecr.${AWS_REGION}.amazonaws.com
build:
commands:
- |
docker build -t ${IMAGE_REPO_NAME}:${IMAGE_TAG} \
--build-arg CI=aws-codepipeline \
--build-arg REPO=${IMAGE_REPO_NAME} \
--build-arg COMMIT=${CODEBUILD_RESOLVED_SOURCE_VERSION} \
--build-arg COMMIT_SHORT=${IMAGE_TAG} \
--build-arg PIPELINE=${CODEBUILD_INITIATOR} \
--build-arg REGION=${AWS_REGION} \
.
- docker tag ${IMAGE_REPO_NAME}:${IMAGE_TAG} ${IMAGE_URI}
post_build:
commands:
### scan the image from the local Docker daemon (distributed mode) and wait for analysis to complete
### --get all=./ exports all scan artifacts (SBOMs, vulnerabilities, policy evaluation) to the working directory
- |
anchorectl image add ${IMAGE_URI} --dockerfile Dockerfile --from docker --dockerfile Dockerfile --no-auto-subscribe --wait --get all=./ \
--annotation "ci=aws-codepipeline" \
--annotation "repo=${IMAGE_REPO_NAME}" \
--annotation "commit=${CODEBUILD_RESOLVED_SOURCE_VERSION}" \
--annotation "commit_short=${IMAGE_TAG}" \
--annotation "pipeline=${CODEBUILD_INITIATOR}" \
--annotation "region=${AWS_REGION}"
### evaluate the image against your Anchore Enterprise policy
### set --fail-based-on-results to break the build if the policy evaluation returns FAIL
- anchorectl image check ${IMAGE_URI} --fail-based-on-results --detail
- docker push ${IMAGE_URI}
- printf '[{"name":"app","imageUri":"%s"}]' "${IMAGE_URI}" > imagedefinitions.json
artifacts:
files:
- imagedefinitions.json
- content.json
- image-metadata.json
- policy-evaluation.json
- sbom.json
- sbomcyclonedx.json
- sbomspdx.json
- vulnerability.json
EOFcat > Dockerfile <<'EOF'
FROM public.ecr.aws/ubuntu/ubuntu:latest
ARG CI
ARG REPO
ARG COMMIT
ARG COMMIT_SHORT
ARG PIPELINE
ARG REGION
LABEL org.opencontainers.image.source="${REPO}" \
org.opencontainers.image.revision="${COMMIT}" \
com.anchore.ci="${CI}" \
com.anchore.commit.short="${COMMIT_SHORT}" \
com.anchore.pipeline="${PIPELINE}" \
com.anchore.region="${REGION}"
ENV DEBIAN_FRONTEND=noninteractive
RUN apt-get update \
&& apt-get install -y --no-install-recommends \
python3 \
python3-pip \
&& rm -rf /var/lib/apt/lists/*
CMD ["python3", "--version"]
EOFgit add .
git commit -m "Initial commit"git push origin main
cd ..
The --get all=./ flag on anchorectl image add exports the following scan artifacts to the build directory, which are then stored as pipeline artifacts in S3:
Artifact
Description
sbom.json
Anchore-native SBOM format
sbomcyclonedx.json
CycloneDX SBOM (industry standard)
sbomspdx.json
SPDX SBOM (industry standard)
vulnerability.json
Full vulnerability report
policy-evaluation.json
Policy evaluation results
content.json
Package and file content listing
image-metadata.json
Image metadata (digest, distro, layers)
b) Centralized Mode
This method uses the “analyzer” pods in the Anchore Enterprise deployment to build the SBOM. This can create queuing if there are not enough analyzer processes, and this method will require the operator to provide ECR registry credentials in the Enterprise backend. This method may be preferred in cases where the Anchore Enterprise operator does not control the image build process (the analyzers can simply poll registries to look for new image builds as they are pushed), and this method also allows the operator to simply queue up the image for asynchronous scanning later if vulnerability and policy results are not required immediately. If the user wants malware scanning results from Anchore Enterprise’s clamav integration, the Centralized Scanning method is required.
To use centralized mode, replace the post_build commands in the buildspec above with the following. Note that --from docker is removed, so Anchore Enterprise will pull the image from the registry after it is pushed.
post_build:commands:### push the image first so Anchore Enterprise can pull it from the registry- docker push ${IMAGE_URI}### queue the image for scanning by Anchore Enterprise analyzers### --no-auto-subscribe prevents automatic re-scanning on future tag updates- | anchorectl image add ${IMAGE_URI} --no-auto-subscribe --wait --get all=./ \
--annotation "ci=aws-codepipeline" \
--annotation "repo=${IMAGE_REPO_NAME}" \
--annotation "commit=${CODEBUILD_RESOLVED_SOURCE_VERSION}" \
--annotation "commit_short=${IMAGE_TAG}" \
--annotation "pipeline=${CODEBUILD_INITIATOR}" \
--annotation "region=${AWS_REGION}"### evaluate the image against your Anchore Enterprise policy- anchorectl image check ${IMAGE_URI} --fail-based-on-results --detail- printf '[{"name":"app","imageUri":"%s"}]' "${IMAGE_URI}" > imagedefinitions.json
6. Create the CodePipeline
The pipeline has two stages: a Source stage that pulls from CodeCommit on each commit to the main branch, and a Build stage that runs the CodeBuild project.
When the pipeline completes, view the build results in the AWS Console under CodeBuild > Build history > select your build > Build logs. The logs will display the anchorectl output including vulnerability counts and policy evaluation results.
The scan artifacts (SBOMs, vulnerability report, policy evaluation) are stored as build artifacts in the S3 artifact bucket. You can download them from CodePipeline > select your pipeline > BuildOutput artifact, or directly from the S3 bucket.
4.2.2 - GitLab
Requirements
Anchore Enterprise is deployed in your environment, with the API accessible from your GitLab CI environment.
Credentials for your GitLab Container Registry are added to Anchore Enterprise, under the Anchore account that you intend to use with GitLab CI. See Container Registries. For information on what registry/credentials must be added to allow Anchore Enterprise to access your GitLab Container Registry, see https://docs.gitlab.com/ee/user/packages/container_registry/.
1. Configure Variables
Ensure that the following variables are set in your GitLab repository (settings -> CI/CD -> Variables -> Expand -> Add variable) or GitLab Group:
GitLab has a minimum length of 8 for masked variables. Please ensure both your username and password meet this requirement.
2. Create config file
Create a new file in your repository. Name the file .gitlab-ci.yml.
3. Configure scanning mode
a) Distributed Mode
This is the most easily scalable method for scanning images. Distributed scanning uses the anchorectl utility to build the SBOM directly on the build runner and then pushes the SBOM to Anchore Enterprise through the API. To use this scanning method, paste the following workflow script into your new .gitlab-ci.yml file. After building the image from your Dockerfile and scanning it with anchorectl, this workflow will display vulnerabilities and policy results in the build log. After pasting, click “Commit changes” to save the new file.
### Anchore Distributed Scan# you will need three variables defined:# ANCHORECTL_USERNAME# ANCHORECTL_PASSWORD# ANCHORECTL_URLimage:docker:latestservices:- docker:dindstages:- build- anchorevariables:### set this to true if you want the result of the policy check to determine whether the job succeeds or notANCHORECTL_FAIL_BASED_ON_RESULTS:"false"ANCHORE_IMAGE:${CI_REGISTRY_IMAGE}:${CI_COMMIT_REF_SLUG}Build:stage:buildscript:### build and push docker image- echo "$CI_REGISTRY_PASSWORD" | docker login $CI_REGISTRY -u $CI_REGISTRY_USER --password-stdin- docker build -t ${ANCHORE_IMAGE} .- docker push ${ANCHORE_IMAGE}Anchore:stage:anchorebefore_script:### install anchorectl binary- apk add --no-cache curl- 'curl "$ANCHORECTL_URL/v2/system/anchorectl?operating_system=linux&architecture=amd64" -H "accept: */*" | tar -zx anchorectl && mv -v anchorectl /usr/bin && chmod +x /usr/bin/anchorectl && /usr/bin/anchorectl version'- export PATH="${HOME}/.local/bin/:${PATH}"script:### provide registry credentials for anchorectl- export ANCHORECTL_REGISTRY_AUTH_AUTHORITY=$CI_REGISTRY- export ANCHORECTL_REGISTRY_AUTH_USERNAME="$CI_REGISTRY_USER"- export ANCHORECTL_REGISTRY_AUTH_PASSWORD="$CI_REGISTRY_PASSWORD"### scan image and push to anchore enterprise- anchorectl image add --no-auto-subscribe --wait --dockerfile ./Dockerfile --from registry ${ANCHORE_IMAGE}### then get the results:- anchorectl image vulnerabilities ${ANCHORE_IMAGE}- anchorectl image check --detail ${ANCHORE_IMAGE}
b) Centralized Mode
This method uses the “analyzer” pods in the Anchore Enterprise deployment to build the SBOM. This can create queuing if there are not enough analyzer processes, and this method will require the operator to provide registry credentials in the Enterprise backend (if the images to be scanned are in private registries). This method may be preferred in cases where the Anchore Enterprise operator does not control the image build process (the analyzers can simply poll registries to look for new image builds as they are pushed), and this method also allows the operator to simply queue up the image for asynchronous scanning later if vulnerability and policy results are not required immediately. If the user wants malware scanning results from Anchore Enterprise’s clamav integration, the Centralized Scanning method is required. To use this scanning method, paste the following workflow script into your new .gitlab-ci.yml file. After building the image from your Dockerfile,, this workflow will tell Anchore Enterprise to scan the image, then it will display the vulnerability and policy results in the build log. After pasting, click “Commit changes” to save the new file.
### Anchore Centralized Scan# you will need three variables defined:# ANCHORECTL_USERNAME# ANCHORECTL_PASSWORD# ANCHORECTL_URLimage:docker:latestservices:- docker:dindstages:- build- anchorevariables:ANCHORECTL_FAIL_BASED_ON_RESULTS:"false"ANCHORE_IMAGE:${CI_REGISTRY_IMAGE}:${CI_COMMIT_REF_SLUG}Build:stage:buildscript:### build and push docker image- echo "$CI_REGISTRY_PASSWORD" | docker login $CI_REGISTRY -u $CI_REGISTRY_USER --password-stdin- docker build -t ${ANCHORE_IMAGE} .- docker push ${ANCHORE_IMAGE}Anchore:stage:anchorebefore_script:### install anchorectl binary- apk add --no-cache curl- 'curl "$ANCHORECTL_URL/v2/system/anchorectl?operating_system=linux&architecture=amd64" -H "accept: */*" | tar -zx anchorectl && mv -v anchorectl /usr/bin && chmod +x /usr/bin/anchorectl && /usr/bin/anchorectl version'- export PATH="${HOME}/.local/bin/:${PATH}"script:### note that private registries will require registry credentials to be configured in your Anchore deployment### queue image for scanning- anchorectl image add --no-auto-subscribe --wait --dockerfile ./Dockerfile ${ANCHORE_IMAGE} ### then get the results:- anchorectl image vulnerabilities ${ANCHORE_IMAGE}- anchorectl image check --detail ${ANCHORE_IMAGE}
4. View pipeline
Gitlab will automatically start a pipeline. Navigate to “Build” -> “Pipelines” and then on your running pipeline.
5. View output
Once the build is complete, click on the “anchore” stage and view the output of the job. You will see the results of the vulnerability match and policy evaluation in the output.
4.2.3 - Azure Pipelines
Anchore Enterprise can be integrated into Azure DevOps pipelines to generate and analyze SBOMs, perform vulnerability scanning, and enforce policy evaluation as a pipeline gate. This page covers two integration approaches: distributed analysis and centralized analysis.
Prerequisites
The following are required for both integration approaches:
A running Anchore Enterprise instance. See Deployment for setup instructions.
An Azure DevOps pipeline.
An Azure Key Vault variable group named anchoreCredentials containing your Anchore Enterprise credentials. The following variables are required:
Variable
Description
anchore_url
The URL of your Anchore Enterprise instance
anchore_endpoint
The hostname of your Anchore Enterprise instance (used to download AnchoreCTL)
anchore_user
Your Anchore username, or _api_key if using an API key
anchore_pass
Your Anchore password or API key value
API keys are the recommended authentication method for CI/CD pipelines. They can be rotated and revoked independently of user accounts. See API Keys for setup instructions.
Distributed Analysis
In distributed analysis, AnchoreCTL generates the SBOM locally on the pipeline agent and uploads it to Anchore Enterprise for vulnerability matching and policy evaluation. The image is not required to be in a remote registry before scanning.
This is the recommended approach for most pipelines. It requires less infrastructure than centralized analysis and avoids the need for a staging registry.
Distributed analysis does not support malware scanning. If your workflow requires malware scanning via ClamAV, use Centralized Analysis instead.
How It Works
The anchorectl image add command accepts a --from flag that specifies the source from which AnchoreCTL should generate the SBOM:
--from docker:<image> — generates the SBOM from a locally available Docker image on the pipeline agent.
--from registry — pulls the image from a remote registry for local analysis. Use this when the image has already been pushed to a registry in a prior pipeline step, as it captures the registry-assigned digest, which remains consistent as the image moves through environments.
The first positional argument to image add is the tag Anchore Enterprise uses to identify the image in its database. This does not need to be a pullable registry path.
Distributed Pipeline
trigger:- masterresources:- repo:selfvariables:- name:imageRefvalue:'production/simpleserver:$(Build.BuildId)'- group:anchoreCredentialsstages:- stage:BuilddisplayName:Build stagejobs:- job:BuilddisplayName:Buildpool:vmImage:'ubuntu-latest'steps:- task:Docker@2displayName:Build imageinputs:command:buildrepository:simpleserverdockerfile:Dockerfiletags:| $(Build.BuildId)- stage:SecuritydisplayName:Security scan stagedependsOn:Buildjobs:- job:SecuritydisplayName:Securitypool:vmImage:'ubuntu-latest'steps:- script:curl -X GET "https://$(anchore_endpoint)/v2/system/anchorectl?operating_system=linux&architecture=amd64" -H "accept: */*" | tar -zx anchorectldisplayName:Install AnchoreCTL- script:| export PATH=$PATH:$HOME/.local/bin
export ANCHORECTL_URL=$(anchore_url)
export ANCHORECTL_USERNAME=$(anchore_user)
export ANCHORECTL_PASSWORD=$(anchore_pass)
# To authenticate with an API key instead:
# export ANCHORECTL_USERNAME=_api_key
# export ANCHORECTL_PASSWORD=$(api_token)
./anchorectl image add $(imageRef) --from docker:simpleserver:$(Build.BuildId) --dockerfile Dockerfile --wait
./anchorectl image vulnerabilities $(imageRef)
./anchorectl image check $(imageRef) --fail-based-on-resultsdisplayName:Anchore Security Scan- stage:ProductiondisplayName:Production stagedependsOn:Security# Push the image to your production registry and deploy
Centralized Analysis
In centralized analysis, the image is pushed to a staging registry and Anchore Enterprise pulls and analyzes it directly using the analyzer service. The SBOM is stored in Anchore Enterprise and available for post-scan reporting, compliance auditing, and policy justification.
This approach is required when malware scanning is enabled. See Malware Scanning for configuration details. Note that enabling malware scanning increases overall scan time.
Providing the Dockerfile via --dockerfile also enables Dockerfile-specific policy checks, such as validating the effective user ID or flagging exposed ports.
A staging registry. Images are pushed here before scanning and promoted to production only after passing policy evaluation. The example below provisions an Azure Container Registry using Terraform:
Note:admin_enabled = true enables the ACR built-in admin account, which uses a single shared credential and cannot be scoped or audited per consumer. For production use, set admin_enabled = false and grant access using a service principal or managed identity with the AcrPull and AcrPush roles as appropriate. See Azure Container Registry authentication options for details.
An Azure DevOps service connection. Required for the pipeline to push images to the staging registry. Configure a Docker Registry service connection targeting your Azure Container Registry. See Azure DevOps service connections for instructions.
Registry credentials in Anchore Enterprise. Anchore Enterprise must be able to pull images from the staging registry. See Container Registries for instructions.
Centralized Pipeline
trigger:- masterresources:- repo:selfvariables:- name:stagedImagevalue:'staging/simpleserver:$(Build.BuildId)'- name:productionImagevalue:'production/simpleserver:$(Build.BuildId)'- group:anchoreCredentialsstages:- stage:BuilddisplayName:Build and push to staging# Build and push the image to the staging registry- stage:SecuritydisplayName:Security scan stagedependsOn:Buildjobs:- job:SecuritydisplayName:Securitypool:vmImage:'ubuntu-latest'steps:- script:curl -X GET "https://$(anchore_endpoint)/v2/system/anchorectl?operating_system=linux&architecture=amd64" -H "accept: */*" | tar -zx anchorectldisplayName:Install AnchoreCTL- script:| export PATH=$PATH:$HOME/.local/bin
export ANCHORECTL_URL=$(anchore_url)
export ANCHORECTL_USERNAME=$(anchore_user)
export ANCHORECTL_PASSWORD=$(anchore_pass)
./anchorectl image add $(stagedImage) --dockerfile Dockerfile --wait
./anchorectl image vulnerabilities $(stagedImage)
./anchorectl image check $(stagedImage) --fail-based-on-resultsdisplayName:Anchore Security Scan- stage:ProductiondisplayName:Production stagedependsOn:Security# Push the image to your production registry and deploy
Failing a Pipeline on Policy Evaluation
The --fail-based-on-results flag (shorthand: -f) on anchorectl image check causes AnchoreCTL to return a non-zero exit code when the policy evaluation result is stop. This fails the pipeline stage and prevents the image from being promoted.
✔ Evaluated against policy [failed]Tag: docker.io/anchore/test_images:convertigo-7.9.2
Digest: sha256:b649023ebd9751db65d2f9934e3cfeeee54a010d4ba90ebaab736100a1c34d7d
Policy ID: anchore_secure_default
Last Evaluation: 2026-02-20T17:19:26Z
Evaluation: fail
Final Action: stop
Reason: policy_evaluation
error: 1 error occurred:
* failed policies:
One-Time Analysis
Anchore Enterprise supports one-time analysis, which performs vulnerability scanning and policy evaluation without storing the SBOM. This is useful for quick feedback during development before pushing to a registry.
Image Scanning can be easily integrated into your GitHub Actions pipeline using anchorectl.
1. Configure Variables
Ensure that the following variables/secrets are set in your GitHub repository (repository settings -> secrets and variables -> actions):
Variable ANCHORECTL_URL
Variable ANCHORECTL_USERNAME
Secret ANCHORECTL_PASSWORD
These are necessary for the integration to access your Anchore Enterprise deployment. The ANCHORECTL_PASSWORD value should be created as a repository secret to prevent exposure of the value in job logs, while ANCHORECTL_URL and ANCHORECTL_USERNAME can be created as repository variables.
2. Configure Permissions
(“Settings” -> “Actions” -> “General” -> “Workflow permissions”) select “Read and write permissions” and click “Save”.
3. Create config file
In your repository, create a new file ( “Add file” -> “Create new file”) and name it .github/workflows/anchorectl.yaml.
4. Set scanning mode
a) Distributed Mode
This is the most easily scalable method for scanning images. Distributed scanning uses the anchorectl utility to build the SBOM directly on the build runner and then pushes the SBOM to Anchore Enterprise through the API. To use this scanning method, paste the following workflow script into your new anchorectl.yaml file. After building the image from your Dockerfile and scanning it with anchorectl, this workflow will display vulnerabilities and policy results in the build log.
name:Anchore Enterprise Distributed Scanon:workflow_dispatch:inputs:mode:description:'On-Demand Build'env:ANCHORECTL_URL:${{ vars.ANCHORECTL_URL }}ANCHORECTL_USERNAME:${{ vars.ANCHORECTL_USERNAME }}ANCHORECTL_PASSWORD:${{ secrets.ANCHORECTL_PASSWORD }}## set ANCHORECTL_FAIL_BASED_ON_RESULTS to true if you want to break the pipeline based on the evaluationANCHORECTL_FAIL_BASED_ON_RESULTS:falseREGISTRY:ghcr.iojobs:Build:runs-on:ubuntu-lateststeps:- name:"Set IMAGE environmental variables"run:| echo "IMAGE=${REGISTRY}/${GITHUB_REPOSITORY}:${GITHUB_REF_NAME}" >> $GITHUB_ENV
- name:Checkout Codeuses:actions/checkout@v3- name:Log in to the Container registryuses:docker/login-action@v2with:registry:${{ env.REGISTRY }}username:${{ github.actor }}password:${{ secrets.GITHUB_TOKEN }} - name:Set up Docker Buildxuses:docker/setup-buildx-action@v2- name:build local containeruses:docker/build-push-action@v3with:tags:${{ env.IMAGE }}push:trueload:falseAnchore:runs-on:ubuntu-latestneeds:Buildsteps:- name:"Set IMAGE environmental variables"run:| echo "IMAGE=${REGISTRY}/${GITHUB_REPOSITORY}:${GITHUB_REF_NAME}" >> $GITHUB_ENV
- name:Checkout Code### only need to do this if you want to pass the dockerfile to Anchore during scanninguses:actions/checkout@v3- name:Install Latest anchorectl Binaryrun:| mkdir -p $HOME/.local/bin
curl -sSfL "${ANCHORECTL_URL}/v2/system/anchorectl?operating_system=linux&architecture=amd64" \
-H "accept: /" | tar -zx -C $HOME/.local/bin anchorectl
echo "$HOME/.local/bin" >> $GITHUB_PATH
- name:Generate SBOM and Push to Anchorerun:| anchorectl image add --no-auto-subscribe --wait --from registry --dockerfile Dockerfile ${IMAGE}- name:Pull Vulnerability Listrun:| anchorectl image vulnerabilities ${IMAGE}
- name:Pull Policy Evaluationrun:| # set "ANCHORECTL_FAIL_BASED_ON_RESULTS=true" (see above in the "env:" section) to break the pipeline here if the
# policy evaluation returns FAIL or add -f, --fail-based-on-results to this command for the same result
#
anchorectl image check --detail ${IMAGE}
b) Centralized Mode
This method uses the “analyzer” pods in the Anchore Enterprise deployment to build the SBOM. This can create queuing if there are not enough analyzer processes, and this method may require the operator to provide registry credentials in the Enterprise backend (if the images to be scanned are in private registries). This method may be preferred in cases where the Anchore Enterprise operator does not control the image build process (the analyzers can simply poll registries to look for new image builds as they are pushed), and this method also allows the operator to simply queue up the image for asynchronous scanning later if vulnerability and policy results are not required immediately. If the user wants malware scanning results from Anchore Enterprise’s clamav integration, the Centralized Scanning method is required. To use this scanning method, paste the following workflow script into your new anchorectl.yaml file. After building the image from your Dockerfile,, this workflow will tell Anchore Enterprise to scan the image, then it will display the vulnerability and policy results in the build log.
name:Anchore Enterprise Centralized Scanon:workflow_dispatch:inputs:mode:description:'On-Demand Build'env:ANCHORECTL_URL:${{ vars.ANCHORECTL_URL }}ANCHORECTL_USERNAME:${{ vars.ANCHORECTL_USERNAME }}ANCHORECTL_PASSWORD:${{ secrets.ANCHORECTL_PASSWORD }}## set ANCHORECTL_FAIL_BASED_ON_RESULTS to true if you want to break the pipeline based on the evaluationANCHORECTL_FAIL_BASED_ON_RESULTS:falseREGISTRY:ghcr.iojobs:Build:runs-on:ubuntu-lateststeps:- name:"Set IMAGE environmental variables"run:| echo "IMAGE=${REGISTRY}/${GITHUB_REPOSITORY}:${GITHUB_REF_NAME}" >> $GITHUB_ENV
- name:Checkout Codeuses:actions/checkout@v3- name:Log in to the Container registryuses:docker/login-action@v2with:registry:${{ env.REGISTRY }}username:${{ github.actor }}password:${{ secrets.GITHUB_TOKEN }} - name:Set up Docker Buildxuses:docker/setup-buildx-action@v2- name:build local containeruses:docker/build-push-action@v3with:tags:${{ env.IMAGE }}push:trueload:falseAnchore:runs-on:ubuntu-latestneeds:Buildsteps:- name:"Set IMAGE environmental variables"run:| echo "IMAGE=${REGISTRY}/${GITHUB_REPOSITORY}:${GITHUB_REF_NAME}" >> $GITHUB_ENV
- name:Checkout Codeuses:actions/checkout@v3- name:Install Latest anchorectl Binaryrun:| mkdir -p $HOME/.local/bin
curl -sSfL "${ANCHORECTL_URL}/v2/system/anchorectl?operating_system=linux&architecture=amd64" \
-H "accept: /" | tar -zx -C $HOME/.local/bin anchorectl
echo "$HOME/.local/bin" >> $GITHUB_PATH- name:Queue Image for Scanning by Anchore Enterpriserun:| anchorectl image add --no-auto-subscribe --wait --dockerfile ./Dockerfile ${IMAGE} - name:Pull Vulnerability Listrun:| anchorectl image vulnerabilities ${IMAGE}
- name:Pull Policy Evaluationrun:| # set "ANCHORECTL_FAIL_BASED_ON_RESULTS=true" (see above in the "env:" section) to break the pipeline here if the
# policy evaluation returns FAIL or add -f, --fail-based-on-results to this command for the same result
#
anchorectl image check --detail ${IMAGE}
5. Run Workflow
Go to “Actions” -> “Anchore Enterprise with anchorectl” and hit “Run workflow”.
6. View Results
When the workflow completes, view the results by clicking on the workflow name (“Anchore Enterprise with anchorectl”), then on the job (“Anchore”), then expand the “Pull Vulnerability List” and/or “Pull Policy Evaluation” steps to see the details.
7. Notifications
You can also integrate your Anchore Enterprise deployment with the GitHub API so that Anchore Enterprise notifications are sent to GitHub Notifications as new issues in a repository.
Before getting started, you need to configure your Jenkins instance with the required credentials. Make sure the following values are added under Dashboard → Manage Jenkins → Credentials as credentials of type Secret text:
These are necessary for the integration to access your Anchore Enterprise deployment. The ANCHORECTL_PASSWORD value should be created as a repository secret to prevent exposure of the value in job logs, while ANCHORECTL_URL and ANCHORECTL_USERNAME can be created as repository variables.
Configure scanning mode
Below are examples of the two types of image scans. For a detailed explanation of their differences, refer to the Images concept page.
a) Distributed
This is the most easily scalable method for scanning images. Distributed scanning uses the anchorectl utility to build the SBOM directly on the build runner and then pushes the SBOM to Anchore Enterprise through the API. The example below demonstrates how to automate distributed analysis within a pipeline.
pipeline {// Define parameters for user input
parameters { string(name:'REGISTRY',defaultValue:'docker.io',description:'The container registry to use.',trim:true) string(name:'REPOSITORY',defaultValue:'library/nginx',description:'The image repository path.',trim:true) string(name:'TAG',defaultValue:'latest',description:'The image tag to analyze.',trim:true) choice(name:'ANCHORECTL_QUIET',choices:['true','false'],description:'Suppress anchorectl informational messages.') choice(name:'ANCHORECTL_FORMAT',choices:['json','csv'],description:'The output format for anchorectl (e.g., json, csv).') choice(name:'ANCHORECTL_FAIL_BASED_ON_RESULTS',choices:['true','false'],description:'How to handle fail signals (e.g., policy check outcomes)')} stages { stage('Anchore Image Scan'){ environment {// This is the AnchoreCTL service endpoint (fetched securely from Jenkins credentials)
ANCHORECTL_URL = credentials('ANCHORECTL_URL')// Define the Anchore account username
ANCHORECTL_USERNAME = credentials('ANCHORECTL_USERNAME')// Define the Anchore account password
ANCHORECTL_PASSWORD = credentials('ANCHORECTL_PASSWORD')// Whether to fail the pipeline based on AnchoreCTL scan results (controlled by Jenkins parameter)
ANCHORECTL_FAIL_BASED_ON_RESULTS ="${params.ANCHORECTL_FAIL_BASED_ON_RESULTS}"// You can also choose to Suppress unnecessary output logs
ANCHORECTL_QUIET ="${params.ANCHORECTL_QUIET}"// Define the Output format for AnchoreCTL results
ANCHORECTL_FORMAT ="${params.ANCHORECTL_FORMAT}"} steps { script { echo 'Starting image analysis pipeline.'// Download and configure the Anchore CLI
sh '''
mkdir -p $HOME/.local/bin
curl -sSfL "${ANCHORECTL_URL}v2/system/anchorectl?operating_system=linux&architecture=amd64" \\
-H "accept: /" | tar -zx -C $HOME/.local/bin anchorectl
export PATH="$HOME/.local/bin:$PATH"
'''// Add the image to Anchore and wait for analysis to complete
sh "anchorectl image add --wait --from registry ${params.REGISTRY}/${params.REPOSITORY}:${params.TAG}"// Retrieve and archive vulnerability report
sh "anchorectl image vulnerabilities ${params.REGISTRY}/${params.REPOSITORY}:${params.TAG} | tee vulnerabilities.${ANCHORECTL_FORMAT}" archiveArtifacts artifacts:"vulnerabilities.${env.ANCHORECTL_FORMAT}"// Run and archive the policy check
sh """#!/bin/bash
set -o pipefail
anchorectl image check --detail ${params.REGISTRY}/${params.REPOSITORY}:${params.TAG} | tee policy-check.${ANCHORECTL_FORMAT}
""" archiveArtifacts artifacts:"policy-check.${env.ANCHORECTL_FORMAT}"// Post-build action to handle policy failure, if configured
if(env.ANCHORECTL_FAIL_BASED_ON_RESULTS =='true'){def policyCheckResult = sh(script:"grep -q 'Policy Evaluation: PASS' policy-check.${ANCHORECTL_FORMAT}",returnStatus:true)if(policyCheckResult !=0){ error('Policy check failed based on results.')}}}}}}}
b) Centralized
Centralized Scanning uses analyzer pods in Anchore Enterprise to generate the SBOM. This method is ideal when the operator does not control the image build process, supports asynchronous scanning, and is required for malware detection through ClamAV. After your container image is built, you can trigger a scan by adding the provided stage to your pipeline, which will instruct Anchore Enterprise to analyze the image and display vulnerability and policy results in the build log. Below is an example of how to achieve centralized scanning in your pipeline
pipeline {// Define parameters for user input
parameters { string(name:'REGISTRY',defaultValue:'docker.io',description:'The container registry to use.',trim:true) string(name:'REPOSITORY',defaultValue:'library/nginx',description:'The image repository path.',trim:true) string(name:'TAG',defaultValue:'latest',description:'The image tag to analyze.',trim:true) choice(name:'ANCHORECTL_QUIET',choices:['true','false'],description:'Suppress anchorectl informational messages.') choice(name:'ANCHORECTL_FORMAT',choices:['json','csv'],description:'The output format for anchorectl (e.g., json, csv).') choice(name:'ANCHORECTL_FAIL_BASED_ON_RESULTS',choices:['true','false'],description:'How to handle fail signals (e.g., policy check outcomes)')} stages { stage('Anchore Image Scan'){ environment {// This is the AnchoreCTL service endpoint (fetched securely from Jenkins credentials)
ANCHORECTL_URL = credentials('ANCHORECTL_URL')// Define the Anchore account username
ANCHORECTL_USERNAME = credentials('ANCHORECTL_USERNAME')// Define the Anchore account password
ANCHORECTL_PASSWORD = credentials('ANCHORECTL_PASSWORD')// Whether to fail the pipeline based on AnchoreCTL scan results (controlled by Jenkins parameter)
ANCHORECTL_FAIL_BASED_ON_RESULTS ="${params.ANCHORECTL_FAIL_BASED_ON_RESULTS}"// You can also choose to Suppress unnecessary output logs
ANCHORECTL_QUIET ="${params.ANCHORECTL_QUIET}"// Define the Output format for AnchoreCTL results
ANCHORECTL_FORMAT ="${params.ANCHORECTL_FORMAT}"} steps { script { echo "Starting image analysis for: ${params.REGISTRY}/${params.REPOSITORY}:${params.TAG}"// Download and configure the Anchore CLI
sh '''
mkdir -p $HOME/.local/bin
curl -sSfL "${ANCHORECTL_URL}v2/system/anchorectl?operating_system=linux&architecture=amd64" \\
-H "accept: /" | tar -zx -C $HOME/.local/bin anchorectl
export PATH="$HOME/.local/bin:$PATH"
'''// Add the image to Anchore and wait for analysis to complete
sh "anchorectl image add --wait ${params.REGISTRY}/${params.REPOSITORY}:${params.TAG}"// Retrieve and archive vulnerability report
sh "anchorectl image vulnerabilities ${params.REGISTRY}/${params.REPOSITORY}:${params.TAG} | tee vulnerabilities.${ANCHORECTL_FORMAT}" archiveArtifacts artifacts:"vulnerabilities.${env.ANCHORECTL_FORMAT}"// Run and archive the policy check
sh """#!/bin/bash
set -o pipefail
anchorectl image check --detail ${params.REGISTRY}/${params.REPOSITORY}:${params.TAG} | tee policy-check.${ANCHORECTL_FORMAT}
""" archiveArtifacts artifacts:"policy-check.${env.ANCHORECTL_FORMAT}"// Post-build action to handle policy failure, if configured
if(env.ANCHORECTL_FAIL_BASED_ON_RESULTS =='true'){def policyCheckResult = sh(script:"grep -q 'Policy Evaluation: PASS' policy-check.${ANCHORECTL_FORMAT}",returnStatus:true)if(policyCheckResult !=0){ error('Policy check failed based on results.')}}}}}}}
Visualize Vulnerabilities with the Warnings NG Plugin
The Jenkins Warnings Next Generation plugin (warnings-ng) can parse anchorectl vulnerability output and surface findings as tracked issues directly in the Jenkins UI — complete with trend graphs, per-build issue counts, and configurable quality gates.
Prerequisites
Jenkins Warnings Next Generation plugin installed (Manage Jenkins → Plugins → Available plugins, search for “Warnings Next Generation”)
Vulnerability report (snake_case keys) from a previously analyzed image
a) One-Time Scan
Use anchorectl image one-time-scan to analyze an image against Anchore Enterprise policies without adding it to the image inventory.
pipeline { agent any
stages { stage('Anchore One-Time Scan'){ environment { ANCHORECTL_URL = credentials('ANCHORECTL_URL') ANCHORECTL_USERNAME = credentials('ANCHORECTL_USERNAME') ANCHORECTL_PASSWORD = credentials('ANCHORECTL_PASSWORD')} steps { script { sh '''
mkdir -p $HOME/.local/bin
curl -sSfL "${ANCHORECTL_URL}v2/system/anchorectl?operating_system=linux&architecture=amd64" \
-H "accept: /" | tar -zx -C $HOME/.local/bin anchorectl
export PATH="$HOME/.local/bin:$PATH"
''' sh 'anchorectl image one-time-scan -o json docker.io/library/nginx:latest | tee vulnerabilities.json'}}}} post { always { recordIssues(tools:[anchoreCtl()])}}}
b) Image Add and Vulnerabilities
Use anchorectl image add to submit an image to Anchore Enterprise for centralized analysis. Once analysis is complete, retrieve the vulnerability report with anchorectl image vulnerabilities and save it to a file the plugin can detect.
Anchore severity levels are mapped to Jenkins issue severities as follows:
Anchore Severity
Jenkins Severity
Critical
ERROR
High
WARNING_HIGH
Medium
WARNING_NORMAL
Low, Negligible
WARNING_LOW
To fail the build when a severity threshold is exceeded, add a qualityGates parameter to the recordIssues step. See the Warnings NG plugin documentation for details.
Kubernetes can be configured to use an Admission Controller to validate that the container image is compliant with the user’s policy before allowing or preventing deployment.
Anchore Enterprise can be integrated with Kubernetes to ensure that only certified images are started within a cluster. The admission controller can be configured to make a webhook call into Anchore Enterprise. Anchore Enterprise exports a Kubernetes-specific API endpoint and will return the pass or fail response in the form of an ImageReview response. This approach allows the Kubernetes system to make the final decision on running a container image and does not require installation of any per-node plugins into Kubernetes.
Using native Kubernetes features allows the admission controller approach to be used in both on-prem and cloud-hosted Kubernetes environments.
Getting Started
Full information on installation and configuration of the Anchore Kubernetes Admission Controller can be found here.
The Anchore Kubernetes Admission Controller is a licensed add-on, please make sure you have a valid runtime license entitlement.
Modes of Operation
The Anchore admission controller supports 3 different modes of operation allowing you to tune the tradeoff between control and intrusiveness for your environments.
Strict Policy-Based Admission Gating Mode
This is the strictest mode, and will admit only images that are already analyzed by Anchore Enterprise and receive a “pass” on policy evaluation. This enables you to ensure, for example, that no image is deployed into the cluster that has a known high-severity CVE with an available fix, or any of several other conditions. The Anchore Enterprise policy language supports sophisticated conditions on the properties of images, vulnerabilities, and metadata.
Analysis-Based Admission Gating Mode
Admit only images that are analyzed and known to Anchore, but do not execute or require a policy evaluation. This is useful in cases where you’d like to enforce requirement that all images be deployed via a CI/CD pipeline, for example, that itself manages the image scanning with Anchore, but allowing the CI/CD process to determine what should run based on other factors outside the context of the image or k8s itself.
Passive Analysis Trigger Mode
Trigger an Anchore analysis of images, but to no block execution on analysis completion or policy evaluation of the image. This is a way to ensure that all images that make it to deployment (test, staging, or prod) are guaranteed to have some form of analysis audit trail available and a presence in reports and notifications that are managed by Anchore. Image records in Anchore are given an annotation of “requestor=anchore-admission-controller” to help track their provenance.
4.3.2 - Kubernetes Runtime Inventory
Overview
The Anchore Kubernetes Inventory Agent is a licensed add-on, please make sure you have a valid runtime license entitlement.
Using Anchore’s runtime inventory agents provides Anchore Enterprise access to what images are being used
in your deployments. This can help give insight into where vulnerabilities or policy violations are in your
production workloads.
Anchore uses a go binary called anchore-k8s-inventory that leverages the Kubernetes Go SDK
to reach out and list containers in a configurable set of namespaces to determine which images are running.
anchore-k8s-inventory can be deployed via its helm chart, embedded within your Kubernetes cluster as an agent. It will require access to the Anchore Enterprise API.
General Runtime Configuration
Getting Started
The most common way to track inventory is to install anchore-k8s-inventory as an agent in your cluster. To do this you will need to configure credentials
and information about your deployment in the values file. It is recommended to first configure a specific robot user
for the account where you’ll want to track your Kubernetes inventory.
As an agent anchore-k8s-inventory is installed using helm and the helm chart is hosted as part of the https://charts.anchore.io repo.
It is based on the anchore/k8s-inventory docker image.
To install the helm chart, follow these steps:
Configure your username, password, Anchore account, Anchore URL and cluster name in the values file.
k8sInventory:# Path should not be changed, cluster value is used to tell Anchore which cluster this inventory is coming fromkubeconfig:cluster:<unique-name-for-your-cluster>anchoreRegistration:#RegistrationId: ""IntegrationName:"<unique-name-for-your-cluster>"IntegrationDescription:""anchore:url:<URL for your># Note: recommend using the inventory-agent roleuser:<user>password:<password>account:<account>
Run helm install in the cluster(s) you wish to track
anchore-k8s-inventory must be able to resolve the Anchore URL and requires API credentials. Review the anchore-k8s-inventory logs if you are not able to see the inventory results in the UI.
Note: the Anchore Enterprise API Password can be provided via a Kubernetes secret, or injected into the environment of the anchore-k8s-inventory container
For injecting the environment variable, see: injectSecretsViaEnv
For providing your own secret for the Anchore Enterprise API Password, see: useExistingSecret. K8s Inventory creates it’s own secret based on your values.yaml file for key k8sInventory.anchore.password, but the k8sInventory.useExistingSecret key allows you to create your own secret and provide it in the values file. See the K8s Inventory repo for more information about the K8s Inventory specific configuration
Usage
To verify that you are tracking Kubernetes Inventory you can access inventory results with the command anchorectl inventory list and look for results where the TYPE is kubernetes.
The UI also displays the Kubernetes Inventory and allows operators to visually navigate the images, vulnerability results, and see the results of the policy evaluation.
For more details about watching clusters, and reviewing policy results see the Using Kubernetes Inventory section.
Inventory Time-To-Live
As part of reporting on your runtime environment, Anchore Enterprise maintains an active record of the containers, the images they run,
and other related metadata based on time they were last reported by an inventory agent.
The configuration setting below allow you to specify how long inventory should remain part of the Catalog Service’s working set.
These are the default settings found in the values file.
For each cluster/namespace reported from the inventory agent, the system will delete any previously reported
containers and images and replace it with the new inventory.
Note: The inventory_ttl_days is still needed to remove any cluster/namespaces that are no longer reported as well as
some of the supporting metadata (ie. pods, nodes). This value should be configured to be long enough that inventory isn’t incorrectly removed in case of an outage from the reporting agent.
The exact value depends on each deployment, but 7 days is a reasonable value here.
This will delete any container and image that has not been reported by an agent in the last 14 days. This includes its supporting metadata (ie. pods, nodes).
This will keep any containers, images, and supporting metadata reported by an inventory agent indefinitely.
Deleting Inventory via API
Where it is not desirable to wait for the Image TTL to remove runtime inventory images it is possible to manually delete inventory items via the API by issuing a DELETE to /v2/inventories with the following query parameters.
inventory_type (required) - either ecs or kubernetes
context (required) - it must match a context as seen by the output of anchorectl inventory list
Kubernetes - this is a combination of cluster name (as defined by the anchore-k8s-inventory config) and a namespace containing running containers e.g. cluster1/default.
ECS - this is the cluster ARN e.g. arn:aws:ecs:eu-west-2:123456789012:cluster/myclustername
image_digest (optional) - set if you only want to remove a specific image
e.g. DELETE /v2/inventories?inventory_type=<string>&context=<string>&image_digest=<string>
Using curl: curl -X DELETE -u username:password "http://<servername:port>/v2/inventories?inventory_type=&context=&image_digest=
Agents
Anchore Enterprise provides agents for collecting the inventory of different container runtime environments:
Anchore uses a go binary called anchore-ecs-inventory that leverages the AWS Go SDK
to gather an inventory of containers and their images running on Amazon ECS and report back to Anchore Enterprise.
The Amazon ECS Inventory Agent can be installed via Helm Chart or as an ECS Service on AWS Fargate.
The Anchore Amazon ECS Inventory Agent is a licensed add-on, please make sure you have a valid runtime license entitlement.
Deploying via Helm on Kubernetes
You can install the chart via the Anchore Enterprise repository:
Follow the AWS instructions found here to assign your IAM role to a Kubernetes service account in your cluster where the Anchore ECS Inventory Agent will be running. Then configure the following in your values.yaml to ensure the agent has access to the ECS service API:
serviceAccountName:"service_account_name"
Using existing secrets
For those users unable to use IAM roles (e.g. the ECS Inventory Agent is not running on Kubernetes or ECS), the (ecsInventory.useExistingSecret and ecsInventory.existingSecretName) or ecsInventory.injectSecretsViaEnv keys allows you to create your own secret and provide it in the values file or place the required secret into the pod via different means such as injecting the secrets into the pod using hashicorp vault. For example:
You can deploy the ecs-inventory container as an ECS Service on AWS Fargate. Running the agent as a service ensures that ECS automatically restarts the task if it stops, maintaining continuous inventory reporting to Anchore Enterprise.
Deploying as an ECS Service is recommended over running a standalone task. A service maintains the desired task count and automatically replaces unhealthy tasks, ensuring uninterrupted inventory collection.
Set Environment Variables
Set the following environment variables before running the commands below. Replace the placeholder values with your own.
The security group must allow outbound access to your Anchore Enterprise deployment. No inbound rules are required as the agent only makes outbound connections.
Create IAM Roles and Policies
Create the IAM policy, roles, and permissions required by the ECS task.
To verify that you are tracking Amazon ECS inventory in your Anchore Enterprise deployment you can access inventory results with the command anchorectl inventory list and look for results where the TYPE is ecs.
Auto analyze new inventory
It is possible to create a subscription to watch for new Amazon ECS inventory that is reported to Anchore Enterprise and automatically schedule those images for
analysis. The subscription_key can be set to any part of an Amazon ECS ClusterARN. For example setting the subscription_key to the:
full ClusterARN arn:aws:ecs:us-east-1:012345678910:cluster/telemetry will create a subscription that only watches this cluster
partial ClusterARN arn:aws:ecs:eu-west-2:988505687240 will result in a subscription that watches every cluster within the account 988505687240
All ECS clusters arn:aws:ecs effectively auto-subscribes all ECS runtime agents.
For AWS GovCloud regions, the ARN partition is aws-us-gov instead of aws. For example, use arn:aws-us-gov:ecs to subscribe to all GovCloud ECS clusters, or arn:aws-us-gov:ecs:us-gov-west-1:012345678910:cluster/telemetry for a specific cluster.
This documentation serves as a comprehensive reference for integrating Anchore Enterprise with ServiceNow’s Container Vulnerability Response (CVR) module. This integration enables organizations to “hydrate” ServiceNow with Anchore security data, allowing teams to utilize their established vulnerability grouping, reporting, and remediation workflows for containerized assets.
Overview and Release Information
Anchore provides a dedicated plugin that bridges the gap between Anchore Enterprise scans and ServiceNow Security Operations (SecOps).
Availability: Accessible via GitHub for licensed Anchore customers. Version Support: Anchore Enterprise v5.x and later. Source Code:https://github.com/anchore/servicenow (private)
Anchore SNOW Integrations
Anchore currently focuses on the Security Operations (SecOps) side of the ServiceNow platform:
ServiceNow Container Vulnerability Response (CVR) Vulnerabilities identified in container images are pulled into ServiceNow CVR via the Anchore CVR plugin.
ServiceNow IT Service Management (ITSM) Anchore does not currently provide a native SNOW ITSM integration for automatic ticket generation.
Installation and Setup
Prerequisites
Ensure the following ServiceNow applications are active before installation:
Vulnerability Response
Vulnerability Response and Configuration Compliance for Containers
Vulnerability Response Integration with NVD
Deployment Steps
The integration is installed directly from GitHub into the ServiceNow Studio application:
Select Import from Source Control
URL: https://github.com/anchore/servicenow/
Branch: snow_import (fully bundled application)
Credentials:
Create a GitHub Personal Access Token
In ServiceNow, navigate to Connections & Credentials > Credentials
DefectDojo is an open source application vulnerability management platform that streamlines the handling of security findings from various tools, including seamless integration with Anchore Enterprise.
Anchore Enterprise vulnerability and policy reports, whether obtained through the UI or using anchorectl, can be seamlessly parsed and imported into DefectDojo for centralized vulnerability management.
Importing Anchore Enterprise analysis Data into DefectDojo
Data from Anchore Enterprise can be ingested into DefectDojo in a number of ways:
The upload of vulnerability or policy reports obtained via the Anchore Enterprise GUI
The upload of vulnerability or policy reports obtained via anchorectl
By utilizing the Anchore Enterprise API to automatical pull vulnerability and policy reports from Anchore Enterprise
Downloaded reports from Anchore Enterprise GUI or anchorectl can be uploaded to DefectDojo by selecting the appropriate parser during the import process. For more details on available DefectDojo and Anchore parsers, see: DefectDojo Integration.
Downloading Vulnerability report from Anchore Enterprise GUI
To download vulnerability report data from Anchore Enterprise GUI
Click on the “Images” icon
Select the image tag for which you want to download the vulnerability data.
Now navigate to the “Vulnerabilities” section, Click on “Vulnerability Report” to download the report.
Download the report in JSON format, then proceed to import it into DefectDojo.
Downloading Vulnerability and Policy report via anchorectl
To download vulnerability report using anchorectl run the following:
For more details on how to automate this process using DefectDojo API, see: DefectDojo API usage.
4.7 - Data Stream
Overview
The Anchore Data Stream provides a mechanism to stream security data from Anchore Enterprise to external systems
for further processing, analysis, and long-term storage. As image vulnerability scans and policy evaluations occur
within Anchore Enterprise, the data is captured and written to files. These files are monitored by a sidecar
service (such as Fluent Bit). The sidecar service reads the data from the files and forwards the events
to external destinations like Splunk, Elasticsearch, or other SIEM platforms.
This feature enables you to integrate:
Real-time Security Monitoring: Stream vulnerability discoveries and policy violations as they occur
Centralized Log Management: Aggregate Anchore Enterprise security data with other infrastructure logs
Custom Dashboards: Build security dashboards in your preferred analytics platform
Compliance Reporting: Maintain audit trails of security events for compliance requirements
Alerting Integration: Trigger alerts based on critical vulnerability discoveries or policy failures
Architecture
The data streaming pipeline consists of three components:
Anchore Enterprise (Reports Worker) → Data Event Files → Fluent Bit Sidecar → External Destination
Reports Worker: Security data to NDJSON (newline-delimited JSON) files
Data Event Files: Rotating log files stored on a shared volume, with automatic cleanup of processed files
Fluent Bit: A lightweight log forwarder that tails the data event files and forwards them to your destination
Data Event Types
The following system data events are streamed:
Data Event Type
Description
Image Vulnerability Scan Results
Changes to the vulnerability scan results including CVE IDs, severity, fix availability, and affected packages
Image Policy Evaluation Findings
Changes to the policy evaluation results including pass/fail status, triggered gates, and findings
The Data Event Stream feature is configured through the Anchore Enterprise configuration file or Helm values. This page covers the configuration options for enabling event streaming and customizing its behavior.
Prerequisites
Before enabling the event stream:
Ensure you have a valid license with the Data Stream entitlement
Plan your shared volume strategy for the data event files. Maximum file size and count will impact storage requirements.
Determine your destination system (Splunk, Elasticsearch, etc.)
Configuration
Ports
Component
Port
Purpose
Fluent Bit Health
2020
Health checks and metrics endpoint
(example) Splunk HEC
8088
HTTP Event Collector ingestion
Shard Data Files
Path
Description
/var/log/anchore/events/
Default directory for data event files
/var/log/anchore/events/events.json.*
Rotating data event files (timestamped)
/var/log/anchore/events/offsets.db
Fluent Bit file position tracking database
Helm Values (Kubernetes)
To enable event streaming in a Kubernetes deployment using Helm, add the following to your values.yaml:
The event_stream_health cycle timer must be configured for proper operation. Without it processed files will not be cleaned up.
Volume Configuration
The Reports Worker and the Fluent Bit sidecar must have read/write access to the data event directory.
Kubernetes
Create a shared volume between the Reports Worker and Fluent Bit:
# In your Helm values or deployment manifestvolumes:- name:anchore-eventsemptyDir:{}# Reports Worker containervolumeMounts:- name:anchore-eventsmountPath:/var/log/anchore# Fluent Bit containervolumeMounts:- name:anchore-eventsmountPath:/var/log/anchore
Data event files are rotated based on the max_file_size_mb setting. When a file reaches the maximum size, a new file
is created with a timestamp suffix:
The max_file_count setting determines how many files are retained. Older files are deleted after they have been
processed by Fluent Bit (tracked via the position database).
Health Monitoring
The data stream health watcher runs at the interval specified by event_stream_health and performs the following tasks:
Cleanup: Removes event files that have been fully processed by Fluent Bit
Emitter Resume Detection: Detects when the data_stream has been suspended and allows it to resumes processing when possible
Viewing Integration Status
The system event notification system provides events related to the data stream health. You can view these events via the API or UI.
Filter on event type system.event_stream.suspend and system.event_stream.resume to see suspension and resumption events.
Verification
After enabling event streaming, verify it is working:
Step 1: Analyze an Image
Analyze a new image to generate vulnerability and policy events:
Step 2: Check Data Event Files
You should see one or more event files with the pattern events.json.*.
Examples below:
# Kuberneteskubectl exec -it <reports-worker-pod> -- ls -la /var/log/anchore/events/
Defaulted container "enterprise-reportsworker" out of: enterprise-reportsworker, fluent-bit (init)total 51680drwxrwsrwx. 2 root anchore 104 Jan 10 18:17 .
drwxrwxr-x. 1 anchore root 113 Jan 10 15:15 ..
-rw-r--r--. 1 anchore anchore 35440931 Jan 10 18:41 events.json.20260110T181643Z
-rw-r--r--. 1 anchore anchore 8192 Jan 10 18:02 offsets.db
-rw-r--r--. 1 anchore anchore 32768 Jan 10 18:41 offsets.db-shm
-rw-r--r--. 1 anchore anchore 4120032 Jan 10 18:41 offsets.db-wal
# Dockerdocker exec <reports-worker-container> ls -la /var/log/anchore/events/
total 5092drwxr-xr-x 2 root root 4096 Jan 10 18:29 .
drwxrwxr-x 3 anchore root 4096 Jan 10 15:21 ..
-rw-r--r-- 1 root root 5163541 Jan 10 15:26 events.json.20260110T152612Z
-rw-r--r-- 1 root root 8192 Jan 10 17:53 offsets.db
-rw-r--r-- 1 root root 32768 Jan 10 18:29 offsets.db-shm
-rw-r--r-- 1 root root 0 Jan 10 18:29 offsets.db-wal
****
Troubleshooting
No Event Files Created
Verify enabled: true is set in the configuration
Check that the Reports Worker has write permissions to the directory
Ensure the event_stream_health cycle timer is configured
Check Reports Worker logs for errors
Events Not Being Processed
Verify Fluent Bit is running and can read the event files
Check the position database (offsets.db) exists and is being updated
Review Fluent Bit logs for connection or parsing errors
Data Stream is Suspended
If the data stream becomes suspended due to unprocessed files accumulating, consider:
Increase max_file_size_mb to buffer more date and allow fluent bit to catch up
Increase max_file_count to retain more files during high-volume periods
Ensure Fluent Bit is keeping up with event production
Fluent Bit is a lightweight, high-performance log processor and forwarder that serves as the bridge between Anchore Enterprise
Enterprise event files and your destination system. This guide covers deploying Fluent Bit as a sidecar container to
forward events to external systems.
Add a Fluent Bit sidecar to your Anchore Enterprise deployment by modifying your Helm values:
reportsWorker:extraVolumes:- name:anchore-eventsemptyDir:{}- name:fluent-bit-configconfigMap:name:fluent-bit-configdefaultMode:0644# A LUA script can be added for ETL but the script is not provided#- name: fluent-bit-lua-helpers# configMap:# name: fluent-bit-lua-helpers# defaultMode: 0644extraVolumeMounts:- name:anchore-eventsmountPath:/var/log/anchore/eventsinitContainers:- name:fluent-bitimage:fluent/fluent-bit:latestimagePullPolicy:IfNotPresentrestartPolicy:Alwaysports:- containerPort:2020name:metricsprotocol:TCPvolumeMounts:- name:fluent-bit-configmountPath:/fluent-bit/etc/fluent-bit.confsubPath:fluent-bit.confreadOnly:true- name:fluent-bit-configmountPath:/fluent-bit/etc/parsers.confsubPath:parsers.confreadOnly:true# A LUA script can be added for ETL but the script is not provided#- name: fluent-bit-lua-helpers# mountPath: /fluent-bit/etc/anchore_helpers.lua# subPath: anchore_helpers.lua- name:anchore-eventsmountPath:/var/log/anchore/events
Create a ConfigMap for Fluent Bit configuration:
apiVersion:v1kind:ConfigMapmetadata:name:fluent-bit-configdata:fluent-bit.conf:| [SERVICE]
Flush 1
Daemon Off
Log_Level info
Parsers_File parsers.conf
HTTP_Server On
HTTP_Listen 0.0.0.0
HTTP_Port 2020
[INPUT]
Name tail
Path /var/log/anchore/events/events.json.*
Tag anchore.events
Parser json
DB /var/log/anchore/events/offsets.db
Mem_Buf_Limit 64MB
Buffer_Chunk_Size 32MB
Buffer_Max_Size 64MB
Skip_Long_Lines Off
Refresh_Interval 10
Rotate_Wait 5
Read_from_Head On
[FILTER]
Name modify
Match anchore.events
Add anchore_service reports_worker
# A LUA script can be added for ETL but the script is not provided
#[FILTER]
# Name lua
# Match anchore.events
# Script /fluent-bit/etc/anchore_helpers.lua
# Call split_and_wrap
[OUTPUT]
Name splunk
Match anchore.events
Host ${SPLUNK_HEC_HOST}
Port ${SPLUNK_HEC_PORT}
TLS On
TLS.Verify On
Splunk_Token ${SPLUNK_HEC_TOKEN}
Splunk_Send_Raw Off
Event_Host anchore-enterprise
Event_Sourcetype anchore:events
Retry_Limit 5parsers.conf:| [PARSER]
Name json
Format json
Time_Key timestamp
Time_Format %Y-%m-%dT%H:%M:%S.%LZ
Time_Keep On
Docker Compose
Add Fluent Bit to your Docker Compose configuration:
Create the configuration files in a fluent-bit/ directory:
fluent-bit/fluent-bit.conf:
[SERVICE]
    Flush           1
    Daemon          Off
    Log_Level       info
    Parsers_File    parsers.conf
    HTTP_Server     On
    HTTP_Listen     0.0.0.0
    HTTP_Port       2020

[INPUT]
    Name            tail
    Path            /var/log/anchore/events/events.json.*
    Tag             anchore.events
    Parser          json
    DB              /var/log/anchore/events/offsets.db
    Mem_Buf_Limit   64MB
    Buffer_Chunk_Size 32MB
    Buffer_Max_Size 64MB
    Skip_Long_Lines Off
    Refresh_Interval 10
    Rotate_Wait     5
    Read_from_Head  On

[FILTER]
    Name            modify
    Match           anchore.events
    Add             anchore_service reports_worker

[OUTPUT]
    Name            splunk
    Match           anchore.events
    Host            ${SPLUNK_HEC_HOST}
    Port            ${SPLUNK_HEC_PORT}
    TLS             On
    TLS.Verify      On
    Splunk_Token    ${SPLUNK_HEC_TOKEN}
    Splunk_Send_Raw Off
    Event_Host      anchore-enterprise
    Event_Sourcetype anchore:events
    Retry_Limit     5
fluent-bit/parsers.conf:
[PARSER]
    Name        json
    Format      json
    Time_Key    timestamp
    Time_Format %Y-%m-%dT%H:%M:%S.%LZ
    Time_Keep   On
Configuration Reference
Input Configuration
The tail input plugin monitors event files and tracks read positions:
Parameter
Value
Description
Name
tail
Use the tail input plugin
Path
/var/log/anchore/events/events.json.*
Pattern matching event files
Tag
anchore.events
Tag for routing to outputs
Parser
json
Parse each line as JSON
DB
/var/log/anchore/events/offsets.db
SQLite database for position tracking
Mem_Buf_Limit
64MB
Memory buffer limit
Buffer_Chunk_Size
32MB
Buffer chunk size for reading
Buffer_Max_Size
64MB
Maximum buffer size per file
Read_from_Head
On
Read from beginning for new files
Refresh_Interval
10
Seconds between file checks
Rotate_Wait
5
Seconds to wait before processing rotated files
Buffer Sizing
Vulnerability reports can be large (10-100+ KB per event). The buffer settings should accommodate your largest expected events:
Event Type
Typical Size
Recommended Buffer
Vulnerability Report (few CVEs)
10-50 KB
32 MB
Vulnerability Report (many CVEs)
100-500 KB
64 MB
Vulnerability Report (large image)
500 KB - 2 MB
128 MB
Policy Evaluation
5-20 KB
32 MB
For large images with many vulnerabilities, increase the buffer settings:
[OUTPUT]
    Name            splunk
    Match           anchore.events
    Host            ${SPLUNK_HEC_HOST}
    Port            ${SPLUNK_HEC_PORT}
    TLS             On
    TLS.Verify      On
    Splunk_Token    ${SPLUNK_HEC_TOKEN}
Elasticsearch
[OUTPUT]
    Name            es
    Match           anchore.events
    Host            elasticsearch.example.com
    Port            9200
    Index           anchore-events
    Type            _doc
    TLS             On
    TLS.Verify      On
    HTTP_User       ${ES_USER}
    HTTP_Passwd     ${ES_PASSWORD}
HTTP (Generic Webhook)
[OUTPUT]
    Name            http
    Match           anchore.events
    Host            webhook.example.com
    Port            443
    URI             /api/events
    Format          json
    TLS             On
    TLS.Verify      On
    Header          Authorization Bearer ${API_TOKEN}
Stdout (Debugging)
For troubleshooting, add stdout output to see events in container logs:
[OUTPUT]
    Name            stdout
    Match           anchore.events
    Format          json_lines
Filtering and Transformation
Adding Metadata
Add custom fields to all events:
[FILTER]
    Name            modify
    Match           anchore.events
    Add             environment production
    Add             cluster_name my-cluster
    Add             anchore_service reports_worker
Filtering by Event Type
Route different event types to different outputs:
[FILTER]
    Name            rewrite_tag
    Match           anchore.events
    Rule            $event ^(image\.vulnerability_report)$ vuln.$1 false
    Rule            $event ^(tag\.policy_evaluation)$ policy.$1 false

[OUTPUT]
    Name            splunk
    Match           vuln.*
    Host            ${SPLUNK_HEC_HOST}
    Splunk_Token    ${VULN_TOKEN}
    Event_Index     vulnerabilities

[OUTPUT]
    Name            splunk
    Match           policy.*
    Host            ${SPLUNK_HEC_HOST}
    Splunk_Token    ${POLICY_TOKEN}
    Event_Index     policy_evaluations
This guide covers integrating Anchore Enterprise data streaming with Splunk using the HTTP Event Collector (HEC). Once configured, vulnerability reports and policy evaluations will flow into Splunk for search, alerting, and dashboard visualization.
Configure Fluent Bit to forward events to Splunk HEC:
[OUTPUT]
    Name            splunk
    Match           anchore.events
    Host            ${SPLUNK_HEC_HOST}
    Port            ${SPLUNK_HEC_PORT}
    TLS             On
    TLS.Verify      On
    Splunk_Token    ${SPLUNK_HEC_TOKEN}
    Splunk_Send_Raw Off
    Event_Host      anchore-enterprise
    Event_Sourcetype anchore:events
    Event_Index     anchore_events
    Retry_Limit     5
Configuration Options
Parameter
Description
Example
Host
Splunk HEC hostname
splunk.example.com
Port
Splunk HEC port
8088
TLS
Enable TLS encryption
On
TLS.Verify
Verify TLS certificates
On
Splunk_Token
HEC authentication token
your-token-here
Splunk_Send_Raw
Send raw JSON events
Off
Event_Host
Host field value in Splunk
anchore-enterprise
Event_Sourcetype
Sourcetype for events
anchore:events
Event_Index
Target Splunk index
anchore_events
Retry_Limit
Number of retry attempts
5
Environment Variables
Set these environment variables for Fluent Bit:
Variable
Description
Example
SPLUNK_HEC_HOST
Splunk HEC hostname
splunk.example.com
SPLUNK_HEC_PORT
Splunk HEC port
8088
SPLUNK_HEC_TOKEN
HEC authentication token
your-hec-token
Store the HEC token securely using Kubernetes Secrets or environment variable injection. Never commit tokens to version control.
TLS Configuration
For production deployments, always enable TLS verification:
[OUTPUT]
    Name            splunk
    ...
    TLS             On
    TLS.Verify      On
    TLS.CA_File     /path/to/ca-bundle.crt
If using self-signed certificates (not recommended for production):
[OUTPUT]
    Name            splunk
    ...
    TLS             On
    TLS.Verify      Off
Verification
Step 1: Test HEC Connectivity
Test the HEC endpoint directly:
curl -k -X POST "https://<splunk-host>:8088/services/collector/event"\
-H "Authorization: Splunk <your-token>"\
-d '{"event": "test event from anchore"}'
Configuring Anchore Enterprise starts with configuring each of the core services. Anchore Enterprise deployments using docker compose for trials or Helm for production are designed to run by default with no modifications necessary to get started. Although, many options are available to tune your production deployment to fit your needs.
About Configuring Anchore Enterprise
All system services (except the UI, which has its own configuration) require a single configuration which is read from /config/config.yaml when each service starts up. Settings in this file are mostly related to static settings that are fundamental to the deployment of system services. They are most often updated when the system is being initially tuned for a deployment. They may, infrequently, need to be updated after they have been set as appropriate for any given deployment.
Sections of the UI configuration settings can now be found from within the UI itself! Navigate to the ‘System’ heading in the sidebar and then select ‘Configuration’. Here you will see some of the exposed configuration options:
By default, Anchore Enterprise includes a config.yaml that is functional out-of-the-box, with some parameters set to an environment variable for common site-specific settings. These settings are then set either in docker-compose.yaml, by the Helm chart, or as appropriate for other orchestration/deployment tools.
When deploying Anchore Enterprise using the Helm chart, you can configure it by modifying the anchoreConfig section in your values file. This section corresponds to the default config.yaml file included in the Anchore Enterprise container image. The values file serves to override the default configurations and should be modified to suit your deployment.
A single configuration file config.yaml is required to run Anchore Enterprise - by default, this file is embedded in the Enterprise container image, located in /config/config.yaml. The default configuration file is provided as a way to get started, which is functional out of the box, without modification, when combined with either the Helm method or docker compose method of installing Enterprise. The default configuration is set up to use environment variable substitutions so that configuration values can be controlled by setting the corresponding environment variables at deployment time (see Using Environment Variables in Anchore Enterprise.
Each environment variable (starting with ANCHORE_) in the default config.yaml is set (either the baseline as set in the Dockerfile, or an override in docker compose or Helm or through a system default) to ensure that the system comes up with a fully populated configuration.
Some examples of useful initial settings follow.
Default admin credentials: A default admin email and password is required to be defined in the catalog service for the initial bootstrap of enterprise to succeed, which are both set through the default config file using the ANCHORE_ADMIN_PASSWORD and ANCHORE_ADMIN_EMAIL environment variables respectively. The system defines a default email admin@myanchore, but does not define a default password. If using the default config file, the user must set a value for ANCHORE_ADMIN_PASSWORD in order to succeed the initial bootstrap of the system. To set the default password or to override the default email, simply add overrides for ANCHORE_ADMIN_PASSWORD and ANCHORE_ADMIN_EMAIL environment variables, set to your preferred values prior to deploying Anchore Enterprise. After the initial bootstrap, this can be removed if desired.
Log level: Anchore Enterprise is configured to run at the INFO log level by default. The full set of options are CRITICAL, ERROR, WARNING, INFO, and DEBUG (in ascending order of log output verbosity). Admin accounts can set the system log level through the dashboard, the dashboard allows differing per-service log levels. Changes through the dashboard do not require a system restart. The log level can also be set globally (across all services) with an override for ANCHORE_LOG_LEVEL prior to deploying Anchore Enterprise, this approach requires a system restart to take effect.
log_level:'${ANCHORE_LOG_LEVEL}'
Postgres Database: Anchore Enterprise requires access to a PostgreSQL database to operate. The database can be run as a container with a persistent volume or outside of your container environment (which is set up automatically if the example docker-compose.yaml is used). If you wish to use an external Postgres Database, the elements of the connection string in the config.yaml can be specified as environment variable overrides. The default configuration is set up to connect to a postgres DB that is deployed alongside Anchore Enterprise Services when using docker-compose or Helm, to the internal host anchore-db on port 5432 using username postgres with password mysecretpassword and db postgres. If an external database service is being used then you will need to provide the use, password, host, port and DB name environment variables, as shown below.
While Anchore Enterprise is set up to run out of the box without modifications, and many useful values can be overridden using environment variables as described above, one can always opt to have full control over the configuration by providing a config.yaml file explicitly, typically by generating the file and making it available from an external mount/configmap/etc. at deployment time. A good method to start if you wish to provide your own config.yaml is to extract the default config.yaml from the Anchore Enterprise container image, modify it, and then override the embedded /config/config.yaml at deployment time. For example:
Extract the default config file from the anchore/enterprise container image:
Set up your deployment to override the embedded /config/config.yaml at run time (below example shows how to achieve this with docker compose). Edit the docker-compose.yaml to include a volume mount that mounts your my_config.yaml over the embedded /config/config.yaml, resulting in a volume section for each Anchore Enterprise service definition.
Now, each service will come up with your external my_config.yaml mounted over the embedded /config/config.yaml.
5.1.1 - API Accessible Configuration
Anchore Enterprise provides the ability to view the majority of system configurations via the API.
A select number of configurations can also be modified through the API, or through the System Configuration tab from the UI.
This enables control of system behaviors and characteristics in a programmatic way without needing to restart your deployment.
⚠️ At this time, only a few configurations are modifiable through this new API-backed mechanism yet. Full configuration continues to be achievable through the existing config file mechanism.
Configuration Provenance
Configuration values are established by a priority system which derives the final running value based on the location from
which the value was read. This provenance priority mechanism enables backwards compatibility and increased security
for customers wishing tighter control of their systems runtime.
1. Config File Source
Any configuration variable which is declared within an on-disk configuration file will be honored first (ie. via a Helm values.yaml).
These configuration variables will be read-only through the API and UI. Any configuration that is currently set for your deployment
will be preserved.
⚠️ The use of environment variables for configuration values are treated with the same provenance as config file.
2. API Config Source
When a configuration variable is not declared in a config file and is one of the select few that are allowed to be modified via the API,
its value will be stored in the system database. These configuration variables can be modified via the API and the changes will be reflected
within the deployment within a short time without having to restart your deployment.
The following configuration variables are modifiable through the API:
If a configuration variable has not been declared by any other source it inherits the default system value. These are values chosen by Anchore
as safe and functional defaults.
For the majority of deployments we recommend you simply use the default settings for most values as they have been calibrated to
offer the best experience out of the box.
⚠️ Note: These values may change from release to release. Notable changes will be communicated through Release Notes. Significant
system behaviour changes will not be performed between minor releases. If you wish to ensure a default is not changed, “pin” the
value either by providing it explicitly in the config file or setting it directly via the API (when available).
Blocked by Config File
Attempts to set a configurations through the API may return a blocked_by_config_file error.
This error is raised when a configuration variable is not API editable as it is set in a config file.
Locations to inspect for a pinned config value are:
the Helm attached values.yaml file (continue reading for further instructions)
the compose attached config.yaml file
the environment variables being passed into the container
Disabling Helm Chart Configs
For Helm users, to make a value configurable through the API, set the value in the attached values.yaml to "<ALLOW_API_CONFIGURATION>"
Each running container will refresh its internal configuration state approximately every 30 seconds. After making a change please allow
a minute to elapse for the changes to flush out to all running nodes.
Config File Configurations Refresh
Changes made to a mounted config file will be detected and will cause a system configuration refresh.
If a configuration variable that is changed requires a system restart a log message will be printed to that effect.
If a system is pending restart, none of the changes will take effect until
this is performed. This config file watcher includes a mounted .env file if in use.
Config Validation
In a future major release of Anchore Enterprise, we will be enabling a strict mode type and data validation for the configuration.
This will result in any non-compliant Enterprise deployments failing to boot. For now this is not enforced.
For awareness, validation of your configuration variables and values will occur during system boot.
If any configuration fails this validation, a log message mentioning lenient mode will be published.
This will be accompanied by details on which entries have failed.
To avoid system downtime in a future major release, consider resolving these issues today.
Secret Values
Secret values cannot be read through the API, they will return as the string <redacted> it is however possible to update them.
It is not possible to set any secret value to the string <redacted>.
Security Permissions
Config file permissions have not changed, they are editable by the system deployer.
API requests to make changes to configuration will only be accepted if coming from an Anchore Enterprise user with system-admin permissions.
5.1.2 - Content Hints
For an overview of the content hints and overrides features, see the feature overview
Enabling Content Hints
This feature is disabled by default to ensure that images may not exercise this feature without the admin’s explicit approval. This page will explain how to enable content hints for both Docker Compose and Kubernetes (Helm) deployments. Additionally, if you are performing distributed analysis of images and require hints detection you will ALSO need to modify your AnchoreCTL configuration.
Hints cannot be used to modify the findings of Anchore Enterprise’s analyzer beyond adding new packages to the report. If a user specifies a package in the content hints file that is found by Anchore Enterprise’s image analyzers, the hint is ignored and a warning message is logged to notify the user of the conflict
🐳 Docker Compose
To configure your Docker Compose deployment and enable content hints you have two options.
If you supply a config.yaml to the analyzer(s) in your Docker Compose file, then set the enable_hints: true setting in the analyzer service section of config.yaml file.
If you don’t supply a config.yaml, you can add an environment variable ANCHORE_HINTS_ENABLED=true on the analyzer service.
This will also enable content hints detection during centralized analysis.
☸️ Kubernetes (Helm)
To configure your Kubernetes (Helm) deployment and enable content hints, you can update your values file and set anchoreConfig.analyzer.enable_hints: true. This will also enable content hints detection during centralized analysis.
anchoreConfig:analyzer:enable_hints:true
AnchoreCTL Distributed
In addition to enabling content hints in your deployment, you may also need to enable content hints detection for distributed analysis.
This can be achieved by editing your AnchoreCTL configuration, for example ~/anchorectl.yaml as shown below. This enables the file cataloger which will add some computational overhead.
Environment variable references may be used in the Anchore Enterprise config.yaml file to set values that need to be configurable during deployment.
Using this mechanism a common configuration file can be used with multiple Anchore Enterprise instances with key values being passed using environment variables.
The config.yaml configuration file is read by Anchore Enterprise and any references to variables prefixed with ANCHORE will be replaced by the value of the matching environment variable.
For example in the sample configuration file the host_id parameter is set be appending the ANCHORE_HOST_ID variable to the string dockerhostid
host_id: 'dockerhostid-${ANCHORE_HOST_ID}'
Notes:
Only variables prefixed with ANCHORE will be replaced
If an environment variable is referenced in the configuration file but not set in the environment then a warning will be logged
It is recommend to use curly braces, for example ${ANCHORE_PARAM} to avoid potentially ambiguous cases
Passing Environment Variables as a File
Environment Variables may also be passed as a file contained key value pairs.
The system will check for an environment variable named ANCHORE_ENV_FILE if this variable is set then Anchore Enterprise will attempt to read a file at the location specified in this variable.
The Anchore Enterprise environment file is read before any other Anchore Enterprise environment variables so any ANCHORE variables passed in the environment will override the values set in the environment file.
5.2 - Enterprise UI Configuration
The Enterprise UI service has some static configuration options that are read
from /config/config-ui.yaml inside the UI container image when the system
starts up. Some of these options can be superseded by environment variables, which
are also documented below. When neither a configuration file option nor an
environment variable is set, a built-in default value is used, if applicable.
In these cases, and if the value is not read-only, it can be changed at runtime via
the UI configuration page.
Note: The configuration is designed to not require any modification when using the
quickstart (docker compose) or production (Helm) methods of deploying Anchore Enterprise
Enterprise.
Required Configuration
These settings are essential for the Anchore Enterprise GUI to start and
function properly.
enterprise_uri
The (required) enterprise_uri key specifies the address of the Anchore EnterpriseEnterprise service. The value must be a string containing a properly-formed
‘http’ or ‘https’ URI. This value can be overridden by using the
ANCHORE_ENTERPRISE_URI environment variable.
Note: Password credentials provided as part of the URI will be obfuscated
when displayed in the UI logs for security reasons.
enterprise_uri:'http://api:8228/v2'
redis_uri
The (required) redis_uri key specifies the address of the Redis service. The
value must be a string containing a properly-formed redis URI such as
redis://ui-redis. If encryption in transit is in use with an external Redis the
connection string should be rediss:// instead of redis://. Note that the
default configuration uses the Redis Serialization Protocol (RESP). This
value can be overridden by using the ANCHORE_REDIS_URI environment variable.
Note: Password credentials provided as part of the URI will be obfuscated
when displayed in the UI logs for security reasons.
redis_uri:'redis://ui-redis:6379'
appdb_uri
The (required) appdb_uri key specifies the location and credentials for the
postgres DB endpoint used by the UI. The value must contain the host, port, DB
user, DB password, and DB name. This value can be overridden by using the
ANCHORE_APPDB_URI environment variable.
Note: Password credentials provided as part of the URI will be obfuscated
when displayed in the UI logs for security reasons.
Note: If your database password contains special characters (such as @, :,
/, %, #, or others), these characters may need to be URL-encoded in the
connection string to ensure proper parsing. For example, a password containing @ should be
encoded as %40. You can use online URL encoding tools or programming language
URL encoding functions to encode your password before including it in the URI.
The default Helm chart provided by Anchore automatically handles this encoding
for you when you provide the password via the chart values. Clients using Docker
or their own deployment methods should ensure proper encoding as needed.
Security & SSL
These settings control SSL/TLS behavior, authentication modes, and proxy trust.
enable_ssl
The (optional) enable_ssl key specifies whether the application is running
in an SSL/TLS-enabled environment. When set to True, the following security
behaviors are enabled:
Secure cookies: Session cookies are marked with the Secure flag,
instructing browsers to only transmit them over HTTPS connections. This
prevents session hijacking via unencrypted network traffic.
SameSite=None: The cookie SameSite attribute is set to None,
allowing the cookie to be sent in cross-site requests. This is required for
certain authentication flows and embedded scenarios, but is only safe when
combined with the Secure flag.
Upgrade insecure requests: The Content Security Policy (CSP) header
includes upgrade-insecure-requests, instructing browsers to automatically
upgrade HTTP requests to HTTPS.
When set to False (the default), cookies use SameSite=Lax which provides
protection against cross-site request forgery (CSRF) attacks while allowing
normal navigation.
Note: Only enable this property if your deployment is configured to serve
traffic over HTTPS—either directly with TLS certificates or behind an
SSL-terminating reverse proxy. Enabling this setting without HTTPS will
prevent browsers from sending session cookies, effectively breaking
authentication. This property is read-only and can only be set via the
config-ui.yaml file or environment variable.
This value can be overridden by using the ANCHORE_ENABLE_SSL environment
variable.
Default:False
enable_ssl:False
enable_proxy
The (optional) enable_proxy key configures the application to trust
reverse proxy headers when determining connection security. When set to
True, the application reads the X-Forwarded-Proto header to determine
whether the original client connection was made over HTTPS.
This setting is essential for deployments where SSL/TLS termination occurs at
a load balancer or reverse proxy (such as NGINX, HAProxy, or a cloud load
balancer) rather than at the application itself. In these architectures:
The client connects to the proxy over HTTPS
The proxy terminates SSL and forwards the request to the application over
HTTP
The proxy sets X-Forwarded-Proto: https to indicate the original protocol
The application uses this header to correctly set secure cookie attributes
Without this setting enabled in a proxied environment, the application would
see only the internal HTTP connection and fail to set cookies correctly,
potentially breaking authentication or reducing security.
Note: Only enable this setting if enable_ssl is also enabled and your
application runs behind a trusted reverse proxy. Enabling this in an
environment without a proxy could allow malicious clients to spoof the header.
This property is read-only and can only be set via the config-ui.yaml file
or environment variable.
This value can be overridden by using the ANCHORE_ENABLE_PROXY environment
variable.
Default:False
enable_proxy:False
sso_auth_only
The (optional) sso_auth_only key disables native user authentication for all
users except the admin user. When enabled, only SSO-based authentication
methods (such as SAML or LDAP) will be available for non-admin users.
Note: This property is read-only and can only be set via the
config-ui.yaml file or environment variable.
This value can be overridden by using the ANCHORE_SSO_AUTH_ONLY environment
variable.
Default:False
sso_auth_only:False
Session Management
These settings control user session behavior, timeouts, and authentication locks.
session_timeout
The (optional) session_timeout key specifies the maximum duration (in
seconds) that a user session can remain idle before it expires and the user is
required to re-authenticate. The session timeout is automatically refreshed
with each user request (rolling session), meaning active users will not be
logged out.
The minimum value is 60 seconds and there is no maximum limit, although very
large values are not recommended for security reasons. Changes to this
configuration are applied immediately to all active sessions on their next
request.
This value can be overridden by using the ANCHORE_SESSION_TIMEOUT
environment variable. If not set via the config-ui.yaml file or environment
variable, this setting can be configured via the System > Configuration view in
the UI.
Default:1209600 (seconds / 14 days)
session_timeout:1209600
allow_shared_login
The (optional) allow_shared_login key specifies if a single set of user
credentials can be used to start multiple Anchore Enterprise GUI sessions; for
example, by multiple users across different systems, or by a single user on a
single system across multiple browsers.
When set to False, only one session per credential is permitted at a time,
and logging in will invalidate any other sessions that are using the same set
of credentials.
Note that setting this property to False does not prevent a single session
from being viewed within multiple tabs inside the same browser. This value
can be overridden by using the ANCHORE_ALLOW_SHARED_LOGIN environment
variable. If unset via the config-ui.yaml file or environment variable, this
setting can be configured via the System > Configuration view in the UI.
Default:True
allow_shared_login:True
authentication_lock
The (optional) authentication_lock keys specify if a user should be
temporarily prevented from logging in to an account after one or more failed
authentication attempts. For this feature to be enabled, both count and
expires values must be whole numbers greater than 0. If only one value is
set, the feature will remain disabled. They can be overridden by using the
ANCHORE_AUTHENTICATION_LOCK_COUNT and ANCHORE_AUTHENTICATION_LOCK_EXPIRES
environment variables respectively.
The count value represents the number of failed authentication attempts
allowed to take place before a temporary lock is applied to the username. The
expires value represents, in seconds, how long the lock will be applied for.
Note that, for security reasons, when this feature is enabled it will be
applied to any submitted username, regardless of whether the user exists.
If not set via the config-ui.yaml file or environment variable, this setting
can be configured via the System > Configuration view in the UI.
Default: Not configured (feature disabled)
authentication_lock:count:5expires:300
Logging
These settings control application logging behavior and output.
log_level
The (optional) log_level key allows you to set the descriptive detail of the
application log output. The key value must be a string selected from the
following priority-ordered list (based on a subset of npm’s log levels):
error — Critical errors that prevent normal operation or indicate a
failure condition
warn—Warning messages for potentially problematic situations that don’t
prevent operation
info—General informational messages about application state and
significant events
http—HTTP request/response logging for API calls and web traffic
debug—Detailed diagnostic information useful for troubleshooting issues
silly—Extremely verbose output including all internal operations (not
recommended for production)
Once set, each level will automatically include the output for any levels
above it—for example, info will include the log output for details at the
warn and error levels, whereas error will only show error output.
This value can be overridden by using the ANCHORE_LOG_LEVEL environment
variable. If not set via the config-ui.yaml file or environment variable,
this setting can be configured via the System > Configuration view in the UI.
Default:http
log_level:'http'
log_dir
The (optional) log_dir key allows you to set the location of the Anchore EnterpriseEnterprise Client log file. The key value must be a string containing a valid
path to a writable directory.
This value can be overridden by using the ANCHORE_LOG_DIR environment
variable. If not set via the config-ui.yaml file or environment variable,
this setting can be configured via the System > Configuration view in the UI.
Default:/var/log/anchore
log_dir:'/var/log/anchore'
log_dir_retry_interval
The (optional) log_dir_retry_interval key specifies the interval in
milliseconds for monitoring log directory availability. If set, the
application will periodically check the log directory health and automatically
enable file logging when it becomes available or disable it when it becomes
unavailable.
The minimum value is 60000 milliseconds (60 seconds). This value can be
overridden by using the ANCHORE_LOG_DIR_RETRY_INTERVAL environment variable.
If not set via the config-ui.yaml file or environment variable, this setting
can be configured via the System > Configuration view in the UI.
Default:60000 (milliseconds / 60 seconds)
log_dir_retry_interval:60000
Caching & Performance
These settings control data caching and performance-related options.
cache_expiry
The (optional) cache_expiry key specifies whether the Anchore Enterprise
Client should employ data caching on service routes that support it. When set
with a positive whole number, this value is used to specify the time-to-live
for the cached data in seconds. Set to 0 or false to disable caching
entirely.
This value can be overridden by using the ANCHORE_CACHE_EXPIRY environment
variable. If not set via the config-ui.yaml file or environment variable,
this setting can be configured via the System > Configuration view in the UI.
Default:600 (seconds / 10 minutes)
cache_expiry:600
enrich_inventory_view
The (optional) enrich_inventory_view key allows you to set whether the
Kubernetes feature should aggregate and include compliance and
vulnerability data from the reports service. Setting this key to False
can increase performance on high-volume systems.
This value can be overridden by using the ANCHORE_ENRICH_INVENTORY_VIEW
environment variable. If not set via the config-ui.yaml file or environment
variable, this setting can be configured via the System > Configuration view in
the UI.
Default:True
enrich_inventory_view:True
Customization
These settings allow you to customize the appearance and add custom content to the UI.
custom_links
The (optional) custom_links key allows a list of up to 10 external links to
be provided (additional items will be excluded). The top-level title key
provides the label for the menu (if present, otherwise the string “Custom
External Links” will be used instead).
Each link entry must have a title of at least 1 character and a valid URI. The
URI must be either a relative path (starting with /) or an absolute URL with
http:// or https:// protocol. If either item is invalid, a validation
error will be shown and the configuration cannot be saved. If not set via the
config-ui.yaml file, this setting can be configured via the
System > Configuration view in the UI.
Default: Not configured (feature disabled)
custom_links:title:Custom External Linkslinks:- title:Example Link 1uri:https://example.com- title:Example Link 2uri:https://example.com- title:Example Link 3uri:https://example.com- title:Example Link 4uri:https://example.com- title:Example Link 5uri:https://example.com- title:Example Link 6uri:https://example.com- title:Example Link 7uri:https://example.com- title:Example Link 8uri:https://example.com- title:Example Link 9uri:https://example.com- title:Example Link 10uri:https://example.com
custom_message
The (optional) custom_message key allows you to provide a message that will
be displayed on the application login page below the Username and
Password fields. The key value must be an object that contains:
A title key, whose string value provides a title for the message—which can
be up to 250 characters
A message key, whose string value is the message itself—which can be up to
10000 characters
Note: Both title and message values must be present and contain at
least 1 character for the message box to be displayed. If either value
exceeds the character limit, a validation error will be shown and the
configuration cannot be saved.
Default: Not configured (feature disabled)
Important: The ability to add custom messages via the UI configuration page
is currently disabled but will be provided in a forthcoming release.
banners
The (optional) banners key allows you to provide messages that
will be displayed as a banner at the top and/or bottom of the application
or only the login page. You can set either or both banners. Each banner
is defined by a key that contains an object with the following properties:
text (string): The message to be displayed in the banner. This can be
up to 2000 characters long.
text_color (string): The color of the text in the banner.
background_color (string): The background color of the banner.
display (string): The display condition for the banner. This can be set
to always or login-only. If not specified, the default is
always. The login-only option will only display the banner on the
login page.
banners:top:text:"Custom message for the top banner..."text_color:""background_color:""display:"always"bottom:text:"Custom message for the bottom banner..."text_color:""background_color:""display:"login-only"
Note:
The text value must be present and contain at least 1 character for
the banner to be displayed. If text is provided, display must also be
set. Conversely, if display or color settings are provided, text must
also be set. If the text exceeds the character limit, a validation error
will be shown and the configuration cannot be saved. When displayed, long
text may be truncated with an ellipsis, with the full text available on
hover.
The text_color and background_color values can be any
valid CSS color format, including hex codes (e.g., #FF5733),
RGB (e.g., rgb(255, 87, 51)), or color names (e.g., red).
If not set via the config-ui.yaml file, this setting can be configured via
the System > Configuration view in the UI. Because of the level of
detail that can be provided, this configuration (and other complex configs)
are managed via a dedicated editor modal:
Default: Not configured (feature disabled)
Database Configuration
These settings control database connections and pool configuration.
appdb_config
The (optional) appdb_config key allows you to configure advanced database
connection pool settings for the Anchore Enterprise Client application
database. This configuration is useful for performance tuning in high-scale
deployments.
Note: This property is read-only and can only be set via the
config-ui.yaml file. It cannot be modified through the UI configuration page
to prevent accidental misconfiguration that could result in connectivity
issues.
The key value must be an object containing the following properties:
native (boolean): Enables the use of the pg-native library for improved
performance. Defaults to true.
pool (object): Connection pool configuration with the following properties:
min (integer): Minimum number of connections in the pool. Defaults to 0.
max (integer): Maximum number of connections in the pool. Defaults to 10.
acquire (integer): Maximum time (in milliseconds) that the pool will try
to get a connection before throwing an error. Defaults to 30000.
idle (integer): Maximum time (in milliseconds) that a connection can be
idle before being released. Defaults to 10000.
These settings control Redis connection and cluster behavior.
redis_cluster_enabled
The (optional) redis_cluster_enabled key enables Redis cluster mode for
distributed deployments. When enabled, the application will connect to Redis
using cluster mode instead of standalone mode. This is essential for
high-availability deployments that require Redis clustering.
Note: This property is read-only and can only be set via the
config-ui.yaml file or environment variable.
This value can be overridden by using the ANCHORE_REDIS_CLUSTER_ENABLED
environment variable.
Default:False
redis_cluster_enabled:False
redis_flushdb
The (optional) redis_flushdb key specifies if the Redis datastore containing
user session keys and data is emptied on application startup. If the datastore
is flushed, any users with active sessions will be required to
re-authenticate.
DEPRECATED: This configuration property is deprecated and will be removed in
a forthcoming release.
This value can be overridden by using the ANCHORE_REDIS_FLUSHDB environment
variable.
Default:True
redis_flushdb:True
Network & Service
These settings control network ports, WebSocket behavior, and metrics.
port
The (optional) port key specifies the port number to use for the Anchore EnterpriseEnterprise Client web service. The value must be a whole number between 1
and 65535.
Note: This property is read-only and can only be set via the
config-ui.yaml file or environment variable.
This value can be overridden by using the PORT environment variable.
Default:3000
port:3000
force_websocket
The (optional) force_websocket key specifies if the WebSocket protocol must
be used for socket message communications. By default, long-polling is
initially used to establish the handshake between client and web service,
followed by a switch to WS if the WebSocket protocol is supported.
Note: This property is read-only and can only be set via the
config-ui.yaml file or environment variable.
This value can be overridden by using the ANCHORE_FORCE_WEBSOCKET
environment variable.
Default:False
force_websocket:False
enable_prometheus_metrics
The (optional) enable_prometheus_metrics key enables exporting monitoring
metrics to Prometheus. When enabled, the metrics are made available on the
/metrics endpoint.
This value can be overridden by using the ANCHORE_ENABLE_METRICS environment
variable. If not set via the config-ui.yaml file or environment variable,
this setting can be configured via the System > Configuration view in the UI.
Default:False
enable_prometheus_metrics:False
reports_uri
The (optional) reports_uri key specifies the address of the Reports service.
The value must be a string containing a properly-formed ‘http’ or ‘https’ URI
and can be overridden by using the ANCHORE_REPORTS_URI environment variable.
reports_uri:'http://reports:8228/v2'
Licensing
license_path
The (optional) license_path key specifies the location of the local system
folder containing the license.yaml license file used by the Anchore EnterpriseEnterprise UI web service for product activation. Although this setting is
optional as a path default is provided, if a custom configuration is specified
it must be correct to allow the full functionality of the application.
Default:/license.yaml
license_path:'/license.yaml'
LDAP Configuration
These settings control LDAP authentication timeouts.
ldap_timeout
The (optional) ldap_timeout key specifies the time (in milliseconds) the
LDAP client should let operations stay alive before timing out. The value must
be a whole number greater than 0.
This value can be overridden by using the ANCHORE_LDAP_AUTH_TIMEOUT
environment variable. If not set via the config-ui.yaml file or environment
variable, this setting can be configured via the System > Configuration view in
the UI.
Default:6000 (milliseconds)
ldap_timeout:6000
ldap_connect_timeout
The (optional) ldap_connect_timeout key specifies the time (in milliseconds)
the LDAP client should wait before timing out on TCP connections. The value
must be a whole number greater than 0.
This value can be overridden by using the ANCHORE_LDAP_AUTH_CONNECT_TIMEOUT
environment variable. If not set via the config-ui.yaml file or environment
variable, this setting can be configured via the System > Configuration view in
the UI.
Default:6000 (milliseconds)
ldap_connect_timeout:6000
Feature Flags
These settings control optional features and capabilities.
enable_add_repositories
The (optional) enable_add_repositories key specifies if repositories can be
added via the application interface by either administrative users or standard
users. When disabled, this property also suppresses the availability of the
Watch Repository toggle associated with any repository entries displayed
in the Artifact Analysis view.
Note that in the absence of one or all of the properties, each defaults to
True. Thus, this key, and a child key corresponding to an account type (that
is itself explicitly set to False) must be set for the feature to be
disabled for that account. If not set via the config-ui.yaml file, this
setting can be configured via the System > Configuration view in the UI.
Default: The admin and standard keys are both set to True
enable_add_repositories:admin:Truestandard:True
Managing Configuration in the UI
Sections of the UI configuration settings can now be found from within the UI.
Navigate to the System heading in the sidebar and then select Configuration.
Here you will see some of the exposed configuration options:
A configuration is changeable if it is not already set via an environment variable or
config file, and is not designated as read-only. Read-only settings can only be changed
by modifying the configuration file directly or setting an environment variable,
and these typically fall into the category of settings that are critical to application
functionality or security where runtime changes could lead to instability or
interfere with the current operation of the system.
NOTE: The latest default UI configuration file can always be extracted from
the Enterprise UI container to review the latest options, environment overrides
and descriptions of each option using the following process:
The Dashboard is your configurable landing page where insights into the collective status of your container image environment can be displayed through various widgets. Utilizing the Enterprise Reporting Service, the widgets are hydrated with metrics which are generated and updated on a cycle, the duration of which is determined by application configuration.
Note: Because the reporting data cycle is configurable, the results shown in this view may not precisely reflect actual analysis output at any given time.
For more information on how to modify this cycle or the Reporting Service in general, please refer to the Reporting Service.
The following sections in this document describe how to add widgets to the dashboard and how to customize the dashboard layout to your preference.
Widgets
Adding a Widget
To add a new widget, click the Add New Widget button present in the Dashboard view. Or, if no widgets are defined, click the Let’s add one! button shown.
Upon doing so, a modal will appear with several properties described below:
Property
Description
Name
The name shown within the Widget’s header.
Mode
‘Compact’ a widget to keep data easily digestible at a glance. ‘Expand’ to view how your data has evolved over a configurable time period.
Collection
The collection of tags you’re interested in. Toggle to view metrics for all tags - including historical ones.
Time Series Settings
The time period you wish to view metrics for within the expanded mode.
Type
The category of information such as ‘Vulnerabilities’ or ‘Policy Evaluations’ which denotes what metrics are capable of being shown.
Metrics
The list of metrics available based on Type.
Once you enter the required properties and click OK, the widget will be created and any metrics needed to hydrate your Dashboard will be fetched and updated.
Note: All fields except Type are editable by clicking the button shown on the top right of the header when hovering over a widget.
Viewing Results
The Reporting Service at its core aggregates data on resources across accounts and generates metrics. These metrics, in turn, fuel the Dashboard’s mission to provide actionable items straight to the user - that’s you!
Leverage these results to dive into the exact reason for a failed policy evaluation or the cause and fix of a critical vulnerability.
Vulnerabilities
Vulnerabilities are grouped and colored by severity. Critical, High, and Medium vulnerabilities are included by default but you can toggle which ones are relevant to your interests by clicking the button.
Clicking one of these metrics navigates you to a view (shown below) where you can browse the filtered set of vulnerabilities matching that severity.
For more info on a particular vulnerability, click on its corresponding button visible in the Links column. To view the exact tags affected, drill down to a specific repository by expanding the arrows.
View that tag’s in-depth analysis by clicking on the value within its Image Digest column.
Policy Evaluations
Policy Evaluations are grouped by their evaluation outcome such as Pass or Fail and can be further filtered by the reason for that result. All reasons are included by default but as with other widget properties, they can be edited by clicking the button.
Clicking one of these results navigates you to a view (shown below) where you can browse the affected and filtered set of tags.
Dig down to a specific tag by expanding the arrow shown on the left side of the row.
Navigate using the Image Digest value to view even more info such as the specific policy being triggered and what exactly is triggering it. If you’re interested in viewing the contents of your policy, click on the Policy ID value.
Dashboard Configuration
After populating your Dashboard with various widgets, you can easily modify the layout by using some methods explained below:
Click this icon shown in the top right or the header of a widget to Drag and Drop it into a new location.
Shown in the bottom right of a widget, click and hold this icon to Resize it.
Click this icon shown in the top right of a widget to Expand it and include a graphical representation of how your data has evolved over a time period of your choice.
Click this icon shown in the top right of a widget to Compact it into an easily digestible view of the metrics you’re interested in.
lick this icon shown in the top right of a widget to Delete it from the dashboard.
5.3 - Configuring AnchoreCTL
AnchoreCTL (anchorectl) is the command-line client for Anchore Enterprise. You can configure it in three ways (a configuration file, environment variables, and command-line flags), and mix them freely. In practice you put static settings (your Enterprise URL, credentials, logging, cataloger behavior) in a configuration file so that day-to-day invocations only need command-specific arguments. A configuration file is not strictly required, though: every setting can also be supplied through an environment variable or flag, which keeps the tool friendly to stateless scripting and CI.
AnchoreCTL is version-aligned with Anchore Enterprise for major and minor releases. Refer to the Enterprise Release Notes for the supported version of AnchoreCTL.
How Configuration Is Resolved
When more than one source sets the same value, AnchoreCTL applies them in the following order of precedence (highest first):
Command-line flags (for example, --url).
Environment variables (for example, ANCHORECTL_URL).
Configuration file (the first file found in the search order below).
If you do not point AnchoreCTL at a specific file, it searches these locations in order and uses the first match:
.anchorectl.yaml
anchorectl.yaml
.anchorectl/config.yaml
~/.anchorectl.yaml
~/anchorectl.yaml
$XDG_CONFIG_HOME/anchorectl/config.yaml
Set the ANCHORECTL_CONFIG environment variable (or the -c/--config flag) to load a configuration file from a custom location. Doing so bypasses the search order above.
Inspecting the Effective Configuration
AnchoreCTL has extensive built-in help. Run any command with --help to see its arguments and the environment variables that override them:
anchorectl --help
To see the full configuration AnchoreCTL is actually using (your settings merged with all defaults), run with debug logging (-vv):
anchorectl -vv system status
The debug output prints the complete effective configuration. You can paste that output into your .anchorectl.yaml as a fully populated starting point, then edit the values you care about.
The only required settings are the API URL and a set of credentials:
url:""# the URL to the Anchore Enterprise API (env var: ANCHORECTL_URL)username:""# the Anchore Enterprise username (env var: ANCHORECTL_USERNAME)password:""# the Anchore Enterprise user's login password (env var: ANCHORECTL_PASSWORD)
For example, against the Docker Compose quickstart running on your local system, ~/.anchorectl.yaml would look like this:
To confirm the client is ready, run system status, which fetches status information from your deployment. With ~/.anchorectl.yaml populated correctly, no additional arguments are required:
anchorectl system status
 ✔ Status system
┌───────────────────┬────────────────────┬───────────────────────────────┬──────┬────────────────┬────────────┬──────────────┐
│ SERVICE           │ HOST ID            │ URL                           │ UP   │ STATUS MESSAGE │ DB VERSION │ CODE VERSION │
├───────────────────┼────────────────────┼───────────────────────────────┼──────┼────────────────┼────────────┼──────────────┤
│ catalog           │ anchore-quickstart │ http://catalog:8228           │ true │ available      │ 6000       │ 6.0.0        │
│ simplequeue       │ anchore-quickstart │ http://queue:8228             │ true │ available      │ 6000       │ 6.0.0        │
│ analyzer          │ anchore-quickstart │ http://analyzer:8228          │ true │ available      │ 6000       │ 6.0.0        │
│ component_catalog │ anchore-quickstart │ http://component-catalog:8228 │ true │ available      │ 6000       │ 6.0.0        │
│ policy_engine     │ anchore-quickstart │ http://policy-engine:8228     │ true │ available      │ 6000       │ 6.0.0        │
│ reports           │ anchore-quickstart │ http://reports:8228           │ true │ available      │ 6000       │ 6.0.0        │
│ data_syncer       │ anchore-quickstart │ http://data-syncer:8228       │ true │ available      │ 6000       │ 6.0.0        │
│ reports_worker    │ anchore-quickstart │ http://reports-worker:8228    │ true │ available      │ 6000       │ 6.0.0        │
│ apiext            │ anchore-quickstart │ http://api:8228               │ true │ available      │ 6000       │ 6.0.0        │
│ notifications     │ anchore-quickstart │ http://notifications:8228     │ true │ available      │ 6000       │ 6.0.0        │
└───────────────────┴────────────────────┴───────────────────────────────┴──────┴────────────────┴────────────┴──────────────┘
Authentication
Using API Keys
If you would rather not store a user’s login password in the configuration file, generate an API key that grants most of the functionality of anchorectl. See Generating API Keys.
Once you generate the key, use it as the password with the reserved _api_key username:
API keys authenticate using HTTP basic auth. The username for an API key must always be _api_key. API keys are the recommended authentication method for CI/CD pipelines because they can be rotated and revoked independently of user accounts.
Selecting an Account
Users belong to an Anchore Enterprise account. Set account (env var ANCHORECTL_ACCOUNT) to operate against an account other than the one your user belongs to by default. This is typically used by administrators managing multiple accounts.
Using Environment Variables
Almost every configuration file setting has a corresponding environment variable. This is useful for inline, one-off invocations and for CI/CD where storing a file is inconvenient:
ANCHORECTL_URL="http://localhost:8228"ANCHORECTL_USERNAME="admin"ANCHORECTL_PASSWORD="foobar" anchorectl system status
The environment variable name is derived mechanically from the configuration key: prefix with ANCHORECTL_, join nested keys with _, replace - with _, and uppercase. For example:
Configuration key
Environment variable
url
ANCHORECTL_URL
log.level
ANCHORECTL_LOG_LEVEL
http.tls-insecure
ANCHORECTL_HTTP_TLS_INSECURE
secret-search.cataloger.enabled
ANCHORECTL_SECRET_SEARCH_CATALOGER_ENABLED
The exact environment variable for every setting is listed in the reference tables, and by running anchorectl --help.
Configuration File Reference
The tables below list every configuration file parameter, its environment variable, its default value, and a description. Nested keys are shown in dotted form (for example log.level is written under a log: block in YAML).
Connection and Authentication
Parameter
Environment variable
Default
Description
url
ANCHORECTL_URL
""
The URL to the Anchore Enterprise API. Required.
username
ANCHORECTL_USERNAME
""
The Anchore Enterprise username (or _api_key when using an API key). Required.
password
ANCHORECTL_PASSWORD
""
The user’s login password, or the API key value. Required.
account
ANCHORECTL_ACCOUNT
""
The Anchore Enterprise account the user operates against.
ui-url
ANCHORECTL_UI_URL
""
The URL to the Anchore Enterprise GUI. Enables deep links in HTML output. See Enabling UI Linking.
skip-api-version-check
ANCHORECTL_SKIP_API_VERSION_CHECK
false
Disables the check that the configured URL is not a v2 API endpoint.
check-for-updates
ANCHORECTL_CHECK_FOR_UPDATES
true
Check whether a newer AnchoreCTL version is available from Enterprise.
Suppress all logging output. Equivalent to the -q/--quiet flag.
Logging and Debugging
Parameter
Environment variable
Default
Description
log.level
ANCHORECTL_LOG_LEVEL
warn
Log verbosity: error, warn, info, debug, or trace.
log.file
ANCHORECTL_LOG_FILE
""
Path to a file to write all log entries to.
debug.api
ANCHORECTL_DEBUG_API
false
Log HTTP requests, responses, headers, and body. Requires log level debug or trace.
debug.events
ANCHORECTL_DEBUG_EVENTS
false
Log all events on the internal event bus.
The -v/--verbose flag is a shortcut for raising the log level: -v sets info and -vv sets debug. Flags take precedence over log.level.
HTTP Client
Parameter
Environment variable
Default
Description
http.tls-insecure
ANCHORECTL_HTTP_TLS_INSECURE
false
Disable SSL certificate verification for all HTTP calls. Not recommended.
http.timeout
ANCHORECTL_HTTP_TIMEOUT
180
Time in seconds before cancelling an HTTP request.
http.headers
ANCHORECTL_HTTP_HEADERS
{}
Default HTTP headers added to every request.
Registry Credentials
Used for distributed analysis when pulling images directly from a registry. registry.auth is a list; each entry supplies credentials for one registry authority.
Parameter
Environment variable
Default
Description
registry.insecure-skip-tls-verify
ANCHORECTL_REGISTRY_INSECURE_SKIP_TLS_VERIFY
false
Skip TLS verification when contacting the registry.
registry.insecure-use-http
ANCHORECTL_REGISTRY_INSECURE_USE_HTTP
false
Use HTTP instead of HTTPS to contact the registry.
registry.auth[].authority
ANCHORECTL_REGISTRY_AUTH_AUTHORITY
""
The registry host the credentials apply to (for example docker.io).
registry.auth[].username
ANCHORECTL_REGISTRY_AUTH_USERNAME
""
Registry username.
registry.auth[].password
ANCHORECTL_REGISTRY_AUTH_PASSWORD
""
Registry password.
registry.auth[].token
ANCHORECTL_REGISTRY_AUTH_TOKEN
""
Registry token (alternative to username/password).
The ANCHORECTL_REGISTRY_AUTH_* environment variables configure a single credential set that is added ahead of any entries in the configuration file. To configure credentials for multiple registries, use the registry.auth list in the configuration file.
Analysis Catalogers
These sections apply when running AnchoreCTL in distributed analysis mode. Each cataloger’s scope accepts squashed, all-layers, or deep-squashed.
Anchore Data Service API key used to download feed data.
license-file
ANCHORECTL_LICENSE_FILE
""
Path to the Anchore Enterprise license file.
Common Tasks
Setting up Distributed Analysis
In distributed analysis mode, AnchoreCTL performs the image analysis locally rather than on the Enterprise deployment. To mirror the default catalogers that Anchore Enterprise runs during centralized analysis, enable the secret-search and file-contents catalogers. The following ~/.anchorectl.yaml settings reproduce the Enterprise defaults:
For distributed analysis, AnchoreCTL already ships with built-in regex patterns for AWS access keys, private keys, and secret keys. For each cataloger you want to run, set its cataloger.enabled value to true.
When using distributed analysis with --from registry, supply registry credentials through environment variables if the repository requires authentication:
The environment variables only configure a single credential set. For persistent credentials across several registries, use the registry.auth list in your configuration file (see Registry Credentials). Each entry maps an authority (the registry host) to its credentials, so you can authenticate to multiple registries at once:
AnchoreCTL selects the entry whose authority matches the registry of the image being analyzed. Use token for registries that authenticate with a bearer token, or username and password for basic auth.
Analyzing Images from a Local Podman Daemon
Distributed analysis can read an image that already exists in your local Podman store, such as one you built or pulled on the Podman host, with --from podman:
Podman exposes a Docker-compatible API over a Unix socket, managed by the podman.socket systemd service. That service must already be running before AnchoreCTL can connect to it:
Add --now in place of start (e.g. systemctl --user enable --now podman.socket) to also enable the socket on boot.
Once the socket is running, AnchoreCTL locates it by checking the following, in order, and uses the first that resolves:
ANCHORECTL_PODMAN_HOST: explicit socket override.
CONTAINER_HOST: Podman’s own standard socket variable.
Rootless default: $XDG_RUNTIME_DIR/podman/podman.sock, falling back to /run/user/<uid>/podman/podman.sock.
Rootful default: /run/podman/podman.sock.
The rootless and rootful defaults match the path the podman.socket service already listens on, so no further configuration is needed in the common case. Both ANCHORECTL_PODMAN_HOST and CONTAINER_HOST take a socket URI, and are only needed when the socket lives in a non-standard location, for example:
If your proxy uses an untrusted certificate, you may also need to disable certificate verification with ANCHORECTL_HTTP_TLS_INSECURE=true. Disabling verification is not recommended outside of trusted networks.
Enabling UI Linking
When you request HTML output from the one-time-scan, vulnerability, or policy check commands, set ui-url (env var ANCHORECTL_UI_URL) to your Anchore Enterprise GUI endpoint, including protocol and domain (for example, https://myanchore.example.com/). The generated report then includes a direct link to the findings in the GUI.
Link to the findings in the Anchore Enterprise GUI.
5.4 - Using the Analysis Archive
As mentioned in Data Management, there are two locations for image analysis to be stored:
The working set: also known as the active set, this is the standard state after analysis completes. In this location, the image is fully loaded and available for policy evaluation, content, and vulnerability queries.
The archive set: a location to keep image analysis data that cannot be used for policy evaluation or queries but can use cheaper storage and less db space and can be reloaded into the working set as needed.
By default, the archive set is stored within the Postgres database. However, for better scalability and lower costs, it can be configured to point to an external S3-compatible object store. For detailed instructions on switching storage backends, see Object Store: Analysis Archive.
You can manage the lifecycle of your image analysis data in two ways: manually, by using CLI commands or API calls to archive and restore specific images, or automatically with archive rules, which allow you to define global or account-level policies for data transition.
Note that these methods offer different behaviors regarding data retention: while archive rules are designed to automatically move data (deleting it from the working set upon archiving), manual archiving creates a copy in the archive but does not automatically delete the image from the working set. These methods are detailed in the Working with the archive manually and Working with Archive rules sections below.
Before using the Archiving capability, it is worth reviewing the Artifact Lifecycle Policies (ALP) to choose the best solution for your use case.
If you just want to flush data out: Use Artifact Lifecycle Policies to go directly to delete. This is the recommended starting point for all users to prevent database bloat and maintain system performance.
If you need data retention: Use Archive Rules. Only if you have a specific requirement to retain analysis data for long periods (without keeping it in the active working set) should you add archive rules.
Working with the Archive manually
Manual archive operations allow for granular control over individual image analyses, enabling you to list, archive, or restore specific data as needed outside of automated rule cycles.
Listing images in the archive
You can retrieve a list of all archived images and also retrieve archive metadata for an image using the AnchoreCTL.
Manual archiving with anchorectl archive image add does not automatically remove an image from the working set. To fully migrate an image, you must archive it first and then delete it from the working set via the CLI or API.
To delete a recently archived image, ensure it has no active subscriptions. You can either manually remove subscriptions using anchorectl subscription delete before deleting the image, or use the --force flag with anchorectl image delete to automatically disable all subscriptions during the deletion process.
Restoring an image from the archive
This will not delete the archive entry, only add it back to the working set.
Restore an image to working set from the archive set:
anchorectl archive image restore sha256:89020cd33be2767f3f894484b8dd77bc2e5a1ccc864350b92c53262213257dfc
 ✔ Restore image
┌────────────────────────┬─────────────────────────────────────────────────────────────────────────┬──────────┬────────┐
│ TAG                    │ DIGEST                                                                  │ ANALYSIS │ STATUS │
├────────────────────────┼─────────────────────────────────────────────────────────────────────────┼──────────┼────────┤
│ docker.io/nginx:latest │ sha256:89020cd33be2767f3f894484b8dd77bc2e5a1ccc864350b92c53262213257dfc │ analyzed │ active │
└────────────────────────┴─────────────────────────────────────────────────────────────────────────┴──────────┴────────┘
To view the restored image:
anchorectl image get sha256:89020cd33be2767f3f894484b8dd77bc2e5a1ccc864350b92c53262213257dfc
Tag: docker.io/nginx:latest
Digest: sha256:89020cd33be2767f3f894484b8dd77bc2e5a1ccc864350b92c53262213257dfc
ID: 2b7d6430f78d432f89109b29d88d4c36c868cdbf15dc31d2132ceaa02b993763
Analysis: analyzed
Status: active
Analyzing the same image digest whilst it exists in the Analysis Archive will not automatically restore the image. This will count as a new analysis. However, restoring the image first will not count as a new analysis and if you then force analyze an image to get a newer SBOM, this will then also count as a re-analysis.
Deleting an image from the archive
You can manually delete a specific archived image analysis using the API or AnchoreCTL. Deleting from the archive is permanent and the analysis cannot be restored unless the image is re-analyzed in the working set.
Archive rules allow for the automated transition of images from the working set to the archive, or the deletion of images from the archive based on age or the number of newer tags available.
Unlike manual archiving, when an image matches an archive rule, it is moved to the archive and subsequently removed from the active working set. Archive rules can be easily controlled via AnchoreCTL commands, the --help option will show the arguments, options and descriptions of valid values. Note: By default, archive rules are processed every 12 hours. This interval is governed by the catalog service and can be adjusted in your configuration file under anchoreConfig.catalog.cycle_timers.archive_tasks.
Archive Rule Fields
An archive rule is expressed as a JSON object with the following fields:
transition — the action to perform when a rule matches.
archive: move a matching analysis from the working set to the archive.
delete: remove a matching analysis from the archive set.
selector — a filter on registry, repository, and tag that the rule applies to. Each field supports wildcards (for example {"registry": "*", "repository": "library/*", "tag": "latest"}).
analysis_age_days — the minimum age of the analysis before the rule fires. For archive transitions this is measured from the image’s analyzed_at timestamp; for delete transitions it is measured from the date the image was added to the archive.
tag_versions_newer — the minimum number of newer tag-to-digest mappings that must exist for this tag before a matching image is eligible for the rule.
exclude — an optional filter used to exclude images from the selector.
exclude.selector — same shape as selector, identifies images to skip.
exclude.expiration_days — when set to -1 the exclusion never expires; otherwise, how many days the exclusion remains in effect.
max_images_per_account — may only be set on a single system_global rule. Controls the maximum number of non-archived images a deployment will keep; when the number is exceeded the oldest images are transitioned according to transition.
last_seen_in_days — excludes images with a corresponding runtime-inventory record seen within the specified window, regardless of the exclude selector.
system_global — when true, the rule applies to all accounts and may only be edited by admin-account users. Non-admin accounts can view global rules but cannot modify or delete them.
The required parameters are: minimum age of analysis in days, number of tag versions newer, and the transition to use.
There is also an optional --system-global flag available for admin account users that makes the rule apply to all accounts
in the system. As a non-admin user (test1user below) you can see global rules but you cannot update/delete them (will get a 404):
anchorectl archive rule delete 16dc38cef54e4ce5ac87d00e90b4a4f2
 ✔ Deleted rule
No results
5.5 - Artifact Lifecycle Policies
Artifact Lifecycle Policies are instruction sets which perform lifecycle events on certain types of artifacts.
Each policy can perform an action on a given artifact_type based on configured policy_conditions (rules/selectors).
As an example, a system administrator may create an Artifact Lifecycle Policy that will automatically delete any image that has an analysis date older than 180 days.
Artifact Lifecycle Policies operate only on the image catalog. They do not apply to apps, versions, and assets.
Artifact Lifecycle Policies operate on the working set (the catalog of currently tracked artifacts), not on any archived data. When artifacts are added or updated in the working set, they are ingressed into the reporting dataset. When artifacts are removed from the working set (for example, by a lifecycle policy deletion), they are egressed from the reporting dataset provided enable_data_egress is enabled in the reporting service configuration.
The enable_data_egress setting is enabled by default on later versions of Anchore Enterprise. If it is disabled, removed artifacts will remain in the reporting dataset even after deletion from the working set.
WARNING ⚠️
⚠️ These policies have the ability to delete data without archive/backup. Proceed with caution!
⚠️ These policies are GLOBAL they will impact every account on the system.
⚠️ These policies can only be created and managed by a system administrator.
Policy Components
Artifact Lifecycle Policies are global policies that will execute on a schedule defined by a cycle_timer within the
catalog service. services.catalog.cycle_timers.artifact_lifecycle_policy_tasks has a default time of every 12 hours.
The policy is constructed with the following parameters:
Artifact Type - The type of artifact the policy will act on. The only supported type is image (container images analyzed in Anchore Enterprise).
Inclusion Rules - The set of criteria which will be used to determine the set of artifacts to work on. All criteria must be satisfied for the policy to enact on an artifact.
Policy Actions - After the policy determines a set of artifacts that satisfy the Inclusion Rules, this
is the action which will be performed on them. The current supported action is delete.
Actioned artifacts will have a matching system Event created for audit and notification purposes.
Inclusion Rules
The inclusion rules below describe the API and AnchoreCTL (CLI) settings, which are inclusion-based. The Anchore Enterprise GUI presents these same settings as exclusion-based. For example, checking the “Runtime Images” box in the GUI means images found in the Runtime Inventory will be excluded from the policy — the lifecycle countdown will not start for those images. This is equivalent to setting even_if_exists_in_runtime_inventory to false in the API/CLI.
days_since_analyzed
Selects artifacts whose analyzed_at date is n days old.
If this value is set to less than zero, this rule is disabled.
An artifact that has not been analyzed, either because it failed analysis or the analysis is pending, will not be included.
even_if_exists_in_runtime_inventory
When true, an artifact will be included even if it exists in the Runtime Inventory.
When false, an artifact will not be included if it exists in the Runtime Inventory. Essentially protecting artifacts found in your runtime inventory. Please review the Inventory Time-To-Live for information on how to prune the Runtime Inventory.
include_base_images
When true, images that have ancestral children will be included.
When false, images that have ancestral children will not be included.
Note: These are evaluated per run. As children are deleted, a previously excluded parent image may too become eligible for deletion.
include_failed_analysis
When true, images that are in a failed analysis state will be included.
Note: When the image does not contain an analyzed_at date, the created_at date will be used.
When false, images that are in a failed analysis state will not be included. This is the default behavior.
Policy Interaction
If more than one policy is enabled, each policy will work independently, using its set of rules to determine if any
artifacts satisfy its criteria. Each policy will apply its action on the set of artifacts.
Creating a new Artifact Lifecycle Policy
Due to the potentially destructive nature of these policies every parameter must be explicitly declared when creating a
new policy. This means all policy rules must be explicitly configured or explicitly disabled.
Note: it is possible to request “deleted” policies through this API for audit reasons. The deleted_at field will be null, and enabled will be true if the policy is active.
anchorectl system artifact-lifecycle-policy get 5620b641-a25f-4b1f-966c-929281a41e16
✔ Fetched artifact-lifecycle-policy
Name: 2023-11-22T13:02:24.621Z
Policy Conditions:
- artifactType: image
daysSinceAnalyzed: 1 evenIfExistsInRuntimeInventory: true
includeBaseImages: false
version: 1Uuid: 5620b641-a25f-4b1f-966c-929281a41e16
Action: delete
Deleted At:
Enabled: true
Updated At: 2023-11-22T13:02:24Z
Created At: 2023-11-22T13:02:24Z
Description: test description
Delete a policy
Note: for the purposes of audit the policy will still remain in the system. It will be disabled and marked deleted. This will effectively make it hidden unless explicitly requested by its UUID through the API.
anchorectl system artifact-lifecycle-policy delete 73226831-9140-4d27-a922-4a61e43dbb0d
✔ Deleted artifact-lifecycle-policy
No results
5.6 - Data Feeds
Introduction
In this section, you’ll learn how to configure and manage the data that Anchore Enterprise uses for analysis and vulnerability management. For the underlying concepts, see Anchore Data Service.
Your Anchore Enterprise deployment uses four datasets that are managed by the Anchore Data Service and automatically synced to your deployment by the Data Syncer Service:
Vulnerability Database (vulnerability_db)
Vulnerability Match Exclusions Database (vulnerability_match_exclusions_db)
ClamAV Malware Database (clamav_db)
STIG Profiles (stig_profile_db)
When Anchore Enterprise runs, the Data Syncer Service begins downloading this data from the Anchore Data Service, including CVE data for Linux distributions such as Alpine, CentOS, Debian, Oracle, Red Hat, and Ubuntu. The initial sync typically takes 1-5 minutes depending on your environment and network speed. After that, the Data Syncer Service checks for new data every hour by default. When a new dataset is found, it is downloaded immediately, and the Policy Engine Service is triggered to reprocess the data so it is available for policy evaluations. The analyzer checks the Data Syncer Service for a new ClamAV malware signature database before every malware scan (if enabled).
The following FQDN will need to be allowlisted in your network to allow the Data Syncer Service to communicate with the Anchore Data Service:
https://data.anchore-enterprise.com
Ideally the endpoint can be allowlisted via a layer 7/proxy.
If you are filtering based on IP, please raise a support ticket with Anchore Customer Success so that we can provide you with the IP addresses.
Check Feed Status
Feed information can be retrieved through the API and AnchoreCTL. Use anchorectl feed list to report the feeds synchronized by Anchore Enterprise, the last sync time, and the current record count.
You can initiate a manual sync of the latest datasets, which tells the Data Syncer Service to download the latest feed data from the Anchore Data Service.
anchorectl feed sync
✔ Synced feeds
This also informs the Policy Engine to sync down the new dataset if the Data Syncer Service has successfully downloaded the latest data.
If you want the Data Syncer Service to force a download of the latest datasets and overwrite the existing data, use the --force_sync flag.
anchorectl feed sync --force_sync
✔ Synced feeds
Selective Synchronization
You can exclude certain vulnerability providers and package types from vulnerability matching. This is not a generally recommended practice.
For any deployment which is air-gapped, a release-compatible AnchoreCTL should be used to download the required datasets from the Anchore Data Service and then upload them to your Anchore Enterprise deployment.
Disable Automatic Sync
To configure your Anchore Enterprise deployment to work in an air-gapped environment, you will need to disable the Data Syncer Service’s automatic feed sync.
To confirm auto sync is disabled, the following log is emitted by the data-syncer service upon startup:
[INFO] [anchore_enterprise.services.data_syncer.service/handle_data_sync():33] | Auto sync is disabled. Skipping data sync.
Download and Import Datasets
For downloading and uploading datasets using AnchoreCTL, ensure you have greater than 2 GB of free space in the current working directory of the host system on which you are saving the bundle.
Once installed, AnchoreCTL can be used to download the latest feed data from the Anchore Data Service. This data can then be moved across the air gap and uploaded into your Anchore Enterprise deployment.
Download the Datasets
Run the following command outside your air-gapped environment to download the datasets.
Using your license key:
anchorectl airgap feed download -f <filename> -k <your api key>
Using your license file:
anchorectl airgap feed download -f <filename> -l <path to your license file>
To get your API key, check your license file for a field called apiKey.
This command downloads all the feeds from the hosted service to the file specified by -f.
This command can take some time to return, depending on your connection speed.
The resulting file is approximately 0.5 GB in size as of this writing, but will continue to grow as more data is added to the feeds.
Import the Datasets
Take a copy of this file and move it into your air-gapped environment. Then run the following command to import the feeds into your Anchore Enterprise deployment:
anchorectl airgap feed upload -f <filename>
Your Analyzer Service and Policy Engine Service will now be able to fetch the latest data from the Data Syncer Service as normal.
This procedure must be repeated each time you want to update the datasets in your air-gapped environment.
Use the same file for downloading data every time. AnchoreCTL reads the metadata from the file and determines whether it needs to download any newer data or if you already have the latest. If it does download newer data, the metadata in the file is overwritten with the latest metadata, so you will not have to perform any unnecessary downloads.
Data Feed Availability
A live status page is available for real-time updates on the Anchore Data Service, including information on outages, maintenance, and options for subscribing to notifications.
You can access the status page at https://status.anchore-enterprise.com
The status page is updated in real-time and provides information on the following:
Current Status - The current status of the Anchore Data Service.
Incidents - A list of any ongoing incidents that may be affecting the Anchore Data Service.
Scheduled Maintenance - A list of any upcoming maintenance windows that may affect the Anchore Data Service.
Subscribe to Updates - Options for subscribing to updates via email, SMS, or webhook.
Past Incidents - A list of past incidents that have affected the Anchore Data Service.
Historical Uptime - Historical uptime data for the Anchore Data Service.
The status page does not auto-refresh. You have to refresh it manually to see the latest status.
5.7 - Integration
Overview
Anchore Enterprise exposes an API through which external software entities like inventory
agents can report their health status. These software entities (agents, plugins etc.) serve
as a mechanism for external systems like Kubernetes clusters or container image repositories
to integrate with Anchore Enterprise.
Enterprise refer these software entities simply as integrations. A deployed Kubernetes
Inventory agent is example of an integration instance. A deployed Kubernetes Admission
Controller is another example of an integration instance.
Integration health reporting
An integration instance can send health reports to Anchore Enterprise, which in turn maintains
a record of those health reports. They are used by Enterprise to determine the status of the
integration instances.
An integration instance can send a health report at most every 30 seconds. To prevent
unlimited growth of stored health reports, Anchore’s Catalog Service will prune old health
reports.
The configuration setting below allow you to specify how long health reports should be
kept by Catalog Service. This is the default setting found in the values file.
Anchore Enterprise services produce detailed logs that contain information about user interactions, internal processes, warnings and errors.
Log Destinations
All Anchore Enterprise containers log to both STDOUT/STDERR and to /var/log/anchore within each pod/container. Unstructured logs are written to *.log files, while structured logs are written to *.json files.
Log Level
The verbosity of the logs is controlled using the logging.log_level setting in config.yaml (for manual installations) or the corresponding ANCHORE_LOG_LEVEL environment variable (for docker compose or Helm installations) for each service.
The log levels are DEBUG, INFO, WARNING, ERROR, and CRITICAL, where the default is INFO. Most of the time, the default level is sufficient as the logs will container WARNING, ERROR and CRITICAL messages as well. But for deep troubleshooting, it is always recommended to increase the log level to DEBUG in order to ensure the availability of the maximum amount of information.
Changing Log Level via the API
The log level can be adjusted via the API without having to redeploy services:
The log level can also be modified by a user with the system configuration permissions by navigating to System -> Configuration. Each service’s log level can be configured individually. Example for Analyzer Log Level:
Structured Logging (JSON)
Anchore Enterprise services can be configured to log in JSON format. This is particularly helpful if users ship logs to an external log aggregator.
Helm
With our Helm chart’s values.yaml, users can change the structured logging boolean in the following section:
With Docker Compose, users will need to mount the config.yaml file into the containers with the following section modified to enable structured logging:
Make the modifications in the config.yaml to enable structured logging, and mount it to each service. The following is an example for the API service, but for each service that structured logging needs to be enabled on, the config.yaml will need to be mounted similarly as a volume:
# The primary API endpoint serviceapi:[...]volumes:- ./license.yaml:/license.yaml:ro- ./config.yaml:/config/config.yaml:ro
Audit Logging
Anchore Enterprise includes comprehensive audit logging capabilities that track security-sensitive operations and administrative changes across the system. Audit logs provide a detailed record of who performed what actions, when they occurred, and their outcomes, which is essential for compliance, security monitoring, and forensic analysis.
Overview
Audit logs are generated exclusively by the API service. No other Anchore Enterprise service produces audit log entries.
The audit logging feature captures and records:
User authentication and authorization events
Account and user management operations
RBAC (Role-Based Access Control) changes
API key management
SAML/SSO configuration changes
User group modifications
Audit logs are written to the standard logging output with a special “AUDIT” log level, making them easily distinguishable from regular application logs. Each audit event includes detailed context about the request, the authenticated user, and the response.
Configuration
Helm Chart Configuration
When deploying Anchore Enterprise with Helm, audit logging is configured through the values.yaml file. The audit feature is enabled by default in the Helm chart:
anchoreConfig:# Audit logging configurationaudit:enabled: true # Enable or disable audit logging (default:true)additionalResourceURIs:[]# List of additional resource URIs to audit (available from chart v3.14.2 / Enterprise v5.20.2)# - "/images"# - "/images/{imageDigest}"# - "/registries"# - "/registries/{registry}"
Configuring audit logging for additional URIs (such as /images) can introduce a performance overhead on the system. Consider auditing only your required actions.
The Helm chart automatically configures the full audit settings in the generated config.yaml:
Mode: Set to log (currently the only supported mode)
Verbs: Configured to audit POST, PUT, DELETE, and PATCH operations
Resource URIs: Pre-configured with all security-sensitive endpoints including:
Account management endpoints (/accounts/*)
User management endpoints (/accounts/{account_name}/users/*)
API key endpoints (/user/api-keys/*)
RBAC and role management (/rbac-manager/*)
SAML/SSO configuration (/rbac-manager/saml/*)
User group management (/system/user-groups/*)
Credential endpoints (/user/credentials)
To add additional endpoints to audit beyond the default list (requires Helm chart v3.14.2+ with Anchore Enterprise v5.20.2+):
The additionalResourceURIs field was introduced in Helm chart version 3.14.2 along with Anchore Enterprise version 5.20.2. For earlier versions, you’ll need to use a configOverride to customize the audited endpoints.
Example using configOverride for full customization:
Important Note: When specifying resource URIs (both in configuration files and additionalResourceURIs), do not include the /v2 API version prefix. The audit system automatically handles API versioning. For example:
Correct: /accounts/{account_name}/users
Incorrect: /v2/accounts/{account_name}/users
Environment Variables
For container deployments using Docker Compose, audit logging can be configured using environment variables:
Note: Environment variable configuration for audit logging is limited. For full control over audit settings, including custom resource URIs, you should mount a custom config.yaml file.
Audit Log Format
Each audit log entry contains the following information:
method: HTTP method used (GET, POST, PUT, DELETE, etc.)
url: Full URL of the request
data: Request body data (sanitized for sensitive endpoints)
request_id: Unique identifier for request tracing
auth: Authentication context
username: Username of the authenticated user
account: Account name the user belongs to
response: Details about the response
code: HTTP status code
message: Response message or error details
Sensitive Data Handling
The audit logging system automatically sanitizes sensitive data to prevent exposure of secrets:
Password fields are removed from logged request data
API keys and tokens are redacted
Credentials endpoints have their data completely redacted
Registry passwords, webhook secrets, and SMTP passwords are sanitized
The following endpoints have special handling for sensitive data:
/user/credentials - All data redacted
/accounts/{account_name}/users/{username}/credentials - All data redacted
/oauth/token - Sensitive fields removed
/registries/* - Passwords and credentials sanitized
/notifications/endpoints/*/configurations - Secrets and tokens sanitized
Filtering and Searching Audit Logs
Since audit logs use a special “AUDIT” log level, they can be easily filtered from regular application logs. When using structured logging (JSON format), you can search and filter audit logs using standard log aggregation tools.
Example filtering with grep:
grep "AUDIT" anchore-api.log | jq '.'
Example with journalctl (for systemd-based systems):
journalctl -u anchore-api | grep AUDIT
Compliance and Best Practices
Enable audit logging in production: Always enable audit logging in production environments to maintain a security trail.
Protect audit logs: Ensure audit logs are stored securely and have appropriate access controls. Consider shipping them to a centralized, tamper-resistant logging system.
Regular review: Establish processes to regularly review audit logs for suspicious activities or unauthorized access attempts.
Retention policy: Define and implement a log retention policy that meets your compliance requirements. Many regulations require audit logs to be retained for specific periods.
Monitor failed authentication: Pay special attention to authentication failures (401 responses) which may indicate attempted unauthorized access.
Avoid wildcard auditing: While you can use "*" to audit all endpoints, this is not recommended in production as it can generate excessive log volume and may impact performance.
Troubleshooting
If audit logs are not appearing:
Verify audit logging is enabled in your configuration
Check that the endpoints you’re testing match the configured resource_uris
Ensure the HTTP methods match the configured verbs
Verify the service has been restarted after configuration changes
Check the overall log level - audit logs require at least INFO level logging
5.9 - Custom Certificate Authority
When Anchore Enterprise needs to communicate with external HTTPS endpoints like container registries, Anchore’s data feed service, or LDAP servers. If your environment uses a transparent SSL/TLS inspection proxy (a “man-in-the-middle” proxy) or service endpoints that use a self-signed certificates, you must provide the appropriate Custom Certificate Authority (CA) to avoid SSL/TLS verification errors.
This guide explains how to identify the need for a custom CA as well as how to configure your Docker Compose or Kubernetes deployments to utilize them.
🩺 Diagnosis and Preparation
Before you begin to configure Anchore Enterprise, confirm if a custom CA is necessary. If a CA certificate is required, we show you how to get the certificate for use in later steps.
Do I Need a Custom CA?
You can test for SSL verification issues by running a curl command from a host or container within your environment. If the command fails with a certificate verification error, you likely need to add a custom CA. A good test is to try connecting to Anchore’s public data service feed:
# -v enables verbose output to show SSL handshake detailscurl -v https://data.anchore-enterprise.com
# An error might look like -> curl: (60) SSL certificate problem: self signed certificate in certificate chain indicates a CA is missing.
For private container registries, you can often bypass certificate validation by enabling the “Allow Self-Signed” (skip TLS verify) option in the registry configuration within the Anchore Enterprise GUI or via AnchoreCTL. However, using a custom CA is the more secure and recommended approach.
How Do I Get the CA Certificate?
If you’ve confirmed a custom CA is needed, you can fetch it from the target server using openssl. The certificate should be created with the .pem extension and then mounted into the relevant Anchore Enterprise container(s).
# Replace data.anchore-enterprise.com with your server's hostnameopenssl s_client -showcerts -servername data.anchore-enterprise.com -connect data.anchore-enterprise.com:443 > custom-ca.pem
You can then verify that the fetched certificate works by using it with curl:
# Replace data.anchore-enterprise.com with your server's hostnamecurl -v --cacert custom-ca.pem https://data.anchore-enterprise.com
# A success message might look like -> * SSL certificate verify ok.
You might need to perform this task multiple times if you have a different self-signed certs in use across services as well as tls/ssl proxy in your environment.
🐳 Docker Compose
The entrypoint scripts in the Anchore Enterprise containers are designed to automatically detect and trust any certificates mounted into the /home/anchore/certs directory.
Update your Core Services:
For each Anchore Enterprise service (e.g., api, catalog, policy-engine, etc.), mount your custom-ca.pem file as a volume.
# Add this volume to each core Anchore service in your docker-compose.yamlservices:api:image:docker.io/anchore/enterprise:v5.X.Xvolumes:- ./custom-ca.pem:/home/anchore/certs/custom-ca.pem:ro# ... repeat for other services
Update your UI Service:
The UI service is a Node.js application and requires an additional environment variable, NODE_EXTRA_CA_CERTS, to load the certificate. This cert could be used for connectivity to services such as LDAP.
# Add both the volume and the environment variable to the UI serviceservices:ui:image:docker.io/anchore/enterprise-ui:v5.X.Xvolumes:- ./custom-ca.pem:/home/anchore/certs/custom-ca.pem:roenvironment:- NODE_EXTRA_CA_CERTS=/home/anchore/certs/custom-ca.pem
☸️ Kubernetes (Helm)
For Helm deployments, you first store your certificate(s) in a Kubernetes secret and then reference that secret in your values.yaml.
Create a Kubernetes Secret
Create a generic secret in the same namespace as your Anchore Enterprise deployment. You can include multiple CA certificates in a single secret if needed.
# Replace 'anchore' with your namespace if different# Add multiple --from-file flags for multiple certificateskubectl create secret generic custom-ca-certs \
--from-file=my-registry-ca.pem=./custom-ca.pem \
--from-file=my-ldap-ca.pem=./ldap-ca.pem \
--from-file=my-db-ca.pem=./my-db-ca.pem \
-n anchore
Update your Helm values
Now change your Helm values to use the secret containing the CA cert. The certStoreSecretName key is used to mount the secret’s contents into the trusted certificate path. You can then reference each specific CA certificate file as needed. Once you have modified your values to utilize the secret and relevant CA certificate files, perform a helm upgrade. Below is an example values.yaml configuration:
# Name of secret containing the certificates & keys used for SSL, SAML & CAscertStoreSecretName:"custom-ca-certs"# Example: Reference a specific CA for the UI's LDAPS connectionui:# Setting this creates the required NODE_EXTRA_CA_CERTSldapsRootCaCertName:"my-ldap-ca.pem"# Example: Reference a specific CA for the database connectionanchoreConfig:database:ssl:truesslRootCertFileName:"my-db-ca.pem"
There are other certs you can supply and configure such as anchoreConfig.internalServicesSSL & anchoreConfig.keys.privateKeyFileName
Troubleshooting
You can exec into a pod such as catalog or analyzer to test TLS connectivity to an endpoint.
Please note that shell environment variables are overridden by the container entrypoint when using custom CA’s and therefore you should run the following before testing:
As covered in the Network sections of the requirements document, Anchore Enterprise requires three categories of network connectivity.
Registry Access
Network connectivity, including DNS resolution, to the registries from which Anchore Enterprise needs to download images.
Feed Service
Anchore Enterprise synchronizes feed data such as operating system vulnerabilities (CVEs) from Anchore Cloud Service. See Feeds Overview for the full list of endpoints.
Access to Anchore Enterprise Internal Services
Anchore Enterprise is composed of six smaller services that can be deployed in a single container or scaled out to handle load. Each Anchore Enterprise service should be able to connect the other services over the network.
In environments were access to the public internet is restricted then a proxy server may be required to allow Anchore Enterprise to connect to Anchore Cloud Feed Service or to a publicly hosted container registry.
Anchore Enterprise can be configured to access a proxy server by using environment variables that are read by Anchore Enterprise at run time.
https_proxy:
Address of the proxy service to use for HTTPS traffic in the following form: {PROTOCOL}://{IP or HOSTNAME}:{PORT}
eg. https://proxy.corp.example.com:8128
http_proxy: Address of the proxy service to use for HTTP traffic in the following form: {PROTOCOL}://{IP or HOSTNAME}:{PORT} eg. http://proxy.corp.example.com:8128
no_proxy: Comma delimited list of hostnames or IP address which should be accessed directly without using the proxy service.
eg. localhost,127.0.0.1,registry,example.com
Environment Variables to Control Proxy Behavior
Setting the endpoints to HTTP proxy:
Set both HTTP_PROXY and http_proxy environment variables for regular HTTP protocol use.
Set both HTTPS_PROXY and https_proxy environment variables for HTTP + TLS (HTTPS) protocol use.
Setting endpoints to exclude from proxy use:
Set both NO_PROXY and no_proxy environment variables to exclude those domains from proxy use defined in the preceding proxy configurations.
If using Docker Compose these need to be set in each service entry.
If using Helm Chart, set these in the extraEnv entry for each service.
Notes:
Do not use double quotes (") around the proxy variable values.
Authentication
For proxy servers that require authentication the username and password can be provided as part of the URL:
When setting up a network proxy, keep in mind that you will need to explicitly allow inter-service communication within the Anchore Enterprise deployment to bypass the proxy, and potentially other hostnames as well (e.g. internal registries) to ensure that traffic is directed correctly. In general, all Anchore Enterprise service endpoints (the URLs for enabled services in the output of an ‘anchorectl system status’ command) as well as any internal registries (the hostnames you may have set up with ‘anchorectl registry add –username …’ or as part of an un-credentialed image add ‘anchorectl image add registry:port/….’), should not be proxied (i.e. added to the no_proxy list, as described above).
If you wish to tune this further, below is a list of each component that makes an external URL fetch for various purposes:
Catalog: makes connections to image registries (any host added via ‘anchorectl registry add’ or directly via ‘anchorectl image add’)
Analyzer: same as catalog
Data Syncer: by default connects to Anchore Data Service for downloading vulnerability datasets. See Data Feeds and Data Synchronization for more details.
5.11 - TLS / SSL
The following sections describe how to configure TLS for Anchore API and/or Anchore Enterprise Services.
Please note that the UI service currently does not support listening via TLS.
Internal TLS for Anchore Enterprise Services Helm deployments
graph TB
subgraph External Traffic
user[User]
kubernetes[Ingress Controller]
end
subgraph Services with Internal TLS
api[API]
policy[Policy]
catalog[Catalog]
analyzer[Analyzer]
reports[Reports]
reportsworker[Reports Worker]
notifications[Notifications]
dataSyncer[Data Syncer]
simplequeue[Simple Queue]
end
subgraph Services Without TLS
ui[UI]
end
user -- HTTP/HTTPS --> kubernetes
kubernetes -- HTTPS --> api
kubernetes -- HTTP --> ui
api <--> policy
api <--> catalog
api <--> analyzer
api <--> reports
api <--> reportsworker
api <--> notifications
api <--> dataSyncer
api <--> simplequeue
policy <--> catalog
catalog <--> analyzer
analyzer <--> reports
reports <--> reportsworker
reportsworker <--> notifications
notifications <--> dataSyncer
dataSyncer <--> simplequeue
The following will configure Anchore Enterprise internal services to communicate with one another via TLS.
This script (for Linux) is provided as a demonstration of how to generate certificates (generate-anchore-tls-certs.sh):
If Custom CA certificates are required for LDAP or Postgres be sure to append them to the anchore-tls/ca-cert.crt & anchore-tls/anchore.pem file.
The script can be called as follows:
chmod +x generate-anchore-tls-certs.sh
# Provide values for your kubernetes namespace containing anchore and your helm release./generate-anchore-tls-certs.sh $NAMESPACE$RELEASE
Make the following adjustments in your helm values file:
You will need to perform a Helm install or upgrade to apply all the changes and restart all the pods.
If using an ingress controller see the next section.
Separating API & UI Ingress for Helm deployments
If you are using ingress to access Anchore Enterprise API & Anchore Enterprise GUI then you will need to separate the ingress configuration if you configure either External or Internal TLS.
Since API supports TLS and UI does not once TLS is enabled for API the ingress controller will need to send encrypted traffic to API and unencrypted traffic to UI.
Make the following change to your helm values file to configure the ingress to use TLS to communicate with the API service:
ingress:annotations:nginx.ingress.kubernetes.io/backend-protocol:"HTTPS"# These are for other reasons besides internal TLSnginx.ingress.kubernetes.io/proxy-body-size:'0'nginx.ingress.kubernetes.io/proxy-read-timeout:'600'nginx.ingress.kubernetes.io/proxy-send-timeout:'600'uiHosts:- anchore-api.yourdomain.com
Add an ingress directly in kubernetes for the UI:
apiVersion:networking.k8s.io/v1kind:Ingressmetadata:name:anchore-ingress-uiannotations:# These are for other reasons besides internal TLSnginx.ingress.kubernetes.io/proxy-body-size:'0'nginx.ingress.kubernetes.io/proxy-read-timeout:'600'nginx.ingress.kubernetes.io/proxy-send-timeout:'600'spec:ingressClassName: nginx # NOTE:This could be another value such as albtls:[]rules:- host:anchore-ui.yourdomain.comhttp:paths:- path:/pathType:Prefixbackend:service:name:anchore-enterprise-ui# Ensure this matches the name of the Anchore UI serviceport:number:80
Please note that configuring Internal TLS above also includes External TLS. If you performed the steps above then this is not necessary.
In the following example the external API service is configured to listen on port 443 and is configured with a certificate for its external hostname anchore.example.com
Each service published in the Anchore Enterprise configuration (apiext, catalog, simplequeue, analyzer, policy_engine and kubernetes_webhook) can be configured to use transport level security.
IP address of interface on which the service should listen (use ‘0.0.0.0’ for all - default)
port
Port on which service should listen.
ssl_enable
Enable transport level security
ssl_cert
name, including full path of private key file.
ssl_chain
[optional] name, including full path of certificate chain
The certificate files should be placed on a path accessible to the Anchore Enterprise service, for example in the /config directory which is typically mapped as a volume into the container. Note that the location outside the container will depend on your configuration - for example if you are volume mounting ‘/path/to/aevolume/config/’ on the docker host to ‘/config’ within the container, you’ll need to place the ssl files in ‘/path/to/aevolume/config/’ on the docker host, so that they are accessible in ‘/config/’ inside the container, before starting the service.
The ssl_chain file is optional and may be required by some certificate authorities. If your certificate authority provides a chain certificate then include it within the configuration.
Note: While a certificate may be purchased from a well-known and trusted certificate authority in some cases the certificate is signed by an intermediate certificate which is not included within a TLS/SSL clients trust stores. In these cases the intermediate certificate is signed by the certificate authority however without the full ‘chain’ showing the provenance and integrity of the certificate the TLS/SSL client may not trust the certificate.
Any certificates used by the Anchore Enterprise services need to be trusted by all other Anchore Enterprise services.
If an internal certificate authority is used the root certificate for the internal CA can be added to the Anchore Enterprise using the following procedure or SSL verification can be disabled by setting the following parameter:
internal_ssl_verify: True
5.12 - Notifications
Overview
Alert external endpoints (Email, GitHub, Slack, and more) about Anchore events such as policy evaluation results, vulnerability updates, and system errors with our new Notifications service. Configure notification endpoints and manage which specific events you need through Anchore Enterprise GUI.
For more information on the Notifications Service in general, its concepts, and details on its configuration, please refer to the Notifications Service.
The following sections in this document describe the current endpoints available for configuration, the options provided for selecting events, the various actions you can do with a configuration (add, edit, test, and remove), and how to disable an endpoint as an admin.
Anchore Enterprise includes Notifications service to alert external endpoints about the system’s activity. Services that make up Anchore Enterprise generate events to record significant activity, such as an update, in the policy evaluation result or vulnerabilities for a tag, or an error analyzing an image. This service provides a mechanism to selectively notify events of interest to supported external endpoints. The actual notification itself depends on the endpoint - formatted message to Slack, email and MS Teams endpoints, tickets in GitHub and Jira endpoints, and JSON payload to webhook endpoint.
Glossary
Event
An information packet generated by Anchore Enterprise service to indicate some activity.
Endpoint
External tool capable of receiving messages such as Slack, GitHub, Jira, MS Teams, email or webhook.
Endpoint Configuration
Connection information of the endpoint used for sending messages.
Selector
Criteria for selecting events to be notified.
Installation
Anchore Enterprise Notifications is included with Anchore Enterprise, and is installed by default when deploying a trial quickstart with Docker Compose, or a production deployment Kubernetes.
Configuration
Enterprise Notifications Service
The service loads configuration from the notifications section of the config.yaml. See the following snippet of the configuration:
...services:notifications:enabled:truerequire_auth:trueendpoint_hostname:"<hostname>"listen:'0.0.0.0'port:8228cycle_timers:notifications:30# Set Anchore Enterprise GUI base URL to receive UI links in notificationsui_url:"<enterprise-ui-url>"
The cycle_timers -> notifications controls how often the service checks for events in the system that need to be processed for notifications. Default is every 30 seconds.
The ui_url is used for constructing links to Enterprise UI pages in the notifications. Configure this property to the Enterprise UI’s base URL. This URL should be accessible from the endpoint receiving the notification for the links to work correctly. If the value is not set, the notification message is still be sent to the endpoint, but it won’t contain a clickable link to the Enterprise UI.
Any changes to the configuration require a restart of the service for the updates to take effect.
RBAC Permissions
In the Anchore Enterprise deployment, the table below lists the required actions and containing roles:
Description
Action
Roles
List all the available notification endpoints and their status
listNotificationEndpoints
Read Only, Read Write
List all available configurations for an endpoint
listNotificationEndpointConfigurations
Read Only, Read Write
Get an endpoint configuration and associated selectors
getNotificationEndpointConfiguration
Read Only, Read Write
Create an endpoint configuration and associated selectors
createNotificationEndpointConfiguration
Read Write
Update an endpoint configuration and associated selectors
updateNotificationEndpointConfiguration
Read Write
Delete an endpoint configuration and associated selectors
deleteNotificationEndpointConfiguration
Read Write
External Tools
To send notifications to an external tool/endpoint, the service requires connection information to that endpoint. See the following for the required information for each endpoint:
All endpoints in the Notifications service can be toggled as Enabled or Disabled. The endpoint status reflects the enabled or disabled state. By default, the status for all endpoints is enabled by default. Setting the endpoint status to disabled stops all notifications from going out to any configurations of that specific endpoint. This is a system-wide setting that can only be updated by the admin account. It is read-only for remaining accounts.
Endpoint Configuration
The endpoint configuration is the connection information such as URL, user credentials, and so on for an endpoint. The service allows multiple configurations per endpoint. Endpoint configurations are scoped to the account.
Selector
The services provides a mechanism to selectively choose notifications and route them to a configured endpoint. This is achieved using a Selector, which is a collection of filtering criteria. Each event is processed against a Selector to determine whether it is a match or not. If the Selector matches the event, a notification is sent to the configured endpoint by the service.
For a quick list of useful notifications and associated Selector configurations, see Quick Selection.
A Selector encapsulates the following distinct filtering criteria: scope, level, type, and resource type. Some allow a limited set of values, and others wildcards. The value for each criteria has to be set for the matching to compute correctly.
Scope
Allowed values: account, global
Events are scoped to the account responsible for the event creation.
account scope matches events associated with a user account.
global scope matches events of any and all users. global scope is limited to admin account only. Non-admin account users can only specify account as the scope.
Level
Allowed values: info, error, *
Events are associated with a level that indicates whether the underlying activity is informational or resulted in an error. - info matches informational events such as policy evaluation or vulnerabilities update, image analysis completion and so on.
error matches failures such as image analysis failure.
* will match all events.
Type
Allowed values: strings with or without regular expressions
Event types have a structured format <category>.<subcategory>.<event>. Thus, * matches all types of events. Category is indicative of the origin of the event.
system.* matches all system events.
user.* matches events that are relevant to individual consumption.
Omitting an asterisk will do an exact match. See the GET /event_types route definition in the external API for the list of event types.
In most cases, events are generated during an operation involving a resource. Resource type is metadata of that resource. For instance image_tag is the resource type in a policy evaluation update event. * matches all resource types if you are uncertain what resource type to use.
Quick Selection
The following Selector configurations are for notifying a few interesting events.
Receive
Scope
Level
Type
Resource Type
Policy evaluation and vulnerabilities updates
account
*
user.checks.*
*
User errors
account
error
user.*
*
User infos
account
info
user.*
*
Everything user related
account
*
user.*
*
System errors
account
error
system.*
*
System infos
account
info
system.*
*
Everything system related
account
*
system.*
*
All
account
*
*
*
All for every account (admin account only)
global
*
*
*
Notifications UI Walkthrough
Supported Endpoints
Email
Send notifications to a specific SMTP mail service.
GitHub
Version control for software development using Git.
JIRA
Issue tracking and agile product management software by Atlassian.
Slack
Team collaboration software tools and online services by Slack Technologies.
Teams
Team collaboration software tools and online services by Microsoft.
Webhook
Send notifications to a specific API endpoint.
Event Selector Options
When adding or editing a configuration, selecting which events to be notified on can be as easy as choosing one of the above three options: All Notification Events, Policy & Vulnerability Events, or Error Events.
Advanced users can select Add Custom Selector for more granularity:
In the example shown, we configure to be notified on all system info events affecting any resource associated with the user’s account. For an in-depth explanation on the provided properties and their possible values, view our Selector documentation.
Adding a Configuration
If you haven’t already defined a configuration for an endpoint, simply click Let’s Add One! as shown above. Once you have, add additional configurations with Add New Configuration as shown below.
Upon doing so, a modal will appear with various properties shown on the left side. Note that based on the type of endpoint, these properties may differ.
To view the various requirements, check the documentation for Email, GitHub, JIRA, Slack, and Teams.
For more information on adding a custom selector, please view our Selector documentation.
Prior to saving your new configuration, feel free to test with the Test Configuration button. Then save with OK.
Note: If OK is not enabled, be sure all required fields have been filled out.
Editing a Configuration
The process to edit a configuration entry is started by clicking Edit which is found within the Actions column as shown above.
The various fields available for editing are the same shown when adding the configuration. For additional info on a specific field, hover over the provided question icon circled with an orange ring next to the field name.
At any time, you can select Cancel to disregard any changes you’ve made.
For testing any new changes prior to saving them, click Test Configuration.
To save your changes, click OK. If OK is not enabled, be sure all required fields have been filled out.
Testing a Configuration
When viewing your configurations, testing is easy - just look under the Actions column and click Test for that entry.
Otherwise, when adding or editing a configuration, search for the test button pictured above. It can be found near the bottom of the modal, next to the Cancel and OK buttons.
Removing a Configuration
To remove a specific notification configuration, simply click on the Remove button (as shown above) within the Actions column for that entry.
Select Yes to proceed with the deletion process or No to cancel. Please note that once you agree to remove the configuration, you won’t be able to recover it.
Admin-specific Actions
Disabling Endpoints
As an admin, navigate to System > Notifications and click on the toggle visible in the lower-right corner of the specific endpoint you’re aiming to disable.
By default, all endpoints (such as Email, Slack, and Webhook) are enabled out of the box. Disabling a specific endpoint requires admin privileges as it ensures all notifications are stopped from going out to any configuration for that endpoint system-wide.
Note that users are still able to add, edit, test, and remove notification configuration items, but no event messages will be sent for that endpoint until it is re-enabled.
5.12.1 - Slack
Notifications to Slack are in the form of messages to a channel.
Create a Microsoft Teams endpoint configuration in the Notifications service either via Enterprise UI, or the API directly. To support the new Teams Workflows (Power Automate), Anchore treats both 200 OK and 202 Accepted responses from Teams as successful notifications.
Refer to Notifications to configure the webhook within Anchore Enterprise.
5.12.6 - Webhook
Anchore Enterprise uses outgoing webhooks to send event notifications to external services. When a webhook is triggered, Anchore makes a POST request to the registered URL.
For internet connected systems you may wish to test your webhooks with https://webhook.site/
Headers
Header
Value
Content-Type
application/json
Authorization
Basic (if configured)
User-Agent
python-requests/x.x.x
Accept
/
Payload Example
The following represents a payload example in the body of the webhook POST request:
According to the example above, the fields are described as follows:
Field
Description
id
Unique identifier of the webhook event
type
Event type (e.g., system.test.random_wisdom, policy_eval, analysis_update)
level
Severity level (info, warn, error)
message
Human-readable description of the event
details
Object containing additional event-specific data
Details regarding where the resource and event type:
Field
Description
timestamp
Event timestamp in ISO-8601 format
account_name
Anchore Enterprise account where the event originated
type
Type of resource (e.g., wisdom, image, policy)
id
Identifier for the resource (nullable)
Details regarding the source of the event:
Field
Description
request_id
ID of the request (nullable)
service_name
Anchore Enterprise service that generated the event
host_id
Pod or container identifier
base_url
Base URL of the Anchore Enterprise API
Example Payload
{
"id": "211c5fff5641456d935e60f905c46a66",
"type": "system.test.random_wisdom",
"level": "info",
"message": "Unsolicited random wisdom of the moment",
"details": {
"msg": "It is better to keep your mouth closed and let people think you are a fool than to open it and remove all doubt - Mark Twain" },
"timestamp": "2025-10-01T09:08:54.749806",
"resource": {
"account_name": "admin",
"type": "wisdom",
"id": null },
"source": {
"request_id": null,
"service_name": "apiext",
"host_id": "anchore-enterprise-api-b7d8c686b-p6wbr",
"base_url": "http://anchore-enterprise-api.anchore.svc.cluster.local:8228" }
}
Example of failed analysis
This is a notification due to an image not found in registry.
{
"id": "5fb694f3c245447cb1302ec412b490fe",
"source": {
"service_name": "catalog",
"host_id": "anchore-enterprise-catalog-5654fb8d84-5ln8r",
"base_url": "http://anchore-enterprise-catalog.anchore.svc.cluster.local:8082",
"request_id": null },
"resource": {
"account_name": "admin",
"id": "docker.io/sopuru24/alpine:latest",
"type": "image_reference" },
"type": "system.image_analysis.registry_lookup_failed",
"level": "error",
"message": "Referenced image not found in registry",
"details": {
"anchore_error_json": {
"message": "cannot fetch image digest/manifest from registry",
"detail": {
"raw_exception_message": "could not get manifest/digest for image (docker.io/sopuru24/alpine:latest) from registry (https://index.docker.io) - error: Error encountered in skopeo operation. cmd=/bin/sh -c skopeo inspect --raw --tls-verify=true --creds \"${SKOPUSER}\":\"${SKOPPASS}\" docker://docker.io/sopuru24/alpine:latest, rc=2, stdout=None, stderr=b'time=\"2025-10-01T10:43:27Z\" level=fatal msg=\"Error parsing image name \\\\\"docker://docker.io/sopuru24/alpine:latest\\\\\": reading manifest latest in docker.io/sopuru24/alpine: manifest unknown\"\\n', error_code=REGISTRY_IMAGE_NOT_FOUND",
"error_codes": []
},
"httpcode": 400 }
},
"timestamp": "2025-10-01T10:43:27.011960Z"}
5.13 - Reports
Overview
Anchore Enterprise Reports aggregates data to provide insightful analytics and metrics for account-wide artifacts.
The service employs GraphQL to expose a rich API for querying the aggregated data and metrics.
This service captures a snapshot of artifacts in Anchore Enterprise at a given point in time. Therefore, analytics and metrics computed by the service are not in real time, and may not reflect most up-to-date state in Anchore Enterprise.
Installation
Anchore Enterprise Reports is included with Anchore Enterprise, and is installed by default when deploying a trial
quickstart with Docker Compose, or a production deployment
Kubernetes.
How it works
One of the main functions of Anchore Enterprise Reports is aggregating data. The service keeps a summary of all current
and historical images and tags for every account known to Anchore Enterprise. It also maintains vulnerability reports
and policy evaluations generated using the active bundle for all the images and tags respectively.
Anchore Enterprise Reports shares a persistence layer with Anchore Enterprise. Ensure sufficient storage is provisioned.
Configuration
Anchore Enterprise Reports are broken up into two services:
The reports_worker service which is responsible for the ingress and egress of data into our reports.
The reports service which is responsible for the report generation.
Each service has a configuration section in the values file. Below are sample configurations and the default values.
...services:reports_worker:# Set enable_data_ingress to true for periodically syncing data from anchore enterprise into the reports serviceenable_data_ingress:true# Set enable_data_egress to true to periodically remove reporting data that has been removed in other parts of systemenable_data_egress:false# data_egress_window defines a number of days to keep reporting data following its deletion in the rest of system.# Default value of 0 will remove it on next task rundata_egress_window:0# data_refresh_max_workers is the maximum number of concurrent threads to refresh existing results (etl vulnerabilities and evaluations) in reports service. Set non-negative values greater than 0, otherwise defaults to 10data_refresh_max_workers:10# data_load_max_workers is the maximum number of concurrent threads to load new results (etl vulnerabilities and evaluations) to reports service. Set non-negative values greater than 0, otherwise defaults to 10data_load_max_workers:10cycle_timers:# Timers that describe how often each operation should runreports_image_load:600# MIN 300 MAX 100000 Default 600reports_tag_load:600# MIN 300 MAX 100000 Default 600reports_runtime_inventory_load:600# MIN 300 MAX 100000 Default 600reports_extended_runtime_vuln_load:1800# MIN 300 MAX 100000 Default 1800reports_image_refresh:7200# MIN 3600 MAX 100000 Default 7200reports_tag_refresh:7200# MIN 3600 MAX 100000 Default 7200reports_metrics:3600# MIN 1800 MAX 100000 Default 3600reports_image_egress:600# MIN 300 MAX 100000 Default 600reports_tag_egress:600# MIN 300 MAX 100000 Default 600runtime_report_generation:# Provides the ability to enable/disable individual runtime report loading.inventory_images_by_vulnerability:truevulnerabilities_by_k8s_namespace:truevulnerabilities_by_k8s_container:truevulnerabilities_by_ecs_container:truereports:# GraphiQL is a GUI for editing and testing GraphQL queries and mutations.# Set enable_graphiql to true and open http://<host>:<port>/v2/reports/graphql in a browser for reports APIenable_graphiql:true# This is the number of execution threads which will be used during report generation.max_async_execution_threads:1# Configure async_execution_timeout to adjust how long a scheduled query must be running for before it is considered timed out# This may need to be adjusted if the system has large amounts of data and reports are being prematurely timed out.# The value should be a number followed by "w", "d", or "h" to represent weeks, days or hoursasync_execution_timeout:"48h"# Set use_volume to `true` to have the reports worker buffer report generation to disk instead of in memory. This should be configured# in production systems with large amounts of data (10s of thousands of images or more). Scratch volumes should be configured for the reports pods# when this option is enabled.use_volume:false
Any changes to the configuration requires a restart of the service for the updates to take effect.
In an Anchore Enterprise deployment, any non-admin account user must at least have listImages permission
to execute queries against Reports API. There RBAC Role available called report-admin which provides permissions to administer reports and schedules. Please see Role-Based Access Control
for more information.
Data ingress
Reports_worker service handles data ingress from Anchore Enterprise via the following asynchronous processes triggered
periodically:
Loader: Compares the working set of images and tags in Anchore Enterprise with its own records. Based on the
difference, images and tags along with the vulnerability report and policy evaluations are loaded into the service.
Artifacts deleted from Anchore Enterprise are marked inactive in the service.
This process is triggered periodically as described by the cycle timers listed above.
Refresher: Refreshes the vulnerability report and policy evaluations of all the images and tags actively
maintained by the service.
This process is triggered periodically as described by the cycle timers listed above.
Reports service may miss updates to artifacts if they are added and deleted in between consecutive ingress processes.
Data ingress is enabled by default. It can be turned off with enable_data_ingress: false in the config.yaml snippet
shown previously. In a quickstart deployment, add ANCHORE_ENTERPRISE_REPORTS_ENABLE_DATA_INGRESS=false to the
environment variables section of the reports service in docker-compose.yaml. When the ingress is turned off, Reports
service will no longer aggregate data from Anchore Enterprise, metric computations will also come to a halt. However,
the service will continue to serve API requests/queries with the existing data.
Data egress
It is highly recommended that data egress is enabled and that an egress window value is set to prevent exponential DB growth. Removing old data from the system helps reduce DB disk size.
Provides the ability to remove data which is no longer active in Anchore Enterprise from the stored report data.
This process is disabled by default and controlled by the value enable_data_egress. A configuration setting to determine how old this data is prior to its removal data_egress_window is also available.
Metrics
Reports service comes loaded with a few pre-defined/canned metric definitions. A metric definition consists of an
identifier, readable name, description and the type of the metric. The type is loosely based on statsd metric types.
Currently, all the pre-defined metrics are of type ‘counter’ - a measure of the number of items that match certain
criteria. A value for each of these metric definitions is computed using the data aggregated by the service.
All metric values are computed periodically every hour (3600 seconds). To modify the interval, update
cycle_timers -> reports_metrics in the config.yaml snippet above. In a quickstart deployment, add
ANCHORE_ENTERPRISE_REPORTS_METRICS_INTERVAL_SEC=<interval-in-seconds> to the environment variables section of the
reports service in docker-compose.yaml.
See it in action
To see Reports service in the Enterprise UI, see Dashboard or
Reporting & Remediation view. The dashboard view utilizes metrics generated by the
service and renders customizable widgets. The reports view employs graphQL queries and aggregates the results into
multiple formats (CSV, JSON, and so on).
Using Anchore’s runtime inventory agents provides Anchore Enterprise access to what images are being used
in your deployments. This can help give insight into where vulnerabilities or policy violations are in your
production workloads.
Agents
Anchore Enterprise provides agents for collecting the inventory of different container runtime environments:
As part of reporting on your runtime environment, Anchore Enterprise maintains an active record of the containers, the images they run,
and other related metadata based on time they were last reported by an inventory agent.
The configuration setting below allow you to specify how long inventory should remain part of the Catalog Service’s working set.
These are the default settings found in the values file.
For each cluster/namespace reported from the inventory agent, the system will delete any previously reported
containers and images and replace it with the new inventory.
Note: The inventory_ttl_days is still needed to remove any cluster/namespaces that are no longer reported as well as
some of the supporting metadata (ie. pods, nodes). This value should be configured to be long enough that inventory isn’t incorrectly removed in case of an outage from the reporting agent.
The exact value depends on each deployment, but 7 days is a reasonable value here.
This will delete any container and image that has not been reported by an agent in the last 14 days. This includes its supporting metadata (ie. pods, nodes).
This will keep any containers, images, and supporting metadata reported by an inventory agent indefinitely.
Deleting Inventory via API
Where it is not desirable to wait for the Image TTL to remove runtime inventory images it is possible to manually delete inventory items via the API by issuing a DELETE to /v2/inventories with the following query parameters.
inventory_type (required) - either ecs or kubernetes
context (required) - it must match a context as seen by the output of anchorectl inventory list
Kubernetes - this is a combination of cluster name (as defined by the anchore-k8s-inventory config) and a namespace containing running containers e.g. cluster1/default.
ECS - this is the cluster ARN e.g. arn:aws:ecs:eu-west-2:123456789012:cluster/myclustername
image_digest (optional) - set if you only want to remove a specific image
e.g. DELETE /v2/inventories?inventory_type=<string>&context=<string>&image_digest=<string>
Using curl: curl -X DELETE -u username:password "http://<servername:port>/v2/inventories?inventory_type=&context=&image_digest=
5.15 - Scanning
Introduction
This section describes common configuration options for image and SBOM scanning.
Limiting Image Size
Anchore Enterprise can be configured to have a size limit for images being added for analysis. Images that exceed the configured maximum size will not be added to Anchore Enterprise and the catalog service will log an error message providing details of the failure. This size limit is applied when adding images to Anchore Enterprise via AnchoreCTL, tag subscriptions, and repository watchers.
By default the max_compressed_image_size_mb feature is disabled.
This limit can be enabled via the max_compressed_image_size_mb property in the Anchore Enterprise configuration file or by using the ANCHORE_MAX_COMPRESSED_IMAGE_SIZE_MB env variable.
When a value greater than zero is supplied, the value represents the size limit in MB of the compressed image.
When a value less than zero is supplied, it will disable the feature and allow images of any size to be added to Anchore Enterprise.
A value of 0 will prevent any images from being added.
Finally, non-integer values will cause bootstrap of the service to fail.
If using Docker Compose with the default config, this can be set through the ANCHORE_MAX_COMPRESSED_IMAGE_SIZE_MB env variable on the catalog service.
If using Helm, it can be configured by using the values file and adding the ANCHORE_MAX_COMPRESSED_IMAGE_SIZE_MB env variable to the catalog.extraEnv property.
Malware Scanning
When an image is analyzed you have the ability to configure the process to best suit your particular use case and/or desired security control. After discovery these data can later be used within the Anchore Enterprise policy engine rules and gates. For an overview of what malware scanning does and when it runs, see Images.
Malware scanning is powered by ClamAV and runs during Centralized Analysis. Findings are available via:
API endpoint: GET /v2/images/{image_digest}/content/malware
By default each analyzer service refreshes its ClamAV signature database before scanning each image. This adds latency but ensures signatures are as up-to-date as possible. The update can be disabled if you prefer to manage signature freshness another way — for example, via a shared filesystem that is updated on a schedule and mounted into every analyzer node. See Enabling & Disabling below for the db_update_enabled flag.
The result of the database update is recorded in every scan’s metadata.db_update_enabled and metadata.db_version fields. When updates are disabled, db_version will not be populated, as the version numbers are only obtained during a refresh.
Scan Result Structure
The malware content type returned by the API is a list of scan results. Each result records the files matched, the scanner that produced it (ClamAV by default), and metadata about the signatures used.
An empty findings array indicates no malware was detected.
Malware scanning can be configured via the Anchore Enterprise GUI as well as the methods documented below. To enable it in the GUI, go to System -> Configuration, search for Malware, and click the check button to enable the feature.
Limitations and Resource Usage
Malware scanning will impact analysis/scanning time, and this time will depend on the size and number of files the image contains. Anchore Enterprise supports sources, however, sources currently need to be analyzed with Syft and not AnchoreCTL. Syft does not currently support malware checks. Where possible, and use case depending, you should offload to Distributed Scanning/Analysis to reduce analyzer compute load on your central Anchore Deployment.
Anchore Enterprise 5.13 and above supports scanning of images greater than 2GB in size through splitting images for analysis.
Malware scanning can ONLY operate when using Centralized Analysis and NOT Distributed Analysis.
ClamAV scan timeout has been increased from 2 minutes to 30 minutes in order to accommodate malware scanning for larger images. This can be changed through the max_scan_time parameter in the Helm chart.
Enabling & Disabling
The process for enabling and configuring the Malware scan differs between Helm and Compose deployments. Additionally, there are two modes in which you can scan and analyze images, and therefore two places to configure this capability: 1. Distributed Mode 2. Centralized Mode.
For Centralized Analysis, Malware scans are configured in the centralized Anchore Enterprise Deployment via the Analyzer config documented on this page.
Helm
Update the Helm values.yaml file. Below is an example configuration for enabling Malware scanning. Helm will take these values and define a ConfigMap in your Anchore Enterprise Kubernetes deployment.
Malforming this file can cause the Anchore Enterprise Analyzer to fail on all image analysis!
anchoreConfig:analyzer:configFile:## Malware scanning occurs only at analysis time when the image content itself is availablemalware:clamav:# Set to true to enable the malware scanenabled:true# Set to true to enable the db refresh on each scandb_update_enabled:true# Maximum time in milliseconds that ClamAV scan is allowed to run (default is 30 minutes)max_scan_time:1800000
Please review the helm chart example values.yaml file for further detail.
Docker Compose
The Malware scan can be configured and enabled in the ‘analyzer_config.yaml’ file. This file needs to then be mounted as a file volume in your Anchore Enterprise Docker Compose file under the analyzer: service as shown below:
This file should contain the required configuration parameters. Please see the following example and adjust as required.
malware:clamav:# Set this to true to enable the malware scanenabled:true# Set this to false to turn off the db refresh on each scandb_update_enabled:true
Cataloger Scanning
During Analysis/Scans of your images, Anchore Enterprise has the ability to run extra catalogers or searches. These are as follows:
retrieve_files - retrieve and index files matching a configured file list
secret_search and content_search - perform a search across file contents for a configured regexp match. Findings are then cataloged accordingly.
Limitations and Resource Usage
Running extra catalogers will require more resources and time to perform analysis of images. Please take this into consideration when enabling and defining your regexp values.
This can be controlled by limiting the search with MAXFILESIZE to limit the search to large and/or very small files.
Catalogers will impact analysis/scanning time, and this time will depend on the size and number of files the image contains. Anchore Enterprise supports sources, however, sources currently need to be analyzed with Syft and not AnchoreCTL. Syft does not currently support catalogers. Where possible, and use case depending, you should offload to Distributed Scanning/Analysis to reduce analyzer compute load on your central Anchore Deployment.
Enabling & Disabling
The process for enabling and configuring the catalogers differs between Helm and Compose deployments. Additionally, there are two modes in which you can scan and analyze images: 1. Distributed Mode 2. Centralized Mode.
For Distributed Analysis, the catalogers are configured in the AnchoreCTL Configuration.
For Centralized Analysis, the catalogers are configured in the centralized Anchore Enterprise Deployment via the Analyzer config documented below.
Helm
Update the Helm values.yaml file. Below is an example configuration for enabling retrieve_files and secret_search catalogers. Helm will take these values and define a ConfigMap in your Anchore Enterprise Kubernetes deployment.
Malforming this file can cause the Anchore Enterprise Analyzer to fail on all image analysis!
anchoreConfig:analyzer:malware:configFile:retrieve_files:file_list:- '/etc/passwd'secret_search:match_params:- MAXFILESIZE=10000regexp_match:- "AWS_ACCESS_KEY=(?i).*aws_access_key_id( *=+ *).*(?<![A-Z0-9])[A-Z0-9]{20}(?![A-Z0-9]).*"- "AWS_SECRET_KEY=(?i).*aws_secret_access_key( *=+ *).*(?<![A-Za-z0-9/+=])[A-Za-z0-9/+=]{40}(?![A-Za-z0-9/+=]).*"- "PRIV_KEY=(?i)-+BEGIN(.*)PRIVATE KEY-+"- "DOCKER_AUTH=(?i).*\"auth\": *\".+\""- "API_KEY=(?i).*api(-|_)key( *=+ *).*(?<![A-Z0-9])[A-Z0-9]{20,60}(?![A-Z0-9]).*"# - "ALPINE_NULL_ROOT=^root:::0:::::$"### Uncomment content_search: {} to configure file content searching# Very expensive operation - recommend you carefully test and review# content_search:# match_params:# - MAXFILESIZE=10000# regexp_match:# - "EXAMPLE_MATCH="
Please review the helm chart example values.yaml file for further detail.
Docker Compose
The Catalogers can be configured and enabled in the ‘analyzer_config.yaml’ file. This file needs to then be mounted as a file volume in your Anchore Enterprise Docker Compose file under the analyzer: service as shown below:
This file should contain the required configuration parameters. Please see the following example and adjust as required.
retrieve_files:max_file_size_kb:1000file_list:- '/etc/passwd'- '/etc/services'- '/etc/sudoers'secret_search:match_params:- MAXFILESIZE=10000regexp_match:- "AWS_ACCESS_KEY=(?i).*aws_access_key_id( *=+ *).*(?<![A-Z0-9])[A-Z0-9]{20}(?![A-Z0-9]).*"- "AWS_SECRET_KEY=(?i).*aws_secret_access_key( *=+ *).*(?<![A-Za-z0-9/+=])[A-Za-z0-9/+=]{40}(?![A-Za-z0-9/+=]).*"- "PRIV_KEY=(?i)-+BEGIN(.*)PRIVATE KEY-+"- "DOCKER_AUTH=(?i).*\"auth\": *\".+\""- "API_KEY=(?i).*api(-|_)key( *=+ *).*(?<![A-Z0-9])[A-Z0-9]{20,60}(?![A-Z0-9]).*"## Uncomment content_search: {} to configure file content searching# Very expensive operation - recommend you carefully test and review# content_search:# match_params:# - MAXFILESIZE=10000# regexp_match:# - "EXAMPLE_MATCH="
Owned Package Filtering
Owned package filtering is always disabled in Anchore Enterprise v6 and cannot be re-enabled by configuration. The enable_owned_package_filtering option has been removed.
Base Image Annotations
Anchore Enterprise automatically identifies an image’s base image by tracing its ancestry — the chain of images produced by successive FROM clauses — and picking the closest ancestor by default. You can override that default by annotating a specific ancestor so that it, rather than the immediate parent, is treated as the base image. This is useful when a platform team publishes a “golden image” several layers up the chain. For concept details see Images.
Mark an Image as the Base
Apply the anchore.user/marked_base_image annotation with value true to any image you want considered a base image. If an annotated image should no longer be treated as a base image, set the annotation to false — it is not currently possible to remove annotations once added.
# Mark an image as the baseanchorectl image add anchore/test_images:ancestor-base -w --annotation "anchore.user/marked_base_image=true"# Un-mark itanchorectl image add anchore/test_images:ancestor-base --annotation "anchore.user/marked_base_image=false"
Enable or Disable User Annotations
The base-image selection logic can ignore the anchore.user/marked_base_image annotation entirely by setting services.policy_engine.enable_user_base_image to false in the Anchore Enterprise configuration file. When disabled, base-image selection always uses the closest ancestor, regardless of annotations.
Redhat Enterprise Linux (RHEL) Extended Update Support (EUS)
Anchore Enterprise supports the detection of Red Hat Enterprise Linux (RHEL) Extended Update Support (EUS) in images analysed by Anchore Enterprise.
You can decide how Anchore Enterprise should act when scanning RHEL EUS images for vulnerabilities by setting the following configuration options:
Understand and configure storage for your Anchore Enterprise deployment
Anchore Enterprise uses three categories of storage, each serving a distinct purpose. This page describes each type and provides configuration guidance.
Anchore recommends configuring scratch and layer caching to suit your workload, then using the PostgreSQL database driver for the Active Data Set and external object storage (such as Amazon S3 or an S3-compatible service) for the Archive Data Set. Use Archive Rules and Artifact Lifecycle Policies to keep your Active Data Set small.
Storage Type
Purpose
Required?
Scratch space
Temporary storage for downloading and unpacking image layers during analysis
Optional (recommended)
Layer cache
Caches downloaded layers to speed up repeated analysis
Optional
Object storage and analysis archiving
Stores analysis data, policies, and archived results
Required (defaults to PostgreSQL)
Configure Scratch Space
During image analysis, Anchore Enterprise downloads and extracts image layers to a local directory on each analyzer worker. This scratch space is ephemeral and must not be shared between services.
Sizing guidance: Without layer caching, size the scratch volume to at least three times the uncompressed size of the largest image you expect to analyze.
By default, Anchore Enterprise uses /tmp inside the container. To use a dedicated volume, mount it and set tmp_dir in your config.yaml:
tmp_dir:'/scratch'
A dedicated temporary volume is required on container hosts that use OverlayFS or OverlayFS2 with a kernel older than 4.13, due to a kernel driver bug.
Layer caching reduces analysis time and network usage by storing previously downloaded image layers so they can be reused across analyses.
Sizing guidance: Size the layer cache to at least three times the uncompressed image size plus 4GB. The minimum supported size is 1GB. The cache uses a least recently used (LRU) eviction policy and stores files in the anchore_layercache directory under your configured tmp_dir.
Anchore Enterprise stores less-structured data — image manifests, analysis reports, and policy evaluations — in an internal object store. By default this uses PostgreSQL, but it can be offloaded to Amazon S3 or an S3-compatible provider for improved scalability and cost management.
Anchore Enterprise separates storage into two logical data sets:
Active Data Set: The working set of current image analyses, queried frequently by the policy engine and API. Configured via the catalog’s object_store key.
Archive Data Set: Completed analyses moved out of active storage to reduce database size. Can be restored on demand. Configured via the catalog’s analysis_archive key.
Sizing guidance: Estimate approximately 10MB per image across both data sets.
Active Data Set
PostgreSQL is the default and requires no additional configuration. To offload to Amazon S3, update the catalog’s object_store in your config.yaml:
The analysis archive uses the same storage drivers as the active data set but is configured separately. This lets you direct archived data to lower-cost storage independently of your working set.
Example — keep the active data set in PostgreSQL while archiving to Amazon S3:
Anchore Enterprise stores all metadata in a structured format in a PostgreSQL database to support API operations and searches.
Examples of data persisted in the database:
Image metadata (distro, version, layer counts, …)
Image digests to tag mapping (docker.io/nginx:latest is hash sha256:abcd at time t)
Image analysis content indexed for policy evaluation (files, packages, ..)
Feed data
vulnerability info
package info from upstream (gem/npm)
Accounts, users…
…
If the object store is not explicitly set to an external provider, then that data is also persisted in
the database but can be migrated
Reducing Database Storage Usage
Beyond enabling a non-DB object store there are some configuration
options to reduce database storage and IO used by Anchore Enterprise.
Configuration of Indexed DB Storage for Package DB File Entries
There is a configuration option for the policy engine service to disable the usage of
the database for storing indexed package database entries from each analyzed image. This data represents the files in
each distro package and their metadata (digests and permissions) from each scanned image in the image_package_db_entries table.
That table is only used by the policy engine to deliver the policy trigger [‘packages.verify’],
but if you do not use that trigger then the use of the storage can be disabled thereby reducing database load and resource usage.
The data can be quite large, often in the thousands of rows per analyzed image, so for some customers that do not use this
data for policy, disabling the loading of this data can reduce database consumption significantly.
Disabling Indexed DB Storage for Package DB File Entries
In each policy engine’s config.yaml file, change:
enable_package_db_load: true
to
enable_package_db_load: false
You can configure this by adding an environment variable ANCHORE_POLICY_ENGINE_ENABLE_PACKAGE_DB_LOAD with your chosen value on the policy engine service for both Compose and Helm deployments. This is enabled or set to ’true’ by default.
Note that disabling the table usage will also disable support for the packages.verify trigger and any policies that have the
trigger in a rule will be considered invalid and return errors on evaluation. Any new policies that attempt to use the trigger
will be rejected on upload as invalid if the trigger is included.
Once this configuration is set, you may delete data in that db table to reclaim some database storage capacity. If
you’re interested in this option please contact support for guidance on this process.
Enabling Indexed DB Storage for Package DB File Entries
If you find that you do need the trigger, you can change the configuration to use the table then support will be
restored. However, any images analyzed while the setting was ‘false’ will need to be re-analyzed in order to
populate their data in that table correctly.
5.16.2 - File Storage Configuration
Anchore Enterprise uses a local directory for image analysis operations including downloading layers and unpacking the image content for the analysis process.
For configuration of local storage for scratch space, see Scratch.
In many cases the images will share a number of common layers, especially if images are built form a consistent set of base images. Anchore Enterprise can cache image layers to improve analysis time, see Layer Caching.
5.16.2.1 - Scratch Configuration
Anchore Enterprise uses a local directory for image analysis operations including downloading layers and unpacking the image content for the analysis process.
Analysis Process
Once an image is submitted to Anchore Enterprise for centralized analysis the system will attempt to retrieve metadata about the image from the Docker registry and if successful will download the image and queue the image for analysis. Anchore Enterprise can run one or more analyzer services to scale out processing of images. The next available analyzer worker will process the image.
Docker Images are made up of one or more layers, which are described in the manifest. The manifest lists the layers which are typically stored as gzipped compressed TAR files.
As part of image analysis Anchore Enterprise will:
Download all layers that comprise an image
Extract the layers to a temporary file system location
Perform analysis on the contents of the image including:
Scan for secret materials (api keys, private keys, etc.)
Following the analysis the extracted layers and downloaded layer tar files are deleted.
Configuration of Scratch Space
It is typically recommended that the cache data is stored in an external volume to ensure that the cache does not use up the ephemeral storage space allocated to the container host.
By default Anchore Enterprise uses the /tmp directory within the container to download and extract images. You may wish to define a temporary directory or a volume mounted specifically for scratch image data. This can be configured in the config.yaml:
tmp_dir: '/scratch'
In this example a volume has been mounted as /scratch within the container and config.yaml updated to use /scratch as the temporary directory for image analysis.
With the layer cache disabled the temporary directory should be sized to at least 3 times the uncompressed image size to be analyzed. To understand layer caching, see Layer Caching
5.16.2.2 - Layer Caching Configuration
To speed up analysis, Anchore Enterprise can be configured to cache image layers, eliminating the need to download the same layer for many different images.
Configure Layer Caching
Enable the layer cache so the analyzer service stores downloaded layers locally for reuse.
Layer cache should be sized to at least 3 times the uncompressed image size + 4 gigabytes.
To enable layer caching, adjust the layer_cache_max_gigabytes parameter in the analyzer section of the Anchore Enterprise Helm values file, for example:
You can set it in the config.yaml if you have it bind-mounted into your container(s) via the docker-compose file, or you can set the environment variables as follows:
Anchore Enterprise allows independent configuration of object storage drivers for both the Active Data Set and the Archive Data Set.
Anchore Enterprise uses a PostgreSQL database by default to store structured data for images, tags, policies, subscriptions and metadata
about images, but other types of data in the system are less structured and tend to be larger pieces of data. Because of
that, there are benefits to supporting key-value access patterns for things like image manifests, analysis reports, and
policy evaluations. For such data, Anchore Enterprise has an internal object storage interface that, while defaulted to use the
same Postgres database for storage, can be configured to use external object storage providers to support simpler capacity
management and lower costs. The options are:
If you’re using an S3-compatible storage provider (not AWS), you may encounter issues with request or response checksum validation. To avoid these, set the following as extra Environment variables in catalog: AWS_REQUEST_CHECKSUM_CALCULATION & AWS_RESPONSE_CHECKSUM_CALCULATION with their value set to when_required.
For the Active Data Set, configuration for the object store is set in the catalog’s object_store service configuration in the config.yaml.
For the Archive Data Set, configuration for the object store is set in the catalog’s analysis_archive configuration in the config.yaml. See Analysis Archive).
Migration instructions to move from the default provider to external object store can be found here.
Common Configurations
Single shared object store backend: set object_store details in config.yaml and omit the analysis_archive config from config.yaml, or set it to null or {}
Different bucket/container: the object_store and analysis_archive configurations are both specified and identical
with the exception of the bucket or container values for the analysis_archive so that its data is split into a
different backend bucket to allow for lifecycle controls or cost optimization since its access is much less frequent (if ever).
Primary object store in DB, analysis_archive in external S3: this keeps latency low as no external service is
needed for the object store and active data but lets you use more scalable external object storage for archive data. This
approach is most beneficial if you can keep the working set of images small and quickly transition old analysis to the
archive to ensure the db is kept small and the analysis archive handles the data scaling over time.
5.16.3.1 - Database Driver
The default object store driver is the PostgreSQL database driver which stores all object store documents within the PostgreSQL database.
A component of the object store driver is the archive_document. When the default object store driver is used, as opposed to a user configuring a S3 bucket, this is the location where image SBOMs, vulnerability scans, policy evaluations, and reports are stored.
Compression is not supported for this driver since the underlying database will handle compression.
There are no configuration options required for the Database driver.
The embedded configuration for anchore enterprise includes the default configuration for the db driver.
For information on what the analysis archive is and how it works, see Data Management.
The Analysis Archive is an object store with specific semantics and thus is configured as an object store using the same configuration options as object_store which is used for the active working set of images, just with a different config key: analysis_archive
Amazon S3 Example
Anchore strongly recommends using IAM roles for secure access to Amazon S3.
Example configuration snippet for using the DB for working set object store and Amazon S3 for the analysis archive:
By default, if no analysis_archive config is found or the property is not present in the config.yaml, the analysis archive
will use the object_store or archive (for backwards compatibility) config sections and those defaults (e.g. db if found).
Anchore Enterprise stores all of the analysis archive objects in an internal logical bucket: analysis_archive that is distinct in
the configured backends (e.g a key prefix in the s3 bucket)
Changing Configuration
Unless there are image analyses actually in the archive, there is no data to move if you need to update the configuration
to use a different backend, but once an image analysis has been archived to update the configuration you must follow
the object storage data migration process found here. As noted in that guide, if you need
to migrate to/from an analysis_archive config you’ll need to use the –from-analysis-archive/–to-analysis-archive
options as needed to tell the migration process which configuration to use in the source and destination config files
used for the migration.
5.16.3.3 - Amazon S3
This page describes configuration when using Amazon S3 for object storage with IAM role authentication.
Anchore strongly recommends using IAM roles for secure access to Amazon S3.
IAM Role Authentication
For Anchore Enterprise to use an AWS IAM role, the environment it runs in (such as an EC2 instance, ECS task, or Kubernetes pod) must have an AWS IAM role with the necessary S3 bucket permissions:
The KMS key’s IAM resource policy needs to grant the S3 principal access as well. By default KMS keys grant access to the AWS Account’s IAM root which would work in combination with the policy above. Please note that this is meant to serve as a working example as opposed to being the most restrive configuration possible.
With iamauto: true, Anchore Enterprise automatically adopts the IAM role of its host environment. This is the most secure method for granting Amazon S3 access as it removes the need to store credentials such as ACCESS_KEY and SECRET_KEY in configuration files. For docker-compose environments the IAM role will be shared with the instance profile. For Helm deployments there are multiple options for assigning the IAM role to Anchore Enterprise:
Pod Identity
IRSA
EKS Worker Role (least secure)
For Pod Identity and IRSA you can designate the name of the service account via the Helm values file as follows:
serviceAccountName:"anchore-sa"# This should match the name of the service account created in EKS
If using an IAM role to grant access to ECR then you will need to combine the S3 permissions with the ECR permissions in the same IAM role.
Please note that serviceAccountName needs to be set on the OSAAMigrationJob specifically, if running the OSAA migration. In doing so this will give the migration job access to S3 but it will not be able to spin down the Anchore Enterprise pods during the migration.
Other S3 Configuration Options
Below are other configurable parameters for the Anchore Enterprise S3 driver:
The Anchore Enterprise S3 driver supports document compression to reduce storage space. Set to true to enable or false to disable and
min_size_kbytes sets the minimum document size in kilobytes to be compressed.
region - the AWS region of your Amazon S3 bucket. It is required if url is not specified.
bucket - the name of the Amazon S3 bucket for Anchore’s data storage.
create_bucket - if set to true, Anchore Enterprise will attempt to create the bucket if it doesn’t exist. It is, however, recommended to pre-create the bucket.
Example
Here is a full configuration example for the S3 driver using IAM role authentication (config.yaml used in docker-compose):
services:catalog:object_store:verify_content_digests:truestorage_driver:name:'s3'config:# AWS IAM role authenticationiamauto:true# Amazon S3 bucket configurationregion:'us-east-1'bucket:'my-anchore-data'create_bucket:false# Optional compressioncompression:enabled:truemin_size_kbytes:100
Helm chart values for kubernetes deployment:
anchoreConfig:catalog:object_store:verify_content_digests:truestorage_driver:name:'s3'config:# AWS IAM role authenticationiamauto:true# Amazon S3 bucket configurationregion:'us-east-1'bucket:'my-anchore-data'create_bucket:false# Optional compressioncompression:enabled:truemin_size_kbytes:100
5.16.3.4 - S3-Compatible
Anchore Enterprise can be configured to use third-party S3 API-compatible object storage systems.
Anchore strongly recommends using Kubernetes secrets rather than plaintext entries in your values.yaml to store your S3-compatible access keys.
The following additional configuration parameters can be used.
Compression
The S3 driver supports compression of documents. The documents are JSON formatted and will see significant reduction in
size through compression there is an overhead incurred by running compression and decompression on every access of these
documents. Anchore Enterprise can be configured to only compress documents above a certain size to reduce unnecessary
overhead. In the example below any document over 100kb in size will be compressed.
Authentication
Anchore Enterprise can authenticate against the S3-compatible service using access keys.
Endpoints
url - (required) A URL to set to reach an S3-API compatible service. Note that if the URL is configured, the region config value is ignored, as this is only used for Amazon S3.
Buckets
bucket - (required) The name of the S3 bucket that Anchore Enterprise will use for storing data.
create_bucket- (default: false) Try to create the bucket if it doesn’t already exist. This should be used very sparingly. For most cases, you should pre-create the bucket so that it has the permissions you desire, then set this to false.
Storing Object Store API keys in a Kubernetes Secret
You can configure your object store API keys to be pulled from a Kubernetes Secret as follows:
To migrate data from one driver to another (e.g. DB to S3), Anchore Enterprise includes capabilities that automate the process in the anchore-manager tool packaged with the system. For Helm-based deployments, this is further automated via Helm upgrade helpers, whereas for Docker Compose deployments the tool must be run manually.
The migration process is an offline process; Anchore Enterprise is not designed to handle an online migration.
The object storage migration process migrates any data stored in the source config to the destination configuration, if the analysis archive is configured to use the same storage backend as the primary object store then that data is migrated along with all other data, but if the source or destination configurations define different storage backends for the analysis archive than that which is used by the primary object store, then additional parameters are necessary to indicate which configurations to migrate to/from.
The most common migration patterns are:
Migrate from a single backend configuration to a split configuration to keep the Active Data Set in the DB and then move the Archive Data Set (analysis archive data) to an external system (db -> db + s3)
Migrate from a dual-backend configuration to a single-backend configuration with a different config (e.g. db + s3-compatible -> s3-compatible)
At a high-level the process is:
Shutdown all Anchore Enterprise services and components. The system should be fully offline, but the database must be online and available. For a docker compose install, this is achieved by simply stopping the engine container, but not deleting it.
Prepare a new config.yaml that includes the new driver configuration for the destination of the migration (dest-config.yaml) in the same location as the existing config.yaml
Test a new dest-config.yaml to ensure correct configuration
Run the migration
Get coffee… this could take a while if you have a lot of analysis data
When complete, view the results
Ensure the dest-config.yaml is in place for all the components as config.yaml
Start Anchore Enterprise services and components.
EXAMPLE: Migration of Object Store in Helm-based Deployment from DB to Amazon S3
The Anchore Enterprise Helm Chart provides a way to run the migration steps listed in this page automatically by spinning up a job and crafting the configs required and running the necessary migration commands. Further information is available via instructions found in our Helm Chart here. Below are example configurations:
Anchore recommends using IAM roles for access to Amazon S3, as in the example below, you can find role configuration details here.
Example config
osaaMigrationJob:enabled:true# note that we are enabling the migration jobanalysisArchiveMigration:run:truebucket:"analysis_archive"mode:to_analysis_archiveanalysis_archive:enabled:truecompression:enabled:truemin_size_kbytes:100storage_driver:name:s3config:iamauto:trueregion:<MY_AWS_REGION>bucket:anchore-analysis-archiveobjectStoreMigration:run:trueobject_store:verify_content_digests:truecompression:enabled:truemin_size_kbytes:100storage_driver:name:s3config:iamauto:trueregion:<MY_AWS_REGION>bucket:anchore-object-store# When running the migration you may omit or specify the following which will act as the source of the migrationanchoreConfig:default_admin_password:foobarcatalog:analysis_archive:enabled:truecompression:enabled:truemin_size_kbytes:100storage_driver:name:dbconfig:{}object_store:verify_content_digests:truecompression:enabled:truemin_size_kbytes:100storage_driver:name:dbconfig:{}
Once the migration has completed disable the osaaMigrationJob and move the configurations to the anchoreConfig.catalog section.
EXAMPLE: Migration of Object Store in Helm-based Deployment from DB to S3-compatible
Example config
osaaMigrationJob:enabled:true# note that we are enabling the migration jobanalysisArchiveMigration:run:true# we are specifying to run the analysis_archive migrationbucket:"analysis_archive"mode:to_analysis_archive# the deployment will be migrated to use the following configs for catalog.analysis_archiveanalysis_archive:enabled:truecompression:enabled:truemin_size_kbytes:100storage_driver:name:s3config:access_key:MY_ACCESS_KEYsecret_key:MY_SECRET_KEYurl:'https://my-s3-compatible-endpoint.example.com:optional_port'region:nullbucket:anchore-analysis-archiveobjectStoreMigration:run:true# note that since this is the same as anchoreConfig.catalog.object_store, the migration# command for migrating the object store will still run, but it will not do anything as there# is nothing to be doneobject_store:verify_content_digests:truecompression:enabled:truemin_size_kbytes:100storage_driver:name:s3config:access_key:MY_ACCESS_KEYsecret_key:MY_SECRET_KEYurl:'https://my-s3-compatible-endpoint.example.com:optional_port'region:nullbucket:anchore-object-store# When running the migration you may omit or specify the following which will act as the source of the migrationanchoreConfig:default_admin_password:foobarcatalog:analysis_archive:enabled:truecompression:enabled:truemin_size_kbytes:100storage_driver:name:dbconfig:{}object_store:verify_content_digests:truecompression:enabled:truemin_size_kbytes:100storage_driver:name:dbconfig:{}
EXAMPLE: Migration of Object Store in Docker Compose from DB to S3-compatible
The following example demonstrates migration for a Docker Compose deployment.
Preparing for Migration
For the migration process you will need:
The original config.yaml used by the services already, if services are split out or using different config.yaml for different services, you need the config.yaml used by the catalog services
An updated config.yaml (named dest-config.yaml in this example), with the archive driver section of the catalog service config set to the config you want to migrate to
The db connection string from config.yaml, this is needed by the anchore-manager script directly
Credentials and resources (bucket etc) for the destination of the migration
If Anchore Enterprise is deployed using Docker Compose, the migration must be manually initiated using the anchore-manager script. The following is an example migration for Anchore Enterprise deployed via Docker Compose on a single host with a local postgresql container. This process requires that you run the command in a location that has access to both the source archive driver configuration and the new archive driver configuration.
Step 1: Shutdown all services
All services should be stopped, but the postgresql db must still be available and running. You can use the docker compose stop command and supply all services names except the DB:
Both the original and new configurations are needed, so create a copy and update the archive driver section to the configuration you want to migrate to
cd config
cp config.yaml dest-config.yaml
<edit dest-config.yaml>
Step 3: Test the destination config
Assuming that config is dest-config.yaml:
$ docker compose run anchore-catalog /bin/bash
[root@3209ad44d7bb ~]# anchore-manager objectstorage --db-connect ${db} check /config/dest-config.yaml [MainThread][anchore_manager.cli.utils/connect_database()][INFO] DB params: {"db_pool_size": 30, "db_connect": "postgresql+pg8000://postgres:postgres.dev@postgres-dev:5432/postgres", "db_connect_args": {"ssl": false, "connect_timeout": 120, "timeout": 30}, "db_pool_max_overflow": 100}[MainThread][anchore_manager.cli.utils/connect_database()][INFO] DB connection configured: True
[MainThread][anchore_manager.cli.utils/connect_database()][INFO] DB attempting to connect...
[MainThread][anchore_manager.cli.utils/connect_database()][INFO] DB connected: True
[MainThread][anchore_manager.cli.objectstorage/check()][INFO] Using config file /config/dest-config.yaml
[MainThread][anchore_engine.subsys.object_store.operations/initialize()][INFO] Archive initialization complete
[MainThread][anchore_manager.cli.objectstorage/check()][INFO] Checking existence of test document with user_id= test, bucket= anchorecliconfigtest and archive_id= cliconfigtest
[MainThread][anchore_manager.cli.objectstorage/check()][INFO] Creating test document with user_id= test, bucket= anchorecliconfigtest and archive_id= cliconfigtest
[MainThread][anchore_manager.cli.objectstorage/check()][INFO] Checking document fetch
[MainThread][anchore_manager.cli.objectstorage/check()][INFO] Removing test object
[MainThread][anchore_manager.cli.objectstorage/check()][INFO] Archive config check completed successfully
Step 3a: Test the current config.yaml
If you are running the migration for a different location than one of the Anchore Enterprise containers, same as above but using /config/config.yaml as the input to check (skipped in this instance since we’re running the migration from the same container)
Step 4: Run the migration
By default, the migration process will remove data from the source once it has confirmed it has been copied to the destination and the metadata has been updated in the anchore db. To skip the deletion on the source, use the --nodelete option. It is the safest option, but if you use it, you are responsible for removing the data later.
[root@3209ad44d7bb ~]# anchore-manager objectstorage --db-connect ${db} migrate /config/config.yaml /config/dest-config.yaml [MainThread][anchore_manager.cli.utils/connect_database()][INFO] DB params: {"db_pool_size": 30, "db_connect": "postgresql+pg8000://postgres:postgres.dev@postgres-dev:5432/postgres", "db_connect_args": {"ssl": false, "connect_timeout": 120, "timeout": 30}, "db_pool_max_overflow": 100}[MainThread][anchore_manager.cli.utils/connect_database()][INFO] DB connection configured: True
[MainThread][anchore_manager.cli.utils/connect_database()][INFO] DB attempting to connect...
[MainThread][anchore_manager.cli.utils/connect_database()][INFO] DB connected: True
[MainThread][anchore_manager.cli.objectstorage/migrate()][INFO] Loading configs
[MainThread][anchore_manager.cli.objectstorage/migrate()][INFO] Migration from config: {"storage_driver": {"config": {},
"name": "db"},
"compression": {"enabled": false,
"min_size_kbytes": 100}}[MainThread][anchore_manager.cli.objectstorage/migrate()][INFO] Migration to config: {"storage_driver": {"config": {"access_key": "9EB92C7W61YPFQ6QLDOU",
"create_bucket": true,
"url": "http://minio-ephemeral-test:9000/",
"region": false,
"bucket": "anchore-engine-testing",
"prefix": "internaltest",
"secret_key": "TuHo2UbBx+amD3YiCeidy+R3q82MPTPiyd+dlW+s"},
"name": "s3"},
"compression": {"enabled": true,
"min_size_kbytes": 100}}Performing this operation requires *all* anchore-engine services to be stopped - proceed? (y/N)y
[MainThread][anchore_engine.subsys.object_store.migration/initiate_migration()][INFO] Initializing migration from {'storage_driver': {'config': {}, 'name': 'db'}, 'compression': {'enabled': False, 'min_size_kbytes': 100}} to {'storage_driver': {'config': {'access_key': '9EB92C7W61YPFQ6QLDOU', 'create_bucket': True, 'url': 'http://minio-ephemeral-test:9000/', 'region': False, 'bucket': 'anchore-engine-testing', 'prefix': 'internaltest', 'secret_key': 'TuHo2UbBx+amD3YiCeidy+R3q82MPTPiyd+dlW+s'}, 'name': 's3'}, 'compression': {'enabled': True, 'min_size_kbytes': 100}}[MainThread][anchore_engine.subsys.object_store.migration/migration_context()][INFO] Initializing source object_store: {'storage_driver': {'config': {}, 'name': 'db'}, 'compression': {'enabled': False, 'min_size_kbytes': 100}}[MainThread][anchore_engine.subsys.object_store.migration/migration_context()][INFO] Initializing dest object_store: {'storage_driver': {'config': {'access_key': '9EB92C7W61YPFQ6QLDOU', 'create_bucket': True, 'url': 'http://minio-ephemeral-test:9000/', 'region': False, 'bucket': 'anchore-engine-testing', 'prefix': 'internaltest', 'secret_key': 'TuHo2UbBx+amD3YiCeidy+R3q82MPTPiyd+dlW+s'}, 'name': 's3'}, 'compression': {'enabled': True, 'min_size_kbytes': 100}}[MainThread][anchore_engine.subsys.object_store.migration/initiate_migration()][INFO] Migration Task Id: 1[MainThread][anchore_engine.subsys.object_store.migration/initiate_migration()][INFO] Entering main migration loop
[MainThread][anchore_engine.subsys.object_store.migration/initiate_migration()][INFO] Migrating 7 documents
[MainThread][anchore_engine.subsys.object_store.migration/initiate_migration()][INFO] Deleting document on source after successful migration to destination. Src= db://admin/policy_bundles/2c53a13c-1765-11e8-82ef-23527761d060
[MainThread][anchore_engine.subsys.object_store.migration/initiate_migration()][INFO] Deleting document on source after successful migration to destination. Src= db://admin/manifest_data/sha256:0873c923e00e0fd2ba78041bfb64a105e1ecb7678916d1f7776311e45bf5634b
[MainThread][anchore_engine.subsys.object_store.migration/initiate_migration()][INFO] Deleting document on source after successful migration to destination. Src= db://admin/analysis_data/sha256:0873c923e00e0fd2ba78041bfb64a105e1ecb7678916d1f7776311e45bf5634b
[MainThread][anchore_engine.subsys.object_store.migration/initiate_migration()][INFO] Deleting document on source after successful migration to destination. Src= db://admin/image_content_data/sha256:0873c923e00e0fd2ba78041bfb64a105e1ecb7678916d1f7776311e45bf5634b
[MainThread][anchore_engine.subsys.object_store.migration/initiate_migration()][INFO] Deleting document on source after successful migration to destination. Src= db://admin/manifest_data/sha256:a0cd2c88c5cc65499e959ac33c8ebab45f24e6348b48d8c34fd2308fcb0cc138
[MainThread][anchore_engine.subsys.object_store.migration/initiate_migration()][INFO] Deleting document on source after successful migration to destination. Src= db://admin/analysis_data/sha256:a0cd2c88c5cc65499e959ac33c8ebab45f24e6348b48d8c34fd2308fcb0cc138
[MainThread][anchore_engine.subsys.object_store.migration/initiate_migration()][INFO] Deleting document on source after successful migration to destination. Src= db://admin/image_content_data/sha256:a0cd2c88c5cc65499e959ac33c8ebab45f24e6348b48d8c34fd2308fcb0cc138
[MainThread][anchore_engine.subsys.object_store.migration/initiate_migration()][INFO] Migration result summary: {"last_state": "running", "executor_id": "3209ad44d7bb:37:139731996518208:", "archive_documents_migrated": 7, "last_updated": "2018-08-15T18:03:52.951364", "online_migration": null, "created_at": "2018-08-15T18:03:52.951354", "migrate_from_driver": "db", "archive_documents_to_migrate": 7, "state": "complete", "migrate_to_driver": "s3", "ended_at": "2018-08-15T18:03:53.720554", "started_at": "2018-08-15T18:03:52.949956", "type": "archivemigrationtask", "id": 1}[MainThread][anchore_manager.cli.objectstorage/migrate()][INFO] After this migration, your anchore-engine config.yaml MUST have the following configuration options added before starting up again:
compression:
enabled: true
min_size_kbytes: 100storage_driver:
config:
access_key: 9EB92C7W61YPFQ6QLDOU
bucket: anchore-engine-testing
create_bucket: true
prefix: internaltest
region: false
secret_key: TuHo2UbBx+amD3YiCeidy+R3q82MPTPiyd+dlW+s
url: http://minio-ephemeral-test:9000/
name: s3
If something goes wrong you can reverse the parameters of the migrate command to migrate back to the original configuration (e.g. migrate /config/dest-config.yaml /config/config.yaml)
Step 5: Get coffee!
The migration time will depend on the amount of data and the source and destination systems performance.
Step 6: View migration results summary
[root@3209ad44d7bb ~]# anchore-manager objectstorage --db-connect ${db} list-migrations[MainThread][anchore_manager.cli.utils/connect_database()][INFO] DB params: {"db_pool_size": 30, "db_connect": "postgresql+pg8000://postgres:postgres.dev@postgres-dev:5432/postgres", "db_connect_args": {"ssl": false, "connect_timeout": 120, "timeout": 30}, "db_pool_max_overflow": 100}[MainThread][anchore_manager.cli.utils/connect_database()][INFO] DB connection configured: True
[MainThread][anchore_manager.cli.utils/connect_database()][INFO] DB attempting to connect...
[MainThread][anchore_manager.cli.utils/connect_database()][INFO] DB connected: True
id state start time end time from to migrated count total to migrate last updated
1 complete 2018-08-15T18:03:52.949956 2018-08-15T18:03:53.720554 db s3 77 2018-08-15T18:03:53.724628
This lists all migrations for the service and the number of objects migrated. If you’ve run multiple migrations you’ll see multiple rows in this response.
Step 7: Replace old config.yaml with updated dest-config.yaml
You should now permanently move into place the new configuration, replacing the old.
Run the following command at the same location as your docker-compose file to bring all services back up:
docker compose start
The system should now be up and running using the new configuration! You can verify with the anchorectl command by fetching a policy, which will have been migrated:
If that returns the content properly, then you’re all done!
5.17 - Working with Subscriptions
Introduction
Anchore Enterprise supports 7 types of subscriptions:
Tag Update
Policy Update
Vulnerability Update
Analysis Update
Alerts
Repository Update
Runtime Inventory
Enabling some of these will generate a notification when the event is triggered while others may have a more significant impact on the system.
Please read carefully what each subscription watches/manages and what effect enabling them may have on the overall deployment.
Tag Update
Granularity
Per Image Tag
Notification Generated
Yes
Background Process
Yes
Default Timer Frequency
every 60 min
Default State
Disabled (Unless the Tag is added by AnchoreCTL)
Other Considerations
Adds new tag/digest pairs to the system
When the tag_update subscription is enabled, a background process, called a “watcher”, will periodically query the repository for any new image digests with the same tag.
For each new image digest found:
it will be pulled into the catalog and analyzed
a Tag Update Notification will be triggered.
Policy Updates
Granularity
Per Image Tag
Notification Generated
Yes
Background Process
Yes
Default Timer Frequency
every 60 min
Default State
Disabled
Other Considerations
None
This class of notification is triggered if a Tag to which a user has subscribed has a change in its policy evaluation status. The policy evaluation status of an image can be one of two states: Pass or Fail. If an image that was previously marked as Pass changes status to Fail or vice-versa then the policy update notification will be triggered.
The policy status of a Tag may be changed by a number of methods.
Change to policy
If an policy was changed, for example adding, editing or removing a policy check, then the policy status of an image may be effected. For example adding policy rule that denylists a specific package that is present in a given Tag may cause the Tag’s policy status to move to Fail.
Changes to Allowlist
If a allowlist is changed to add or remove a CVE then this may cause a policy status change. For example if an image contains a package that is vulnerable to Critical Severity CVE-2017-9999 then this image may fail in it’s policy evaluation. If CVE-2017-9999 is added to a CVE Allowlist that is mapped to the subscribed Tag then the policy status may change from Fail to Pass.
Change in Policy / Allowlist Mapping
If the policy mapping is changed then a new policy or allowlist may be applied to an image which may change the status of the image. For example changing the mapping to add a more restrictive policy may change an Tag’s status from Pass to Fail.
Change in Package or Vulnerability Data
Some policy checks make use of data from external feeds. For example vulnerability checks use CVE data feeds. Changes in data within these feed may change the policy status, such as adding a new CVE vulnerability.
Vulnerability / CVE Update
Granularity
Per Image Tag
Notification Generated
Yes
Background Process
Yes
Default Timer Frequency
every 4 hours
Default State
Disabled
Other Considerations
None
This class of notification is triggered if the list of CVEs or other security vulnerabilities in the image changes.
For example, a user was subscribed to the library/nginx:latest tag. On the 12th of September 2017 a new vulnerability was added to the Debian 9 vulnerability feed which matched a package in the library/nginx:latest image, triggering a notification.
Based on the changes made by the upstream providers of CVE data (operating system vendors and NIST) CVEs may be added, removed or modified – for example a CVE initially marked as severity level Unknown may be upgraded to a higher severity level.
Note: A change to the CVE list in a Tag may not trigger a policy status change based on the policy rules configured for an image. In the example above the CVE had an unknown severity level which may not be tested by the policy mapped to this image.
Analysis Update
Granularity
Per Image Tag
Notification Generated
Yes
Background Process
No
Default Timer Frequency
n/a
Default State
Enabled
Other Considerations
None
This class of notification is triggered when an image has been analyzed. Typically, this is triggered when a new Tag has been added to the catalog.
A common use case for this trigger is to alert an external system that a new Tag was added and has been successfully analyzed.
Forcing a re-analysis on an existing image will also cause this notification to be generated.
Alerts
Granularity
Per Image Tag
Notification Generated
No
Background Process
Yes
Default Timer Frequency
10 minutes
Default State
Disabled
Other Considerations
Enabling this Subscription may be resource intensive as frequent policy evaluations will occur
The UI and API use stateful alerts that will be raised for policy violations on tags to which you are subscribed for alerts.
This raises a clear notification in the UI to help initiate the remediation workflow and address the violations via the remediation feature.
Once all findings are addressed the alert is closed, allowing an efficient workflow for users to bring their image’s into compliance with their policy.
Repository Update
Granularity
Per Repository
Notification Generated
No
Background Process
Yes
Default Timer Frequency
60 seconds
Default State
Disabled
Other Considerations
Adds all the tags found in a repository to the system
This subscription, when enabled, will query the provided repository for any new tags. Any tag not already managed within Anchore Enterprise, will be added.
This subscription also provides the ability to determine if the tag_update subscription should be enabled for any new tag added to Anchore Enterprise.
Please see Repositories for more information.
Please Note: Enabling this subscription may add a large number of tags to the system.
Runtime Inventory
Granularity
Per Runtime Inventory Context (Cluster/Namespace)
Notification Generated
No
Background Process
Yes
Default Timer Frequency
2.5 minutes
Default State
Disabled
Other Considerations
Adds all the images found in the Context to the system
This subscription, when enabled, will find any newly reported images from the runtime inventory and add them to Anchore Enterprise to be analyzed.
Please Note: Enabling this subscription may add a large number of tags to the system.
5.18 - User Authentication
Overview
Anchore Enterprise offers Authentication via HTTP basic auth, SAML/SSO, LDAP and API Keys.
For more information about specific types of Anchore Enterprise authentication, see the following topics:
API keys, or Application Programming Interface keys, are alphanumeric codes used to authenticate and control access to web-based services or APIs (Application Programming Interfaces). These keys serve as unique identifiers for developers or applications seeking permission to interact with Anchore Enterprise. API keys are commonly employed in software development to manage and secure the flow of data between different applications, allowing authorized access while preventing unauthorized usage. They play a crucial role in ensuring the integrity, security, and controlled usage of APIs, acting as a form of digital credentials for developers to connect their applications to external services.
Generating API Keys
A system user can generate an API key for self use. Some users have specific RBAC roles (ie account-user-admin) that allow management of API keys for other system users.
For more details on generating and managing API keys, please refer to this section: Generating API keys
Generating API keys as an SAML (SSO) user
API keys for SAML (SSO) users are disabled by default.
To enable API keys for SAML users, please update your helm chart values file with the following:
API keys are an additional authentication mechanism for SAML (SSO) users that bypasses the authentication control of the IDP.
When access has been revoked at the IDP, it does not automatically disable the user or revoke all API keys for the user.
API keys are an additional authentication mechanism for SAML (SSO) users that bypasses the authentication control of the IDP. When access has been revoked at the IDP, it does not automatically disable the user or revoke all API keys for the user. Therefore, when access has been revoked for a user, the system administrator is responsible to manually delete the Anchore Enterprise user or revoke any API key which was created for the user.
Using API Keys
API keys are authenticated using basic auth. In order to use API keys you need to use a special username _api_key and the password is the value that was output when you created the API key.
The following configuration options can be used to alter system behaviour for key provisioning, management and cleanup.
Maximum Duration for API Keys
Maximum API key validity time be configured at the system level using the user_authentication.max_api_key_age_days configuration option. The default value is 365 days.
Maximum Number of API Keys
The maximum number of API keys per user can also be configured at the system level using the user_authentication.max_api_keys_per_user configuration option. The default is 100 and this number includes Active, Expired and Revoked keys.
SAML User API Key Provisioning
If you wish to enable SAML users to provision API Keys, you should set the user_authentication.allow_api_keys_for_saml_users configuration option to true
Caveats for API keys
API Keys generally inherit the permissions and roles of the user they were generated for, but there are certain operations you cannot perform using API keys regardless of which user they were generated for:
You cannot Add/Edit/Remove Users and Credentials.
You cannot Add/Edit/Revoke API Keys.
5.18.2 - User Credential Storage
Overview
All user information is stored in the Anchore DB. Credentials are stored in hashed form using the Argon2 hashing algorithm.
Basic Authentication
Users authenticate with a username and password. On successful authentication, Anchore issues an OAuth2 bearer token that is used
for subsequent requests. Passwords are never stored in plain text.
OAuth2
Anchore uses OAuth2 bearer tokens for all authenticated communication, including API access, inter-service calls, and SSO.
Tokens are generated upon successful authentication and are never persisted in the database.
All Anchore services must share a common secret or public/private keypair for signing and verifying tokens. See
Token Configuration for details.
5.18.3 - Token Configuration
Overview
Anchore uses OAuth2 bearer tokens for all authenticated communication. All Anchore services must be configured with a
common secret or public/private keypair for signing and verifying tokens.
Configuration
Set in config.yaml for all components of the deployment:
Option 1: Use a shared secret for signing/verifying tokens
keys:
secret: mysecretvalue
Option 2: Use a public/private key pair, delivered as PEM files on the filesystem of the containers Anchore runs in:
keys:
private_key_path: <path to private key pem file>
public_key_path: <path to public key pem file>
Environment Variables
Using environment variables with the config.yaml bundled into the Anchore provided anchore/enterprise image is also an option.
NOTE: These are only valid when using the config.yaml provided in the image due to that file referencing them explicitly as replacement values.
ANCHORE_AUTH_SECRET = the string to use as a secret
ANCHORE_AUTH_PUBKEY = path to public key file
ANCHORE_AUTH_PRIVKEY = path to the private key file
Token Expiration
ANCHORE_OAUTH_TOKEN_EXPIRATION = the number of seconds a token should be valid (default is 3600 seconds)
ANCHORE_OAUTH_REFRESH_TOKEN_EXPIRATION = the number of seconds a refresh token is valid (default is 86400 seconds)
5.18.4 - LDAP
Overview
The Lightweight Directory Access Protocol (LDAP) is a standardized and widely-used client-server protocol for accessing directory information, and can be enabled in Anchore Enterprise Client to authenticate users against an existing directory server.
In order to configure Anchore Enterprise Client for use with LDAP, the requisite information for connecting and authenticating with an LDAP directory server must first be provided by an administrator. For the purposes of determining what users can see and do once they are logged in, the administrator must also create one or more account association entries, called user mappings.
When an LDAP user authenticates, the Anchore Enterprise account associated with their session is determined by the first user mapping containing a search filter that matches the information in their LDAP record. LDAP authentication will fail if no matches are found, if the associated account is disabled, or if the user’s login credentials are incorrect.
The following sections in this document describe how to configure the Anchore Enterprise Client for use with an LDAP directory server, how to add user mappings, and how to log in to the application as an LDAP user.
Server Connection Properties
Administrators can provide the information used to connect Anchore Enterprise Client to an LDAP server from the LDAP sidetab in the Configuration view. Please note that this sidetab is not visible to non-administrative users.
The connection property fields shown in this view are described below:
Property
Description
Server URI
The ldap:// or ldaps:// URI of the LDAP directory server to query.
Manager DN
The distinguished name (DN) of an LDAP directory manager that the Anchore Enterprise Client can use to perform further queries about LDAP users during login. The directory manager is typically a privileged server administrator who, once authenticated, can access the LDAP record of any user intended to access the application.
Manager Password
The password associated with the Manager DN.
Base DN
The relative distinguished name in the LDAP directory tree hierarchy under which queries about users should be performed.
After you have entered the required connection properties, click the Save button to store them. Once stored, you can click the Test button to verify that the application can authenticate with the LDAP server using the details you’ve provided.
Note: Clicking Save when no values are provided in any of the fields will disable LDAP in the application and prevent LDAP from being displayed as an authentication option on the login screen.
User Mappings
LDAP user mappings contain search filters that unite the results of searches made against the data attributes of LDAP records with account information stored in Anchore Enterprise.
When an LDAP user submits their credentials on the login page, the first match encountered will provide Anchore Enterprise Client with an associated Anchore Enterprise account that is used to define the scope of what the user can see and do once they are fully authenticated.
If a match is detected, the submitted password is then validated against the one stored inside the matched LDAP record. If the password is correct and the associated Anchore Enterprise account is not suspended, the user will be successfully logged in. If no match is found or the password is incorrect, authentication will fail.
Adding a User Mapping
User mappings can be created by administrators from inside an account within the Accounts sidetab in the Configuration view, or from the LDAP sidetab in the area below the server connection properties form.
To add a new user mapping containing an LDAP search filter, click the Add New LDAP User Mapping button—or if no user mappings are currently defined, click the Let’s add one! button in the empty table.
You will be presented a dialog, similar to the one shown below, where you can provide an LDAP search filter:
LDAP Search Filters
The LDAP search filter in each mapping provides the criteria for associating that mapping with an Anchore Enterprise account. For example:
uid=$USERNAME
In the above example, the user mapping requires that the uid (user ID) attribute in an LDAP record matches the data represented by the $USERNAME token.
The =$USERNAME string is a required entry, and the actual value of the token resolves to whatever value the user enters in the Username field when they log in to Anchore Enterprise Client.
In Microsoft® Active Directory® (AD) implementations that support the LDAP protocol, the sAMAccountName attribute is the broad equivalent of uid:
sAMAccountName=$USERNAME
Note: The submitted value of $USERNAME should always correspond to an attribute with a unique value within the LDAP user record, or one that is unique in combination with other criteria. In Active Directory, the uniqueness of sAMAccountName is enforced, whereas this may not be true for uid (which is an optional attribute in AD).
Additional filter criteria beyond the user identity can be provided to assert granular control over user access. The following examples describe filters with narrower scope:
In the example above you would replace the Group Distinguished Name (DN) of the group: GroupB,OU=Users,OU=ad,DC=ad,DC=mydomain,DC=com with a DN for a group to assert users are a part of in order for the search filter to match.
A detailed summary of the syntax and formula of LDAP search filters is beyond the scope of this document, however RFC 1558 provides a comprehensive description of how these entries are structured.
Mapping Order
By default, mappings are evaluated in priority order, with new entries being stored at the lowest priority. It can be challenging to infer the exact order of all mappings when they are spread across multiple accounts, so the table listing all current mappings the LDAP sidetab shows the priority of every item and includes the account with which they are associated. Example:
From here you can move row entries to a higher or lower order of precedence by clicking down on a hotspot
and then dragging the row up or down the list.
The priority order of user mappings determines the order in which search filters are evaluated when a user logs in. The first mapping to successfully locate an LDAP user record that matches the $USERNAME and any other criteria in its search filter will be used to determine the Anchore Enterprise account association for that user.
Once a user is located, subsequent mapping entries will be ignored, regardless of (possibly narrower) specificity, as only priority order matters here.
Test Mapping Behavior
You can evaluate the behavior of your user mappings by entering $USERNAME data (for example, the uid of a user) in the Check $USERNAME Against LDAP Mappings search field.
If an LDAP record is located that matches the search filter criteria of a mapping, you’ll be informed of which mapping provided the match, the associated Anchore Enterprise user, and the distinguished name of the user whose LDAP record was returned.
Login With LDAP Credentials
If a set of valid LDAP server connection properties have been stored by an administrator, the LDAP authentication option is activated in the application login view, in addition to the Default option of authenticating against the user records stored in Anchore Enterprise:
The value entered in the Username field will be used by the application to populate the $USERNAME token when evaluating each user mapping. The value entered in the Password field will be used to authenticate the matched user with the LDAP directory server.
Once these operations have completed, and providing the account associated with the mapping is not disabled, the user will be logged in.
5.18.5 - SSO
Overview
Anchore Enterprise can be configured to support user login to the UI using identities from external identity providers
that support SAML 2.0. Anchore Enterprise never stores any credentials for the users, only their usernames
and Anchore permissions. All UI access is gated through a user’s valid login into the identity provider. Anchore Enterprise uses the external
provider to verify username identity and initialize a username, account, and roles on first login for a new user. Once a
user’s identity is initialized in Anchore Enterprise, the Anchore Enterprise administrator can manage user permissions by managing the roles
associated with the user’s identity in Anchore Enterprise itself.
Terms
SAML Terms:
Identity Provider (IDP) - The service that stores the identity database and provides identity and authentication services to Anchore Enterprise.
Service Provider (SP) - The service providing resources to the end user, in this case, the Anchore Enterprise deployment.
Assertion Consumer Service (ACS) - The consumer of SAML assertions generated by the Identity Provider. For Anchore Enterprise,
the UI proxies the SAML assertion to the Anchore Enterprise API service which consumes it, but the UI is the network
endpoint the user’s browser interacts with.
Anchore Enterprise Terms:
Native User - A user that exists in the Anchore Enterprise DB and has login credentials (passwords).
SAML User - A user that exists in the Anchore Enterprise DB only with a username and permissions, but no credentials. This prevents any username
conflicts. SAML users will also be associated with a single Identity Provider. This prevents overlapping usernames from multiple Identity Providers gaining access to unexpected users or accounts.
How SAML integration works
When a user logs into the Anchore Enterprise GUI, they can choose which Identity Provider to authenticate with. User credentials are never passed to Anchore Enterprise. Instead, other information about the user is passed from the Identity Provider to Anchore. Some information used by Anchore Enterprise during login include the username, authenticating Identity Provider, associated account, and initial RBAC permissions. After the initial login, RBAC permissions can be adjusted for this user directly by an Anchore Enterprise administrator. This allows the Anchore Enterprise administrator the ability to control access of Anchore Enterprise users without having to gain access to the corporate IDP system.
Dynamic SAML User Provisioning
The first time a SAML User logs into Anchore, if the username is not found within the Anchore Enterprise DB, a record will be automatically created for the user. If the user’s associated account is not found within the Anchore Enterprise DB, an account record will also be automatically created at this time.
This is often referred to as Just In Time Provisioning (JIT).
Explicit Creation of SAML Users
An Anchore Enterprise administrator has the ability to create other users with administrator privileges. This includes Native and SAML Users. When creating a SAML Administrator User, the username and the Identity Provider’s name will be required. Upon SSO login by this new user, it will be associated with account admin and have all the permissions of an Anchore Enterprise administrator.
A global configuration mode is also available if SSO is the preferred method of login, but the Anchore Enterprise administrator would like
explicit control over which users can gain access to Anchore Enterprise.
When this configuration mode is set to true, any users who have permissions to create other users, will now have the ability to explicitly create SAML Users. As stated above, when creating a SAML User, the username and the Identity Provider’s name will be required. In addition, an RBAC role will also be needed for each SAML User creation. Upon SSO login by this new user, it will be associated with the account it was created in and have all the RBAC permissions provided for it.
When this configuration mode is set to true, SSO logins are only permitted within Anchore Enterprise for users who have existing SAML user records found in Anchore Enterprise DB.
When explicitly creating SAML Users, the account and RBAC role provided will take precedent over any default values or IDP Attributes which may be configured in the SAML Configuration described below. For more information, please see Mapping.
Note: Any users that have previously authenticated via SSO will continue to have access regardless of the configuration mode setting. If you wish to prevent future access when setting sso_require_existing_users to true, simply delete the user record in Anchore Enterprise.
SSO Login Validation
During subsequent SSO logins, Anchore Enterprise will find an existing user record in the Anchore Enterprise DB. The following information will be validated:
The user record must be a SAML User. If the user was previously configured as a Native User and you want to convert it to a SAML User, simply delete the user record in Anchore Enterprise and have the user log in again via SSO.
The user record must be authenticating from the same Identity Provider. If the user has been changed to authenticate via a different Identity Provider, simply delete the user record in Anchore Enterprise and have the user log in again via SSO.
Configuration Overview
In order to use SAML SSO, the Anchore Enterprise deployment must:
Have Oauth enabled. This is required so that Anchore Enterprise can issue bearer tokens for subsequent API usage by the UI to the system APIs.
Using hashed passwords is optional but highly recommended. See User Authentication
for more information on configuring OAuth and hashed password storage.
Be able to reach the IDP login URL from the user’s browser.
Be able to reach the metadata XML endpoint in the IDP (if using url).
Configuration of SAML SSO is done via API/UI operations but requires configuration both in your Identity Provider and in Anchore Enterprise.
In the IDP:
Must support HTTP Redirect binding
Should support signed assertions and signed documents
Must allow unsigned client requests from Anchore Enterprise
Must allow unencrypted requests and responses
Anchore Enterprise IDP Configuration Fields are as follows.
Name - The name to use for this configuration. It will be part of the UI’s /service/auth/sso/ route as well as
the /saml/sso/ and /saml/login/ routes that are used to implement SSO.
Enabled - Whether auth via this configuration is allowed.
ACS HTTPS Port - HTTPS port if non-standard. If omitted or -1, 443 is used.
SP Entity ID - The identity for the Anchore Enterprise system to present when requesting auth from the SAML IDP. This is typically
a URL identifying the Anchore Enterprise deployment.
ACS URL - The URL to which SAML Responses should be sent from the IDP. For UI usage, this should be the hostname and
port of the UI deployment and a path: /service/sso/auth/{idp config name}.
Default Account - If set, this is the account that SSO users will be initialized to be members of upon sign-in the
first time. This property or IDP Account Attribute must be set.
Default Role - The role that will be granted to new users on first sign-in. Use this setting to apply a
consistent role to all users if you do not want that data imported from the IDP. This property or IDP Role Attribute must be set.
IDP Account Attribute - A SAML assertion attribute name from the SAML responses that Anchore Enterprise will use to determine
the account name to initialize the user into. If the account does not exist, it is created. For more information on the
initialization process see Initializing User Identities below. This property or Default Account must be set.
IDP Username Attribute - A SAML assertion attribute name from the SAML responses that Anchore Enterprise will use to determine
the username for the anchore identity. This is optional and typically will not need to be set. If omitted, the SAML Subject is used and this should meet most needs.
IDP Metadata URL - URL to retrieve the IDP metadata xml from. This value is mutually exclusive with IDP Metadata XML,
so only one of the two properties may be specified.
IDP Metadata XML - Raw XML for the IDP metadata. This value is mutually exclusive with IDP Metadata URL, so only one
of the two properties may be specified.
IDP Role Attribute - The SAML assertion attribute from the SAML responses that Anchore Enterprise will use to initialize a user’s
roles. This may be a multi-value property. This property or Default Account must be set.
Require Signed Assertions - If true, require the individual assertions in the SAML response to be signed by the IDP.
Require Signed Response - If true, require the SAML response document to be signed.
Using SAML Attributes to Initialize Users and Account in Anchore Enterprise
The properties of the user including the account it belongs to, the roles it has in that account as well as any other accounts the user has role access to
are all initialized based on the combination of the Anchore Enterprise IDP configuration and the SAML response presented by the IDP at the user’s first login.
See Mapping for more information on that process and how the configuration works.
Deleting SAML SSO Configuration
An Anchore Enterprise administrator has the ability to create, modify, and delete the SAML Configuration. During deletion of the SAML Configuration, any user that was created with this Identity Provider, either dynamically or explicitly, will also be deleted.
5.18.5.1 - Mapping SSO Identities into Anchore Enterprise
Overview of Mapping External Identities into Anchore Enterprise
Anchore Enterprise SSO support provides a way to keep users’ credentials centrally stored in a corporate Identity
Provider and outside of the Anchore Enterprise deployment. Anchore’s SSO approach uses the external identity
store to authenticate a user and bootstrap its permissions using Anchore Enterprise RBAC system. For each login, the user’s
identity is verified against the external provider but once the identity is initialized inside the Anchore Enterprise deployment, its
access to resources is controlled by the Anchore Enterprise RBAC system. This approach allows Anchore admins to manage user
access without having to require administrator access to a corporate or central IT identity system while still being able
to leverage that system for defining identity and securing access credentials.
The identity mapping process has two distinct phases:
Initial identity bootstrap - Occurs on the first login of a user to Anchore Enterprise causing dynamic construction of an Anchore Enterprise user record.
Identity verification and assertion validation - Validates the administrators requirements against the external identity record on each login.
Defining the Username
By default, with SSO, the SAML Assertion’s “Subject” attribute is used to define the username. Using the subject is the
right solution in most situations, but in extreme cases it may be necessary to provide the username in some other form via
attributes in the SAML Response. This behavior can be configured by setting: idp_username_attribute in the SAML Configuration
within Anchore Enterprise. This should only be used when the subject either cannot be used due to it being a transient ID as configured by the
IDP itself, or you want the username to map to some form other than the IDP’s username, email, or persistent ID.
If the idp_username_attribute is set to an attribute name, and that attribute is not found or has no value in the SAML
Response presented during login, then that user login will be rejected by Anchore Enterprise.
If idp_username_attribute is an empty string or null, then the SAML Response’s subject attribute is used as the username.
This is the default behavior.
Defining the Account the User Belongs To
In Anchore Enterprise, all users belong to an Account. When an SSO user logs into Anchore Enterprise GUI for the first time, the identity is initialized
with the username (as defined above), but the account to which the user belongs is configurable via a separate pair of configuration
properties in the SAML Configuration within Anchore Enterprise. These configuration properties are mutually exclusive.
idp_account_attribute - If set in the SAML Configuration, this attribute must be found within the
SAML Response during each login for every user. The attribute value received is the ‘account name’. It must also be valid.
A valid value must be greater than three characters and must not be a reserved account name such as ‘admin’ or ‘anchore-system’
If the attribute is not found within the SAML Response or the value is not valid, the login is rejected.
default_account - If set in the SAML Configuration, it’s value is the account all users that login
from this IDP will be assigned.
In both cases, on the initial login by the user, if the account does not already exist within Anchore Enterprise, an external account with that name is created.
Defining the User’s Initial Roles
In Anchore Enterprise, all users are allowed to have one or more Roles that describe a set of access permissions. Roles are assigned to the user via a separate pair of configuration properties in the SAML Configuration within Anchore Enterprise. These configuration properties are mutually exclusive.
idp_role_attribute - If set in the SAML Configuration, the attribute must be found within the
SAML Response during each login for every user. The attribute value received is one or more ‘role name’. The value must also be valid.
If the attribute is not found within the SAML Response or the value is not valid, the login is rejected.
default_role - If set in the SAML Configuration, it’s value will be the single role set for all users that login with this IDP.
During a user’s first login, this role will be set on the account during user identity initialization. On subsequent logins for this user, the value will be ignored.
Revoking SSO User Access
Disable the Anchore Enterprise account. Any user, SSO or otherwise, that is a member of a disabled account cannot log in or perform API operations.
If using idp_account_attribute or idp_role_attribute, simply remove or zero that attribute at the IDP for that user or group.
All affected users will no longer be able to log in to Anchore Enterprise.
Changing the Anchore Enterprise SAML Configuration
Initialization of identities and roles occurs on the user’s first login. Once initialized, the configuration must match the
SAML Response presented during each login for the user to log in.
Thus, changes to the SAML Configuration within Anchore Enterprise may affect subsequent logins for your users.
For instance, if you change the SAML Configuration within Anchore Enterprise to start using attributes
instead of defaults, a user’s SAML Response will need to contain the same attributes. Failure to find the correct attribute(s) with valid values will prevent the user’s login.
Example SSO configurations
Anchore Enterprise and an external Identity Provider
Here are examples for both Okta and KeyCloak that provide simple defaults and identity mappings.
Because the account is from an attribute, [email protected] might have ‘primary_group’ = [‘security_engineers’] and
thus be initialized in a different account in Anchore Enterprise.
5.18.5.1.1 - KeyCloak SAML Example
Configuring SAML SSO for Anchore Enterprise with KeyCloak
The JBoss KeyCloak system is a widely used and open-source identity management system that supports integration with applications via SAML and OpenID Connect. It also can operate as an identity broker
between other providers such as LDAP or other SAML providers and applications that support SAML or OpenID Connect.
The following is an example of how to configure a new client entry in KeyCloak and configure Anchore Enterprise to use it to permit UI login by KeyCloak users that are granted access via KeyCloak configuration.
Configuring KeyCloak
Anchore Enterprise supports multiple IDP configurations, each given a name. For this example we’ll choose the name “keycloak” for our configuration.
This is important as that name is used in several URL paths to ensure that the correct configuration is used for validating responses,
so make sure you pick a name that is meaningful to your users (they will see it in the login screen) and also that is url friendly.
Some config choices and assumptions specifically for this example:
Let’s assume that you are running Anchore Enterprise locally. Anchore Enterprise GUI is available at: https://localhost:3000. Replace with the appropriate url as needed.
We’re going to choose keycloak as the name of this saml/sso configuration within Anchore Enterprise. This will identify the specific configuration and is used in urls.
Based on that, the Single-SignOn URL for this deployment will be: https://localhost:3000/service/sso/auth/keycloak
Our SP Entity ID will use the same url: http://localhost:3000/service/sso/auth/keycloak
Assertion Consumer Service Redirect Binding URL - http://localhost:3000/service/sso/auth/keycloak
Save the configuration
Download the metadata xml to import into Anchore Enterprise
Select ‘Installation’ tab.
Select Format
Keycloak <= 5.0.0
Select Format Option - SAML Metadata IDPSSODescriptor
Keycloak 6.0.0+
Select Format Option - Mod Auth Mellon files
Unzip the downloaded .zip and locate idp-metadata.xml
Download or copy the XML to save in the Anchore Enterprise configuration
Partial Scoping for the Anchore Enterprise Client in Keycloak
By default, the effective scopes include all roles declared in the Keycloak realm. Anchore Enterprise expects to be able to map roles from Keycloak to roles within Anchore, so limiting it to partial scope instead of full scope prevents sending extra roles to Anchore that cannot be correctly interpreted. To change this default behavior, toggle Full Scope Allowed to OFF and declare the specific roles you want in each client under the Clients –> Anchore Enterprise Client Details –> Dedicated Scopes, Scope tab.
Configure Anchore Enterprise to use the KeyCloak
You’ll need the following information from keycloak in order to configure the SAML record within Anchore Enterprise:
The name to use fo the configuration, in this example keycloak
Metadata XML downloaded or copied from the previous section
In the Anchore Enterprise GUI, create an SSO IDP Configuration:
Login as admin
Select “Configuration” Tab on the top
Select “SSO” on the left-side menu
Click “Let’s Add One” in the configuration listing
Enter the values:
Name: “keycloak” - This is the name of the configuration and will be referenced in login and sso URLs, so we use the value chosen at the beginning of this example
Enabled: True - This controls whether or not users will be able to login with this configuration. We’ll enable it for the example but can disable later if no longer needed.
ACS HTTPS Port: -1 or 443 - This is the port to use for HTTPS to the ACS (Assertion Consumer Service, in this case the UI). It is only needed if you need to use a non-standard https port
SP Entity ID: http://localhost:3000/service/sso/auth/keycloak (NOTE: this must match the Client ID you used for the Client in the KeyCloak setup
Default Account: keycloakusers for this example, but can be any account name (existing or not) that you’d like the users to be members of. See Mappings for more information on how this
Default Role: read-write for this example so that the users have full access to the account to analyze images, setup policies, etc.
IDP Metadata XML: Paste the downloaded or copied XML from KeyCloak in step 4.3 above
Require Signed Assertions - Select off
Require Signed Response - Select on
Save the configuration
You should now see a ‘keycloak’ option in the login screen for the Anchore Enterprise GUI. This will redirect users to login to the KeyCloak instance for their username/password and will create a new user in Anchore in the keycloakusers account with read-write role.
5.18.5.1.2 - Microsoft Entra ID SAML Example
Configuring SAML SSO for Anchore Enterprise with Microsoft Entra ID (formerly Azure Active Directory)
Azure Enterprise Applications allow identities from an Azure Directory to be federated via Single Sign On (SSO) to other applications. In doing so Azure is acting as a SAML Identity Provider (IdP) that can be used with Anchore Enterprise as a SAML Service Provider (SP).
Configuring Azure
Anchore Enterprise supports multiple IDP configurations, each given a name. For this example we’ll choose the name “azure” for our configuration.
This is important as that name is used in several URL paths to ensure that the correct configuration is used for validating responses,
so make sure you pick a name that is meaningful to your users (they will see it in the login screen) and also that is url friendly.
Some config choices and assumptions specifically for this example:
Let’s assume that you are running Anchore Enterprise locally. Anchore Enterprise GUI is available at: https://anchore.example.com. Replace with the appropriate url as needed.
We’re going to choose azure as the name of this saml/sso configuration within Anchore Enterprise. This will identify the specific configuration and is used in urls.
Based on that, the Single-SignOn URL for this deployment will be: https://anchore.example.com/service/sso/auth/azure
Our SP Entity ID will use the same url: https://anchore.example.com/service/sso/auth/azure
Type “Enterprise Applications” into the search bar in the top middle of the screen and click on it.
Click on Create your own application near the upper left.
Select SAML as the single sign-on method.
From your new Azure AD Enterprise Application select Single sign-on.
Select Edit Basic SAML Configuration (section 1).
For both Identifier (Entity ID) & Reply URL (Assertion Consumer Service URL) enter the URL for your Anchore Enterprise deployment along with: “/service/sso/auth/azure”. The word “azure” can be customized. This will become the name of the SSO configuration that users will see each time they login via SSO. Example URL: https://anchore.example.com/service/sso/auth/azure (Make note of the URL for upcoming steps) - Click Save when finished
Copy the “App Federation Metadata Url” found in section 3. This will be used in the next section.
Configure Users and Groups that will be allowed to login to Anchore Enterprise.
Select Users and groups under Manage.
Click Add user/group.
Click on the hyper-linked “None Selected”.
Select/Check users and/or groups who will be granted access to login to Anchore Enterprise.
Press Select when finished.
Configure Anchore Enterprise to use the Azure Identity Provider
Ensure you have a non-admin Account created in Anchore Enterprise. In this example I am creating an account named “saml” and setting it as the default account to create users who use this SSO configuration but do not already exist in Anchore Enterprise.
Login to Anchore Enterprise and navigate to System, SSO and click on Add new SAML IDP.
Enter the values (Note that all values can be changed except Name):
Under “Name” enter “azure” or whatever you choose to name the SSO integration.
Select the account created or selected in step 1 for “Default Account”.
Select the appropriate role for “Default Role”.
Paste the Federation Metadata URL from the previous section into “IDP Metadata URL”.
Uncheck “Require Signed Response?”.
Save the configuration, configuration is complete when you see a login with ‘azure’ option on the login screen.
Users can now log in to your Anchore Enterprise deployment using this Azure endpoint.
See: Mapping Users and Roles in SSO for more information on using the account
and role defaults, IDP attribute values and understanding how identities are mapped into Anchore Enterprise RBAC system.
Using Azure Groups with Anchore Enterprise user Groups
User groups in Anchore Enterprise can grant users access to multiple Anchore Enterprise accounts with varying/selectable access levels in each.
In this example we have two teams within the organization named TeamA and TeamB. We will create a group in Azure for each team that will be sent to Anchore Enterprise upon SAML login where each team will have their own Anchore Enterprise account. We can optionally grant each team read-only access to the other teams account.
To map groups from Azure to Anchore Enterprise:
Create an account in Anchore Enterprise for TeamA and TeamB.
In Azure create or add desired groups to the “Users and Groups” section of your Anchore Enterprise SSO Enterprise Application.
In Anchore Enterprise create (a) user group(s) matching group names from Azure. Please note that the name of a user group cannot be changed but its contents can be changed at any time. For the sake of this example add both the TeamA and TeamB accounts. Grant the TeamA user group full control to the TeamA account and read-only to the TeamB account. When adding the user group for TeamB grant full-admin access to the TeamB account and read-only access to the TeamA account.
In your Azure Enterprise Application under Single Sign On select edit on Attributes and Claims, section 2.
Click on Add a group claim.
For “Which groups associated with the user should be returned in the claim” Select “Groups assigned to the application”
For Source attribute select “Cloud-only group display names”
At this point when logging in via azure SSO a user will either land in the Default Account and need to switch account from the drop down in the upper right or if an IDP Account Attribute was configured to initially put them in the desired account they would only need to switch accounts appropriately.
5.18.5.1.3 - Okta SAML Example
Configuring SAML SSO for Anchore Enterprise with Okta
Some config choices and assumptions specifically for this example:
Anchore Enterprise GUI endpoint: http://localhost:3000. Replace with the appropriate url as needed.
IDP Config Name: okta. This will identify the specific configuration and is used in urls, and can be any url-safe string you’d like.
The Single Sign-on URL (also called the Assertion Consumer Service/ACS URL) for this deployment will be: http://localhost:3000/service/sso/auth/okta.
This is constructed with the UI endpoint and path /service/sso/auth/{IDP Config Name}
Our SP Entity ID will use the same url: http://localhost:3000/service/sso/auth/okta. This could be different but for simplicity we use the same value.
Configure Okta: Add an Application
See Okta SAML config to see how to create a new
application authorization server. The following steps are used during specific steps of that walk-thru
In step #6
Single sign on URL, this is the URL Okta will direct users to. This must be a URL in the Anchore Enterprise GUI
based on the name you chose for the configuration. In our example: http://localhost:3000/service/sso/auth/okta
Set the Use this for Recipient URL and Destination URL checkbox as well.
a1. Set the Audience URI(SP Entity ID) to a URI that will identify the anchore installation. This can be the same as
the single-sign-on URL for simplicity. We’ll need to enter this value later in the Anchore Enterprise config as well.
Leave Default RelayState empty
Name ID format can be left “Unspecified” or set to an email or username format.
Choose the application username that makes sense for your install. Anchore Enterprise can support a regular username or email address for the usernames.
In step #7, these attribute statements are not required but can be set. This is, however, where you can set additional
attributes that you want Anchore Enterprise to use to initialize the user’s Anchore Enterprise account or permission set. Later in the SAML Configuration
you can specify attributes that Anchore Enterprise will look for to extract the account name and roles for initializing a user that doesn’t yet exist in Anchore Enterprise.
In step #9, be sure to copy the metadata URL link so you have that. Anchore Enterprise will need that value.
Right-click here and copy the link address: The
URL should be something like: https://<youraccount>.okta.com/app/<appid>/sso/saml/metadata
Finish the setup and save the Application entry.
Important: To allow Okta users to login to Anchore Enterprise you need to assign the Okta user to this new Application entry. See
Assign and unassign apps to users for information on this process.
Configure Anchore Enterprise to use the Okta Identity Provider
You’ll need the following information from okta to enter in the Anchore Enterprise GUI:
The name chosen for the configuration: okta in this case
Metadata XML URL (from “configuring okta” step 3.1 above)
The Single Sign-on/ACS URL described in Step 3
In the Anchore Enterprise GUI, create an SSO Idp Configuration:
Login as admin
Select “Configuration” Tab on the top
Select “SSO” on the left-side menu
Click “Let’s Add One” in the configuration listing
And…
Enter the values:
Name: okta - This is the name of the configuration and will be referenced in login and sso URLs, so we use the value
chosen at the beginning of this example
Enabled: True - This controls whether or not users will be able to login with this configuration. We’ll enable it for
the example but can disable later if no longer needed.
ACS HTTPS Port: -1 or 443 - This is the port to use for HTTPS to the ACS (Assertion Consumer Service, in this case the UI). It is only needed if you need to use a non-standard https port
Default Account - The account to add all okta users to when they login, for this example we use oktausers
Default Role - The role to grant okta users when they login in initially. For this example, we use read-write, the standard user type that has most abilities except user management.
IDP Metadata URL - The url from “Configure Okta” step 3.1
Require Signed Assertions - Select On
Require Signed Response - Select On
Save the configuration, configuration is complete when you see a login with ‘okta’ option on the login screen.
Users can now log in to your Anchore Enterprise deployment using this Okta endpoint.
See: Mapping Users and Roles in SSO for more information on using the account
and role defaults, IDP attribute values and understanding how identities are mapped into Anchore Enterprise RBAC system.
In this section you will learn how to create accounts, users, and role assignment with the Anchore Enterprise GUI.
Assumptions
You have a running instance of Anchore Enterprise and access to the UI.
You have the appropriate permissions to create accounts, users, and roles. This means you are either a user in the admin account, or a user that already is a member of the account-users-admin role for your account.
For more information on accounts, users, roles, and permissions see: Role Based Access Control
Navigation
After a successful login, navigate to the System tab on the main menu found on the left.
Creating Accounts
In order to create accounts, navigate to the accounts tab from inside the configuration view and select “Create New Account”.
Upon selection, a popup window will display asking for two items:
Account Name (required)
Email
In the following example I’ve created a ‘security’ account:
Now that a group has been created, I can begin to add users to it.
Viewing Role Permissions
To view the permissions associated with a specific role using the UI, select an account, and navigate to the roles tab:
To view the members in the account assigned to a specific role, select the ‘View’ button on the right-hand side.
Creating Users and assigning Roles
Upon immediate creation of an account, there will, by default be zero users. To add users, select the edit button corresponding the account you would like to add users to. This will bring you to the account page, where you can add your first user by selecting the “Let’s add one!” button.
Upon selection, a popup window will display asking for three items:
Username (required)
Password (required)
Assign Role(s)
Note that you can assign more than one role to a user. For a normal user with full access to add, update, and evaluate images, we recommend assigning the read-write role. The other roles are for specific use-cases such as CI/CD automation, and read-only access for reporting. See: Role Based Access Control from more details on the roles and their capabilities.
In this case I’ve assigned three roles to the user:
Once ‘OK’ is selected, the user will be created and you will be able to edit or remove the user as needed.
Deleting and Disabling Accounts
In order to delete an account, disable the account by sliding the button under the ‘Active’ column for the corresponding account, then select the ‘Remove’ button on the right-hand side.
A few notes to keep in mind when deleting accounts:
The ‘admin’ account is locked and cannot be deleted.
Once deletion is in progress, all resources (users, images, automated tasks, etc) will start a garbage collection process and won’t be viewable. Although it will still be present in the list to prevent admins from adding an account with the same name.
Once deleted, an account and their associated resources can’t be recovered.
A couple notes on disabling accounts:
Disabling accounts is a way for administrators to freeze an account while still keeping any associated analysis info intact.
Any automated tasks associated with the disabled account will be frozen.
Switching Account Data Context
System administrator users are able to view another account’s data context using the dropdown located at the top-right:
Generating API Keys
Enterprise release 5.1 adds support for API keys for various operations. This is to facilitate use-cases where the user does not want to expose their main credentials e.g. integrations can switch to using API keys instead of username/password credentials.
In order to generate an API key, navigate to the Enterprise UI and click on the top right button and select ‘API Keys’:
Clicking ‘API Keys’ will present a dialog that lists your active, expired and revoked keys:
To create a new API key, click on the ‘Create New API Key’ and this will open another dialog where it asks you for relevant details for the API key:
You can specify the following fields:
Name: The name of your API key. It is mandatory and unique i.e. you cannot have two API keys with the same name.
Description: An optional text descriptor for your API key.
Expiry Date: An expiry date for your API key, you cannot specify a date in the past and it cannot exceed 365 days by default.
Click save to save your API key, the UI will display the output of the operation:
NOTE!: Make sure you copy the value that’s output, there is no way to get this key value back.
Revoking API keys
If there is a situation where you feel your API key has been compromised, you can revoke an active key. This prevents the key from being used for authentication.
To revoke a key, click on the ‘Revoke’ button next to a key:
Be careful when revoking a key — this is an irreversible operation. You cannot mark a revoked key as active later.
The UI by default only displays active API keys, if you want to see your revoked and expired keys, check the toggle to ‘Show only active API keys’:
Managing API Keys as an Admin
As an account admin you can manage API keys for all users in the account you are admin in.
A global admin can manage API keys across all accounts and all users.
To access the API keys as an admin, click on the ‘System’ icon and navigate to ‘Accounts’:
Click ‘Edit’ for the account you want to manage keys for and click on the ‘Tools’ button against the user you wish to manage keys for:
5.19.2 - Accounts and Users
System Initialization
When the system first initializes it creates a system service account (invisible to users) and a administrator account (admin) with a single administrator user (admin). The password for this user is set at bootstrap using a default value or an override available in the config.yaml on the catalog service (which is what initializes the db). There are two top-level keys in the config.yaml that control this bootstrap:
default_admin_password - To set the initial password (can be updated by using the API once the system is bootstrapped). Defaults to foobar if omitted or unset.
default_admin_email - To set the initial admin account email on bootstrap. Defaults to admin@myanchore if unset
Managing Accounts Using AnchoreCTL
These operations must be executed by a user in the admin account. These examples are executed from within the enterprise-api container if using the quickstart guide:
First, exec into the enterprise-api container, if using the quickstart docker compose. For other deployment types (eg. helm chart into kubernetes), execute these commands anywhere you have AnchoreCTL installed that can reach the external API endpoint for you deployment.
docker compose exec enterprise-api /bin/bash
Getting Account and User Information
To list all the currently present accounts in the system, perform the following command:
Note that the email address is optional and can be omitted.
At this point the account exists but contains no users. To create a user with a password, see below in the Managing Users section.
Disabling Account
Disabling an account prevents any of that account’s users from being able to perform any actions in the system. It also disabled all asynchronous updates on resources in that account, effectively freezing the state of the account and all of its resources. Disabling an account is idempotent, if it is already disabled the operation has no effect. Accounts may be re-enabled after being disabled.
To restore a disabled account to allow user operations and resource updates, simply enable it. This is idempotent, enabling an already enabled account has no effect.
Deleting an account is irreversible and will delete all of its resources (images, policies, evaluations, reports, etc).
Deleting an account will synchronously delete all users and credentials for the account and transition the account to the deleting state. At this point the system will begin reaping all resources for the account. Once that reaping process is complete, the account record itself is deleted. An account must be in a disabled state prior to deletion. Failure to be in this state results in an error:
anchorectl account delete devteam1
error: 1 error occurred:
* unable to delete account:
{"detail": {"error_codes": []},
"httpcode": 400,
"message": "Invalid account state change requested. Cannot go from state enabled to state deleting"}
So, first you must disable the account, as shown above. Once disabled:
Users exist within accounts, but usernames themselves are globally unique since they are used for authenticating api requests. User management can be performed by any user in the admin account in the default Anchore Enterprise configuration using the native authorizer. For more information on configuring other authorization plugins see: Authorization Plugins and Configuration.
Create User in a User-Type Account
To create a new user credential within a specified account, you can issue the following command. Note that the ‘role’ assigned will dictate the API/operation level permissions granted to this new user. See help output for a list of available roles, or for more information you can review roles and associated permissions via the Anchore Enterprise GUI. In the following example, we’re granting the new user the ‘full-control’ role, which gives the credential full access to operations within the ‘devteam1’ account namespace.
ANCHORECTL_USER_PASSWORD=devteam1adminp4ssw0rd anchorectl user add --account devteam1 devteam1admin --role full-control
✔ Added user devteam1admin
Username: devteam1admin
Created At: 2022-08-25T17:50:18Z
Last Updated: 2022-08-25T17:50:18Z
Source:
Type: native
# anchorectl user list --account devteam1 ✔ Fetched users
┌───────────────┬──────────────────────┬──────────────────────┬────────┬────────┐
│ USERNAME │ CREATED AT │ LAST UPDATED │ SOURCE │ TYPE │
├───────────────┼──────────────────────┼──────────────────────┼────────┼────────┤
│ devteam1admin │ 2022-08-25T17:50:18Z │ 2022-08-25T17:50:18Z │ │ native │
└───────────────┴──────────────────────┴──────────────────────┴────────┴────────┘
That user may now use the API:
ANCHORECTL_USERNAME=devteam1admin ANCHORECTL_PASSWORD=devteam1adminp4ssw0rd ANCHORECTL_ACCOUNT=devteam1 anchorectl user list
✔ Fetched users
┌───────────────┬──────────────────────┬──────────────────────┬────────┬────────┐
│ USERNAME │ CREATED AT │ LAST UPDATED │ SOURCE │ TYPE │
├───────────────┼──────────────────────┼──────────────────────┼────────┼────────┤
│ devteam1admin │ 2022-08-25T17:50:18Z │ 2022-08-25T17:50:18Z │ │ native │
└───────────────┴──────────────────────┴──────────────────────┴────────┴────────┘
Deleting a User
Using the admin credential, or a credential that has a user management role assigned for an account, you can delete a user with the following command. In this example, we’re using the admin credential to delete a user in the ‘devteam1’ account:
ANCHORECTL_USERNAME=admin ANCHORECTL_ACCOUNT=admin ANCHORECTL_PASSWORD=foobar anchorectl user delete devteam1admin --account devteam1
✔ Deleted user
No results
Updating a User Password
Note that only system admins can execute this for a different user/account.
As an admin, to reset another users credentials:
ANCHORECTL_USER_PASSWORD=n3wp4ssw0rd anchorectl user set-password devteam1admin --account devteam1
✔ User password set
Type: password
Value: ***********
Created At: 2022-08-25T17:58:32Z
To update your own password:
ANCHORECTL_USERNAME=devteam1admin ANCHORECTL_PASSWORD=existingp4ssw0rd ANCHORECTL_ACCOUNT=devteam1 anchorectl user set-password devteam1admin
❖ Enter new user password : ●●●●●●●●●●●
❖ Retype new user password : ●●●●●●●●●●●
✔ User password set
Type: password
Value: ***********
Created At: 2022-08-25T18:00:35Z
Or, to perform the operation fully-scripted, you can set the new password as an environment variable:
ANCHORECTL_USERNAME=devteam1admin ANCHORECTL_PASSWORD=existingp4ssw0rd ANCHORECTL_ACCOUNT=devteam1 ANCHORECTL_USER_PASSWORD=n3wp4ssw0rd anchorectl user set-password devteam1admin
✔ User password set
Type: password
Value: ***********
Created At: 2022-08-25T18:01:19Z
5.19.3 - Data Account/Context Switching
Overview
Administrators and specially-entitled standard users are offered the ability to context switch between the image analysis data contexts of different accounts. This capability allows you to view the analysis data held inside a different account while still retaining your own user profile configuration.
When you switch data context, the data-oriented aspects of the application will change but the qualities specific to your original account—herein referred to as your actual account—remain the same. Administrators keep their original permission set and have full control within the switched account. The account availability and associated permission set for standard users is decided by the role configuration of their switching entitlement, and these roles can be additionally set to differ per account.
This feature allows users to gain insights into multiple datasets, can be used by administrators for troubleshooting purposes or to make ad-hoc modifications to the data-oriented aspects of any account, and provides standard users with an additional level and vector of access control.
This following sections in this document describes how to switch and reset data contexts—both as an administrator and as a standard user—and how administrators can assign this capability to standard users.
Administrative Users
Context switching as as an administrator is available without prior configuration, and only requires that an account other than your own be available. When you click the account button in the top-right of the screen you are presented with a menu that contains an entry called Switch Account Data Context, which will be enabled when one or more accounts other than your own are present.
Clicking this item displays a submenu that describes all currently available accounts—both active and disabled—into which you can switch context:
Your home account is represented by the label Actual. If an account is disabled, this is indicated by the label Disabled (note that only administrators can context switch into disabled accounts). The account category—administrator or standard user—is indicated by the user-type icon.
Your current data context is represented by an entry with an emphasized title and checkmark prefix. When you click an entry for a different account, the application view will switch to use the data provided by this new context. The account button and dropdown items are similarly updated to reflect this change:
You will also notice a change to the background color of the main view, which serves as a reminder that your current data context is now different than the one provided by your actual account. In addition, a button is now present on the navigation bar that allows you to immediately revert to your actual data context when clicked (you can of course also use the menu to do this):
In the above example, the analysis information now presented is exactly what a user of the standard account would see in their actual account. As an administrator, you are now free to browse and interact with this data, add tags or repositories for analysis, create policies etc., and there are no permission restrictions on any of these operations.
Note: only the analysis data context has switched, and this new state does not extend to application data items such a private registry configurations.
Standard Users
Non-administrative users can also switch context if this capability has been conferred upon them by an administrator.
When you add a new standard user (or modify an existing one) you can optionally associate them with one or more additional accounts, providing those accounts are not currently disabled. The Add a New User dialog, which is accessed from within the account editor in the Configuration > Accounts view, is shown below:
Note: If an account is currently active and available for addition, but is subsequently disabled, the standard user will not be able to switch into that account.
For each associated account you must also provide one or more RBAC roles that determine how the standard user can interact with that account after they have switched context:
For example, a user may have full-control within their actual account, but could be restricted to read-only operations after switching context. You can provide multiple different roles for different accounts, but you must provide at least one role per account association:
Account associations can also be removed by clicking the X adjacent to each role list, or by removing the labels directly from the Associate Account(s) dropdown control.
Once you are satisfied with the user configuration, click OK to create (or update) these associations. The standard user will now be able to switch account data context using the same procedure as the one described for administrators, presented earlier in this document.
5.19.4 - Role-Based Access Control
Overview
Anchore Enterprise includes support for using Role-Based Access Control (RBAC) to control the permissions that a specific user has to a specific set of resources in the system. This allows administrators to configure specific, limited permissions on user enabling limited access usage for things like CI/CD automation accounts, read-only users for browsing analysis output, or security team users that can modify policy but not change image analysis configuration.
Anchore Enterprise provides a predefined of roles. Please see table below for complete list.
The Enterprise UI contains an enumeration of the specific permissions granted to users that are members of each of the roles.
Roles, Users, and Accounts
Roles are applied within the existing account and user frameworks defined in Anchore Enterprise. Resources are still scoped to the account namespace and accounts provide full resource isolation (e.g. an image must be analyzed within an account to be referenced in that account). Roles allow users to be granted permissions in both the account to which they belong as well as external accounts to facilitate resource-sharing.
Terminology
User: An authenticated identity (a principal in rbac-speak).
Account: A resource namespace and user grouping that also defines an authorization domain to which permissions are applied.
Role: A named set of permissions.
Permission: An action to grant an operation on a set of resources.
Action: The operation to be executed, such as listImages, createRegistry, and updateUser.
Target: The resource to be operated on, such as an image digest.
Role Membership: Mapping a username to a role within a specific account. This confers the permissions defined by the role to resources in the specified account to the specified user. The user is not required to be a member of the account itself.
Constraints
A user may be a member of a role within one or more accounts.
A user may be a member of many roles, or no roles.
There is no default role set on a user when a user is created. Membership must be explicitly set.
Roles are immutable. The set of actions they grant is static.
Creating and deleting accounts is only available to users in the admin account. The scope of accounts and roles is different than other resources because they are global. The authorization domain for those resources is not the account name but rather the global domain: system.
Role Summary and Permissions
Role
Allowed Actions
Description
system-admin
All actions within all domains.
Administrative control over all domains within the system. USE WITH EXTREME CAUTION
full-control
All actions within a specific account domain.
Full control over any account granted for. USE WITH EXTREME CAUTION
Manage account creation and addition of users to accounts.
account-viewer
listAccounts
Role which can list all accounts on the system. This role is only available for use in the system domain. This role can only be conferred by a system administrator.
Role which can list all users on the system. This role is only available for use in the system domain. This role can only be conferred by a system administrator.
Role to create and modify applications, app versions, and assets. Companion role to read-only. Does not include delete permission, which is included in the application-delete role.
application-delete
deleteApplications
Role to delete applications, app versions, and assets. Companion role to read-only.
All account-scoped roles have these roles implicitly granted as well: selfListApiKeys, selfCreateApiKey, selfUpdateApiKey, selfDeleteApiKey, selfGetApiKey, selfGetCredentials, selfAddCredential, selfDeleteCredential.
Granting Cross-Account Access
The Anchore API supports a specific mechanism for allowing a user to make requests in another account’s namespace, the x-anchore-account header. By including x-anchore-account: "desiredaccount" on a request, a user can attempt that request in the namespace of the other account. This is subject to full authorization and RBAC.
To grant a username the ability to execute operations in another account, simply make the username a member of a role in the desired account. This can be accomplished in the UI or via API against the RBAC Manager service endpoint. For example, using curl:
This should be done with caution as there is currently no support for resource-specific access controls. A user will have the permitted actions on all resources in the other account (based on the permissions of the role). For example, making a user a member of policy-editor role for another account will enable full ability to create, delete, and update that account’s policy bundles.
WARNING: Because roles do not currently provide custom target/resource definitions, assigning users to the Account User Admin role for an account other than their own is dangerous because there are no guards against that user then removing permissions of the granting user (unless that user is an ‘admin’ account user), so use with extreme caution.
NOTE: admin account users are not subject to RBAC constraints and therefore always have full access to add/remove users to roles in any account. So, while it is possible to grant them role membership, the result is a no-op and does not change the permissions of the user in any way.
5.19.4.1 - User Groups
Overview
User groups are abstractions that allow an administrator to manage permissions for users across the system without having to manage each individual user’s permissions.
Administrators simply have to create a user group, define roles per accounts within the user group and then associate users with it. Users can be associated with multiple user-groups. Each user inherits roles from their user group as well as any explicitly defined roles.
Users can be explicitly added to a User Group (as described above) or SAML users can have an indirect membership of a user group based on their IDP associations.
Note: User Group management is strictly limited to admin users only.
Terminology
User Group: A basic resource that grants roles and permissions to users on various accounts
"name": "user-group-engineers",
"description": "The group permissions for all engineers",
User Group Roles: A collection of roles associated with a user group, this can span multiple accounts and have multiple roles per account. E.g.
User Group Native User Member: A native user who has been explicitly associated with a User Group. This user inherits all roles from the User Group in addition to any roles assigned directly to this user.
User Group IDP Member: An SAML user who is an indirect member of a User Group. As the SAML user authenticates, the IDP’s User Group Mappings are used to determine if this user should be associated with a User Group.
Native users
Native users are users that are defined in Anchore Enterprise and do not authenticate using an external SSO endpoint.
These users can be added to User Groups directly and inherit roles from the User Groups they are members of.
SAML(SSO) users
SAML users are users that authenticate using an external SAML IDP.
These users can be associated with User Groups based on their group memberships in the SAML IDP.
SAML users are automatically added to a User Group based on their group memberships in the SAML IDP and the IDP’s User Group associations.
User Group management
User Groups can be managed from the Anchore Enterprise GUI or using the Anchore Enterprise API.
AnchoreCTL
User Groups can be managed using the anchorectl CLI tool. The following commands are available for User Group management:
To create a new User Group, use the following command:
anchorectl usergroup add development --description "The development team" ✔ Added usergroup
Name: development
Description: The development team
Group Uuid: 4a5d8357-1fc3-44cf-8a1c-9882406df656
Created At: 2024-03-20T15:57:20.086665Z
Last Updated: 2024-03-20T15:57:20.086669Z
Account Roles:
Items:
To list all User Group, use the following command:
anchorectl usergroup list
┌─────────────┬──────────────────────┬──────────────────────────────────────┐
│ NAME │ DESCRIPTION │ GROUP UUID │
├─────────────┼──────────────────────┼──────────────────────────────────────┤
│ development │ The development team │ 4a5d8357-1fc3-44cf-8a1c-9882406df656 │
└─────────────┴──────────────────────┴──────────────────────────────────────┘
To edit the description of a User Group, use the following command:
anchorectl usergroup update development --description "New development team description" ✔ Update usergroup
Name: development
Description: New development team description
Group Uuid: 4a5d8357-1fc3-44cf-8a1c-9882406df656
Created At: 2024-03-20T15:57:20.086665Z
Last Updated: 2024-03-20T16:00:17.989822Z
Account Roles:
Items:
To delete a User Group, use the following command:
anchorectl usergroup delete development
✔ Deleted usergroup
No results
To add an account role to a User Group, use the following command:
To list all account roles for a User Group, use the following command:
anchorectl usergroup role list development
✔ Fetched usergroups accounts and roles
┌────────────────┬───────────────────────────────────────────────────────────┐
│ ACCOUNT/DOMAIN │ ROLES │
├────────────────┼───────────────────────────────────────────────────────────┤
│ dev_account │ image-analyzer, image-developer, read-only, repo-analyzer │
│ devops_account │ read-only │
└────────────────┴───────────────────────────────────────────────────────────┘
To remove account role(s) from a User Group, use the following command:
anchorectl usergroup role delete development dev_account --role image-analyzer,image-developer
✔ Deleted role
No results
To add a native user to a User Group, use the following command:
anchorectl usergroup user add development -u dev_user
✔ Added user(s)┌──────────┬─────────────────────────────┐
│ USERNAME │ ADDED TO USER GROUP ON │
├──────────┼─────────────────────────────┤
│ dev_user │ 2024-03-20T16:30:20.092909Z │
└──────────┴─────────────────────────────┘
To list all members of a User Group, use the following command:
anchorectl usergroup user list development
✔ Fetched users within usergroup
┌──────────┬─────────────────────────────┐
│ USERNAME │ ADDED TO USER GROUP ON │
├──────────┼─────────────────────────────┤
│ dev_user │ 2024-03-20T16:30:20.092909Z │
└──────────┴─────────────────────────────┘
To remove a native user from a User Group, use the following command:
anchorectl usergroup user delete development -u dev_user
✔ Deleted user(s)No results
6 - Monitoring
After you have installed Anchore Enterprise, there are various ways to monitor its operations:
The Health section within the System tab is an administrator’s display for investigating the operational status of their system’s various services and feeds. Leverage this view to understand when your system is ready or if it requires intervention.
The following sections in this document describe how to determine system readiness, the state of your services, and the progression of your feed sync.
For more information on the overall architecture of a full Anchore Enterprise deployment, please refer to the Architecture documentation. Or refer to the Feeds Overview if you’re interested in the feeds-side of things.
System Readiness
Ready
All required services have at least one available instance. Fetch for feeds provides some data (was correctly configured at one point). Every feed group successfully returns records (was synced at one point and provides meaningful data). Your system is ready and all feed data is available to you. Craft your custom policy, analyze images, and view in-depth information.
(Tentatively) Ready
All required services have at least one available instance. Fetch for feeds provides some data (was correctly configured at one point). At least one feed group has either not synced or is without records. Your required services are available but at least one feed group has either not synced or provided records. Craft your custom policy and interact with the system as you wish but keep in mind that image analyses won’t contain complete vulnerability data until all groups have synced. To clarify, you can still analyze images but you may experience a spike in vulnerabilities once the feeds have completely synced which can cause policy evaluation and analysis result changes.
Not Ready
At least one of the services required by the system to function is not available. Fetch for feeds has yet to return anything in the event of a system initialization or feeds misconfiguration. Unfortunately, something went wrong. If any of your required services are not available, the main system flow has been impacted and you may be blocked from some actions such as policy evaluation or image analysis. The indicator for system readiness can be seen from any screen by viewing the System tab header:
The system readiness status relies on the service and feed data which are routinely updated every 5 minutes. Using the example indicator provided above, once all the feed groups are successfully synced, the status icon will turn green.
For up-to-date information outside of the normal update cycle, navigate to the Health section within the System tab and click Refresh Service Health, Refresh Feed Data, or manually refresh the page.
Services
The v6 system runs ten services (apiext, Catalog, Component Catalog, Policy Engine, Data Syncer, SimpleQueue, Analyzer, Notifications, Reports, and Reports Worker).
For every service, the Base URL, Host ID, and Version is displayed. As long as one instance of each service is up and available, the main system is regarded as ready. In the example image provided above, we see that we have multiple instances of the Policy Engine and Analyzer services.
For the full, filterable list of instances for that service, click on the numbers provided. In the case of the Policy Engine, that would be the 1/2 Available.
Note that orphaned services are filtered out by default in this view (with a toggle to include it again) but will still impact the availability count on the main page.
In the case of service errors, they are logged within the Events & Notifications tab so we recommend following up there for more information or browse our Troubleshooting documentation for remediation guidance.
Feeds Sync
Listed in this section are the various feed groups your system relies on for vulnerability and package data. This data comes from a variety of upstream sources which is vital for policy engine operations such as evaluating policies or listing vulnerabilities.
As shown, you can keep track of your sync progression using the Last Sync column. To manually update the feed data displayed outside of its normal 5-minute cycle, click the Refresh Feed Data button or refresh the page.
If you’d rather have them grouped by feed rather than listed out individually, you can toggle the layout from list to cards using the buttons in the top-right corner above the table:
Similar to the service cards, if you decide to have them grouped as we show below using the layout buttons, you can click on the number of groups synced to view the full, filterable list within.
When viewing a list of feed groups - whether through the default list or through a specific feed card - you can filter for a specific value using the input provided or click on the button attached to filter by category. In this case, groups can be filtered by whether they are synced or unsynced.
In the case of feed sync errors, they are logged within the Events & Notifications tab so we recommend following up there for more information or browse our Troubleshooting documentation for remediation guidance.
Or if you’re interested in an overview of the various drivers Enterprise Feeds uses, check out our Feeds Overview.
6.2 - Prometheus
Anchore Enterprise exposes prometheus metrics in the API of each service if the
config.yaml that is used by that service has the metrics.enabled key set to
true.
Each service exports its own metrics and is typically scraped by a Prometheus
installation to gather the metrics. Anchore Enterprise does not aggregate or distribute
metrics between services. You should configure your Prometheus deployment or
integration to check each Anchore Enterprise service’s API using the same port it exports
for the /metrics route.
Monitoring in Kubernetes and/or Helm Chart
Prometheus is very commonly used for monitoring Kubernetes clusters. Prometheus
is supported by core Kubernetes services. There are many guides on using
Prometheus to monitor a cluster and services deployed within, and also many
other monitoring systems can consume Prometheus metrics.
The Anchore Enterprise Helm Chart includes a quick way to enable the Prometheus metrics on
each service container:
Or, set it directly in your customized values.yaml
## @param anchoreConfig.metrics.enabled Enable Prometheus metrics for all Anchore services## @param anchoreConfig.metrics.auth_disabled Disable auth on Prometheus metrics for all Anchore services##metrics:enabled:trueauth_disabled:false
To deploy the Prometheus container and expose it externally, you can configure an Ingress controller, such as NGINX, within the Helm chart values:
# Prometheus Configurationprometheus:ingress:enabled:trueingressClassName:"nginx"# Specify your Ingress controllerhosts:- anchoredemo.com# The hostname to access Prometheuspaths: # Note:paths is typically an array- /prometheuspathType:Prefix# Or ImplementationSpecific, Exact. 'Prefix' is common.prometheusSpec:#retention: 10dexternalUrl:"https://anchoredemo.com/prometheus"# Ensure this matches your ingress pathroutePrefix:"/prometheus"podMonitorSelectorNilUsesHelmValues:falsepodMonitorSelector:matchLabels:release:"kube-prom-stack"
Because Anchore Enterprise scales horizontally, there can often be multiple replicas of each service running at any given time. This scaling behavior makes it essential to use a monitoring approach that can dynamically discover and track all active pods, so, to monitor the Anchore Enterprise Pods we will be deploying a PodMonitor. Since Anchore Enterprise creates multiple instances of certain services (for example, analyzers), relying on static service discovery is not always the most practical method and therefore the PodMonitor is our recommended method for pod discovery/tracking.
The PodMonitor resource allows Prometheus to:
Dynamically detect new or removed Anchore Enterprise pods as the deployment scales up or down.
Automatically update its scrape configuration without manual intervention.
Collect metrics directly from the /metrics endpoints of each pod, even when no Service is defined.
If you run the kubectl get svc command in your Anchore Enterprise namespace, you will notice that the analyzer does not have a service so it is not reachable through a loadbalancer. PodMonitor will figure this out for Prometheus as each pod uses a different port.
The PodMonitor will find the Anchore Enterprise pods and edit the Prometheus config to allow it to automatically discover and scrape the metrics.
PodMonitor Example
You must set up the PodMonitor and configure the necessary secrets used to collect the metrics from /metric endpoints on the pod. The following is an example that can be used as a template for your own configuration:
kubectl apply -f - <<EOFapiVersion:monitoring.coreos.com/v1kind:PodMonitormetadata:name:anchore-enterprise-metricsnamespace:monitoringlabels:team:my-monitoring-teamrelease:kube-prom-stackspec:namespaceSelector:matchNames:- anchore#Set this to match the namespace Anchore is deployed inselector:matchLabels:app.kubernetes.io/part-of:anchore# ADJUST THIS label selectorpodMetricsEndpoints:- path:/metrics# The endpoint path for metrics# By omitting the 'port' field, Prometheus will attempt to scrape # the '/metrics' path on ALL declared ports of the selected pods.scheme:http# Assuming metrics are exposed over HTTP# Interval and scrapeTimeout values can be uncommented below and customized if needed# interval: 30s# scrapeTimeout: 10sbasicAuth:username:name:anchore-metrics-credentials# Name of the Secretkey:username# Key inside the Secretpassword:name:anchore-metrics-credentials# Name of the Secretkey:password# Key inside the SecretEOF
kubectl apply -f - <<EOF# This secret stores the credentials that Prometheus will use# to authenticate when scraping metrics from the Anchore service pods.apiVersion:v1kind:Secretmetadata:name:anchore-metrics-credentialsnamespace:monitoring# Must be the namespace where Prometheus is installedtype:Opaquedata:# The username to use for Basic Auth (usually 'admin' for Anchore metrics endpoint)username:YWRtaW4=# Base64 of 'admin'# IMPORTANT: Replace [YOUR_BASE64_OUTPUT] with the Base64-encoded version of # the ANCHORE_ADMIN_PASSWORD you have configured in your deployment.password:[YOUR_BASE64_OUTPUT]EOF
It is imperative that users carefully review the commented lines within the code snippet and modify the configuration to align with their specific environment. Specifically the selectors for the namespace (matchNames) and labels (matchLabels) to match your deployment, as they define the scope of the pods the PodMonitor tracks. Any new pods subsequently created with matching labels in the specified namespaces will be automatically discovered and monitored by the PodMonitor based on this configuration.
For comprehensive details on the resource definition, refer to the official PodMonitor documentation here;
The specific strategy for monitoring services with prometheus is outside the
scope of this document. But, because Anchore exposes metrics on the /metrics
route of all service ports, it should be compatible with most monitoring
approaches (daemon sets, side-cars, etc).
Anchore services export a range of metrics. The following list shows some
Anchore services that can help you determine the health and load of an Anchore
deployment.
anchore_global_images_analysis_status
This metric provides a global count of images broken down by analysis status.
The analysis_status label indicates the state: not_analyzed, analyzing,
analyzed, or analysis_failed.
As the not_analyzed count grows you can expect longer analysis times.
Adding more analyzers to a system can help drain the queue faster and keep
wait times to a minimum.
This metric is exported from the catalog service and is based on the database
state.
anchore_monitor_runtime_seconds
This is a Summary metric that records the duration of each async watcher
process as it executes on a duty cycle. The function label identifies the
watcher and the status label indicates success or fail.
As the system grows, these durations will become longer to account for more
tags to check for updates, repos to scan for new tags, and user
notifications to process.
anchore_tmpspace_available_bytes
This metric tracks the available space in the “tmp_dir” location for each
container. This is most important for the instances that are analyzers where
this can indicate how much disk is being used for analysis and how much
overhead there is for analyzing large images.
This is expected to be consumed in cycles, with usage growing during
analysis and then flushing upon completion. A consistent growth pattern here
may indicate left over artifacts from analysis failures or a large
layer_cache setting that is not yet full. The layer cache (see Layer
Caching) is located in this space and thus will affect the metric.
process_resident_memory_bytes
This is the memory actually consumed by the instance, where each instance is
a service process of Anchore. Anchore is fairly memory intensive for large
images and in deployments with lots of analyzed images due to lots of json
parsing and marshalling, so monitoring this metric will help inform capacity
requirements for different components based on your specific workloads. Lots
of variables affect memory usage, so while we give recommendations in the
Capacity Planning document, there is no substitute for profiling and
monitoring your usage carefully.
6.3 - Event Log
Introduction
The event log subsystem provides the users with a mechanism to inspect asynchronous events occurring across various Anchore Enterprise services. Anchore events include periodically triggered activities such as vulnerability data feed syncs in the policy-engine service, image analysis failures originating from the analyzer service, and other informational or system fault events. The catalog service may also generate events for any repositories or image tags that are being watched, when the engine encounters connectivity, authentication, authorization or other errors in the process of checking for updates. The event log is aimed at troubleshooting most common failure scenarios (especially those that happen during asynchronous engine operations) and to pinpoint the reasons for failures, that can be used subsequently to help with corrective actions. Events can be cleared from Anchore Enterprise in bulk or individually.
The Anchore events (drawn from the event log) can be accessed through the Anchore Enterprise API and AnchoreCTL, or can be emitted as webhooks if your Anchore Enterprise is configured to send webhook notifications. For API usage, refer to the API documentation.
Accessing Events
The anchorectl command can be used to list events and filter through the results, get the details for a specific event and delete events matching certain criteria.
anchorectl event --help
Event related operations
Usage:
event [command]
Available Commands:
delete Delete an event by its ID or set of filters
get Lookup an event by its event ID
list Returns a paginated list of events in the descending order of their occurrence
Flags:
-h, --help help for event
Use " event [command] --help" for more information about a command.
For help regarding global flags, run --help on the root command
Events are ordered by the timestamp of their occurrence, the most recent events are at the top of the list and the least recent events at the bottom.
There are a number of ways to filter the event list output (see anchorectl event list --help for filter options):
For troubleshooting events related to a specific event type:
anchorectl event list --event-type system.analysis_archive.image_archive_failed
✔ List events
┌──────────────────────────────────┬──────────────────────────────────────────────┬───────┬──────────────┬───────────────┬────────────────┬────────────────────┬────────────────────────────┐
│ UUID │ EVENT TYPE │ LEVEL │ RESOURCE ID │ RESOURCE TYPE │ SOURCE SERVICE │ SOURCE HOST │ TIMESTAMP │
├──────────────────────────────────┼──────────────────────────────────────────────┼───────┼──────────────┼───────────────┼────────────────┼────────────────────┼────────────────────────────┤
│ 35114639be6c43a6b79d1e0fef71338a │ system.analysis_archive.image_archive_failed │ error │ nginx:latest │ image_digest │ catalog │ anchore-quickstart │ 2022-08-24T22:48:23.18113Z │
└──────────────────────────────────┴──────────────────────────────────────────────┴───────┴──────────────┴───────────────┴────────────────┴────────────────────┴────────────────────────────┘
To filter events by level such as ERROR or INFO:
anchorectl event list --level info
✔ List events
┌──────────────────────────────────┬─────────────────────────────────────────────┬───────┬─────────────────────────────────────────────────────────────────────────┬───────────────┬────────────────┬────────────────────┬─────────────────────────────┐
│ UUID │ EVENT TYPE │ LEVEL │ RESOURCE ID │ RESOURCE TYPE │ SOURCE SERVICE │ SOURCE HOST │ TIMESTAMP │
├──────────────────────────────────┼─────────────────────────────────────────────┼───────┼─────────────────────────────────────────────────────────────────────────┼───────────────┼────────────────┼────────────────────┼─────────────────────────────┤
│ 60f14821ff1d407199bc0bde62f537df │ system.image_analysis.restored_from_archive │ info │ sha256:89020cd33be2767f3f894484b8dd77bc2e5a1ccc864350b92c53262213257dfc │ image_digest │ catalog │ anchore-quickstart │ 2022-08-24T22:53:12.662535Z │
│ cd749a99dca8493889391ae549d1bbc7 │ system.analysis_archive.image_archived │ info │ sha256:89020cd33be2767f3f894484b8dd77bc2e5a1ccc864350b92c53262213257dfc │ image_digest │ catalog │ anchore-quickstart │ 2022-08-24T22:48:45.719941Z │
...
Event listing response is paginated; anchorectl displays the first 100 events matching the filters. For all the results, use the –all flag.
All available options for listing events:
anchorectl event list --help
Returns a paginated list of events in the descending order of their occurrence. Optional query parameters may be used for filtering results
Usage:
event list [flags]
Flags:
--all return all events (env: ANCHORECTL_EVENT_ALL)
--before string return events that occurred before the ISO8601 formatted UTC timestamp
(env: ANCHORECTL_EVENT_BEFORE)
--event-type string filter events by a prefix match on the event type (e.g. "user.image.")
(env: ANCHORECTL_EVENT_TYPE)
-h, --help help for list
--host string filter events by the originating host ID (env: ANCHORECTL_EVENT_SOURCE_HOST_ID)
--level string filter events by the level - INFO or ERROR (env: ANCHORECTL_EVENT_LEVEL)
-o, --output string the format to show the results (allowable: [text json json-raw id]; env: ANCHORECTL_FORMAT) (default "text")
--page int32 return the nth page of results starting from 1. Defaults to first page if left empty
(env: ANCHORECTL_PAGE)
--resource-type string filter events by the type of resource - tag, imageDigest, repository etc
(env: ANCHORECTL_EVENT_RESOURCE_TYPE)
--service string filter events by the originating service (env: ANCHORECTL_EVENT_SOURCE_SERVICE_NAME)
--since string return events that occurred after the ISO8601 formatted UTC timestamp
(env: ANCHORECTL_EVENT_SINCE)
For help regarding global flags, run --help on the root command
Event listing displays a brief summary of the event, to get more detailed information about the event such as the host where the event has occurred or the underlying the error:
anchorectl event get c31eb023c67a4c9e95278473a026970c
✔ Fetched event
UUID: c31eb023c67a4c9e95278473a026970c
Event:
Event Type: system.image_analysis.registry_lookup_failed
Level: error
Message: Referenced image not found in registry
Resource:
Resource ID: docker.io/aerospike:latest
Resource Type: image_reference
User Id: admin
Source:
Source Service: catalog
Base Url: http://catalog:8228
Source Host: anchore-quickstart
Request Id:
Timestamp: 2022-08-24T22:08:28.811441Z
Category:
Details: cannot fetch image digest/manifest from registry
Created At: 2022-08-24T22:08:28.812749Z
Clearing Events
Events can be cleared/deleted from the system in bulk or individually. Bulk deletion allows for specifying filters to clear the events within a certain time window. To delete all events from the system:
anchorectl event delete --all
Use the arrow keys to navigate: ↓ ↑ → ←
? Are you sure you want to delete all events:
▸ Yes
No
⠙ Deleting event
c31eb023c67a4c9e95278473a026970c
329ff24aa77549458e2656f1a6f4c98f
649ba60033284b87b6e3e7ab8de51e48
4010f105cf264be6839c7e8ca1a0c46e
...
Delete events before a specified timestamp (can also use --since instead of --before to delete events that were generated after a specified timestamp):
In addition to access via API and AnchoreCTL, the Anchore Enterprise may be configured to send notifications for events as they are generated in the system via its webhook subsystem. Webhook notifications for event log records is turned off by default. To turn enable the ’event_update’ webhook, uncomment the ’event_log’ section under ‘services->catalog’ in config.yaml, as in the following example:
services:...catalog:...event_log:notification:enabled:True# (optional) notify events that match these levels. If this section is commented, notifications for all events are sentlevel:- error
For events to be sent via webhook notifications, the webhook subsystem must be configured in config.yaml (if it isn’t already) — refer to the Notifications documentation for information on how to enable webhooks in Anchore Enterprise. Event notifications will be sent to the event_update webhook endpoint if it is defined, and the general webhook endpoint otherwise.
Events via the GUI
The Events tab is your gateway to current and historical activity happening in your system. View various events such as policy evaluation and vulnerability updates, system errors, feed syncs, and more.
The following sections in this document describe how to view event details, how to filter for specific events you’re interested in, and how to manage events with bulk deletion.
Viewing Events
In order to view events, navigate to the Events & Notifications > View Events tab. By default, the most recent activity (up to 1000 events) is shown and is automatically updated for you every 5 minutes. Note that if you have applied any filters through the search bar, your results will need to be refreshed manually.
Top-level details such as the event’s level (whether it’s an INFO or ERROR event), type, message, and affected resource is shown. Dig in to a specific event by clicking View Details under its Actions column to expand the row.
Additional information such as the originating service and host ID are available in the expanded row. Any details given by the service are also provided in JSON format to view or copy to clipboard.
Filtering Events
Often, you might want to search for a specific event type or events that happened after a certain time. In this case, use the Search Events bar near the top of the page to select a filter to search on. These include:
Level
Filter events by level - INFO or ERROR
Event Type
Filter events by a match on the event type (e.g. “user.image.*”)
Since
Return events that occurred after the timestamp
Before
Return events that occurred before the timestamp
Source Servicename
Filter events by the originating service
Source Host ID
Filter events by the originating host ID
Resource Type
Filter events by the type of resource - tag, imageDigest, repository, etc.
Resource ID
Filter events by the id of the resource
Once you have selected and populated the filter fields you’re interested in, click Apply Filters to search and show those filtered results.
An alternative way to filter your results is through the in-table filter input. Note that this only applies against any data already fetched. To increase what you’re filtering on, click Fetch More near the top-right of the table for up to an additional 1000 items.
To remove any filters and reset to the default view, click Clear Filters.
Deleting Events
Deleting individual events can be done simply through clicking Delete under the Actions column and selecting Yes to confirm. Note that after deletion, events are not recoverable.
Multi-select is available for deleting multiple events at a time. Upon selecting an event using the checkbox in the far-left column, a toolbar-like component will slide in at the bottom of the table. The number of events selected is shown along with the selection type, Clear Selection, and Delete Events options.
Checking the box in the header will select all events within that page.
By default, it is viewed as a Custom selection. Choosing to select All Retrieved events auto-selects everything already fetched and present in the table (i.e. if a filter is applied, events not matching the filter are not selected but will be upon removal of the filter). In this state, deselecting an item will trigger a custom selection again.
Selecting All events will again auto-select all events already fetched and present in the table but while applying a filter may modify what’s viewable, this option is solely for clearing the entire backlog of events - including those not shown. In this state, deselecting an item will also trigger a custom selection.
Once you have selected the events you wish to remove, click Delete Events to open a modal and review up to 50 items. Any events you don’t wish to delete anymore can be deselected as well. To continue with removal, click Yes to confirm and start the process.
Note that events are account-wide and that any events removed will be mirrored across all users in the account.
6.4 - Integration
Overview
Anchore Enterprise exposes an API through which external software entities like inventory
agents can report their health status. These software entities (agents, plugins etc.) serve
as a mechanism for external systems like Kubernetes clusters or container image repositories
to integrate with Anchore Enterprise.
Upgrading from one minor version of Anchore Enterprise to another is normally handled seamlessly by the Helm chart or an upsert of your Docker Compose configuration which are both supplied with each release. Those follow the general methods from this doc page, however for some major releases there are Specific Instructions which you may have to review.
To retrieve the current version of Anchore Enterprise the anchorectl system status command can be run, and the output will have a CODE VERSION column, which will display the running version of each service. You can also login to the Anchore Enterprise GUI and find the version details in the top bar.
Upgrade Procedure
Prior to upgrading Anchore Enterprise, it is highly recommended to first review the Anchore Enterprise Release Notes and review the entire doc with particular attention on the Recommended Component Versions as well as the Requirements sections.
The Requirements section shares important notices and/or DB schema changes and any possible suggested downtime needed for schema and/or data changes.
The Recommended Component Versions section details the supported versions of integration tooling like AnchoreCTL, this might require further upgrades of other software components across your environment to maintain compatibility with the core Anchore Enterprise service.
When you are ready to perform an upgrade, we recommend, as a best practice, that you first Backup/snapshot your Database. When backing up, you must first stop your Anchore Enterprise services/deployment so that all services have completed their writes. We also highly recommend you test upgrades in a QA/Test environment first.
There is no automatic downgrade capability. The only way to downgrade after an upgrade — whether it succeeds or fails — is to restore your database contents to a state from a prior version of Anchore Enterprise, then explicitly run the compatible version of Anchore Enterprise against the corresponding database version.
Kubernetes (Helm) Upgrade Procedure
A Helm pre-upgrade hook initiates a Kubernetes job that scales down all active Anchore Enterprise pods and handles the Anchore Enterprise database upgrade.
The Helm upgrade is marked as successful only upon the job’s completion. This process causes the Helm client to pause until the job finishes and new Anchore Enterprise pods are initiated. To monitor the upgrade, follow the logs of the upgrade jobs. These jobs are automatically removed after a subsequent successful Helm upgrade.
An optional post-upgrade hook is available to perform Anchore Enterprise upgrades without forcing all pods to terminate prior to running the upgrade. To enable the post-upgrade hook, set upgradeJob.usePostUpgradeHook=true in your values file.
Once upgraded, you can review the new state of your Anchore Enterprise install to verify the new version is running using the regular system status command.
First review the ’name’ and volume(s) used in your new compose file. Failure to match these to your existing deployment and older Compose file will result in a new/clean deployment rather than an upgrade.
Stop all running instances of Anchore Enterprise
docker compose down
Make a copy of your original docker-compose.yaml file as backup
Review the latest docker-compose.yaml and merge any edits/changes from your original docker-compose.yaml.backup to the latest docker-compose.yaml
Restart the Anchore Enterprise containers
docker compose up -d
To monitor the progress of your upgrade, you can watch the docker logs from your catalog container, where you should see some initial output indicating whether or not an upgrade is needed or being performed, followed by the regular Anchore Enterprise log output.
docker compose logs -f catalog
Once upgraded, you can review the new state of your Anchore Enterprise install to verify the new version is running using the regular system status command.
anchorectl system status
Manual Upgrade Procedure
If for any reason the automated upgrade fails, or you would like to perform the upgrade of the Anchore Enterprise database manually, you can use the following (general) procedure. This should only be done by advanced operators after backing up the Anchore Enterprise database, ensuring that the Anchore Enterprise database is up and running, and that all running Anchore Enterprise components are stopped.
Install the desired Anchore Enterprise container manually.
Run the Anchore Enterprise container but override the entrypoint to run an interactive shell instead of the default ‘anchore-manager service start’ entrypoint command.
Manually execute the database upgrade command, using the appropriate db_connect string. For example, if using Postgres, the db_connect string will look like postgresql://$ANCHORE_DB_HOST/$ANCHORE_DB_NAME?user=$ANCHORE_DB_USER&password=$ANCHORE_DB_PASSWORD
$ anchore-manager db --db-connect "postgresql://$ANCHORE_DB_HOST/$ANCHORE_DB_NAME?user=$ANCHORE_DB_USER&password=$ANCHORE_DB_PASSWORD" upgrade
#Output
[MainThread] [anchore_manager.cli.utils/connect_database()] [INFO] DB params: {"db_connect_args": {"timeout": 86400, "ssl": false}, "db_pool_size": 30, "db_pool_max_overflow": 100}
[MainThread] [anchore_manager.cli.utils/connect_database()] [INFO] DB connection configured: True
[MainThread] [anchore_manager.cli.utils/connect_database()] [INFO] DB attempting to connect...
[MainThread] [anchore_manager.cli.utils/connect_database()] [INFO] DB connected: True
...
...
The output will indicate whether or not a database upgrade is needed. It will then prompt for confirmation if it is, and will display upgrade progress output before completing.
Specific Version Upgrades
This section is intended as a guide for any special instructions and information related to upgrading to specific versions of Anchore Enterprise.
There is no upgrade path from Anchore Enterprise v5.x to v6.0. A v5.x to v6.x migration guide is expected in a subsequent minor release of Anchore Enterprise v6.
8 - SBOM Management in Anchore Enterprise
Anchore Enterprise makes software composition visible and manageable at scale — supporting the full Software Bill of Materials (SBOM) lifecycle across container images, filesystems, and externally supplied SBOMs from third-party vendors and open-source suppliers.
It brings together the tools and workflows needed to add, organize, analyze, and monitor SBOM data, including:
Adding SBOMs from build pipelines, registries, and external tools
Organizing SBOMs into versioned apps for portfolio-level visibility
Analyzing SBOMs for vulnerability and compliance risk
Observing app health across the software delivery lifecycle
Exporting SBOMs in industry-standard formats for downstream consumers
SBOMs as a Source of Truth
In Anchore Enterprise, the SBOM is the authoritative record of what a software artifact contains. All security analysis, policy enforcement, and compliance evaluation operate against SBOM data — making the SBOM the single reference point for understanding software composition across the supply chain.
The reliability of every security and compliance result depends on the accuracy and completeness of the underlying SBOM. Gaps in coverage or missing metadata translate directly into gaps in security visibility — making SBOM quality a foundational concern for any software assurance program.
Add SBOMs to Apps
Anchore Enterprise organizes SBOM data around a three-level hierarchy: an application (app) represents a piece of software you ship or host, an application version captures a point-in-time release of that application, and each application version contains one or more assets — the concrete things that were analyzed. See How It Works for the full model.
You add SBOMs by attaching an asset to an application version. AnchoreCTL exposes three asset-add paths:
Existing SBOMs — upload a CycloneDX, SPDX, or Syft-native JSON document produced outside Anchore Enterprise. See Managing SBOM Assets.
Container images — analyze an image either locally with AnchoreCTL or by handing the reference to Anchore Enterprise for server-side analysis. See Managing Container Image Assets.
Filesystems — analyze a local directory (i.e., source repo, build artifact dir, or a mounted VM) and upload the resulting SBOM as an asset. See Managing Filesystem Assets.
Anchore Enterprise validates uploaded SBOMs for schema correctness and required content before accepting them for vulnerability and policy analysis.
Coming soon: standalone SBOM generation — producing an SBOM locally without sending it to Anchore Enterprise. See Generate SBOMs.
Organize SBOMs Into Apps
Anchore Enterprise organizes SBOMs into apps that model how your teams build and deliver software. An app represents the top-level building block in a hierarchical view and can contain multiple versions, each holding the container images, filesystems, and externally supplied SBOMs that belong to that release.
You can:
Create apps and app versions to track security health across the release lifecycle
Attach assets to an app version as a release takes shape
Browse package, vulnerability, and policy data aggregated across every asset in a version
Pivot from a finding back to the assets that contain the affected package
Anchore Enterprise continuously analyzes asset SBOMs for vulnerability and compliance risk.
You can:
Queue assets for vulnerability scanning, with automatic re-scans as new vulnerability data becomes available
Filter and prioritize vulnerability findings by age, minimum severity, and minimum CVSS score using the Anchore Score — a composite index of CVSS score and severity, EPSS percentage, and CISA KEV status
Evaluate policy compliance across every asset in an app version, with results showing the final action, evaluation outcome, and a summary of findings by action, vulnerability severity, and allowlisted findings
Anchore Enterprise provides a portfolio-level view of what your apps contain through the View Contents capability, and of their security findings through Scan an App Version.
From an app version, you can:
List the assets that make up a version and inspect each one in turn
Browse aggregated packages and vulnerabilities for the version, then pivot to the assets that contain a given package
Review SBOMs, vulnerability findings, and policy evaluation results for individual assets
Export SBOMs and Security Reports
Anchore Enterprise produces combined downstream artifacts in standard formats.
You can:
Export a combined SBOM for an app version in CycloneDX 1.6 or SPDX 2.3 format containing all packages across all contained assets
SBOM management in Anchore Enterprise covers the full Software Bill of Materials (SBOM) lifecycle — from adding SBOMs to a release through organization, vulnerability scanning, and compliance evaluation. Each SBOM is attached to an app version as an asset, and Anchore Enterprise aggregates package, vulnerability, and policy data across every asset in a version so you can see, and act on, the security posture of a release as a whole.
Specific topics related to the SBOM management framework can be referenced per the links below:
Anchore Enterprise organizes SBOM data around a three-level hierarchy:
App — the top-level entity representing a piece of software you ship or host. An app carries a name, a description, a contact, and an optional default policy that applies to every version for that application.
App Version — a point-in-time release of an app. A version carries a name (typically a semver or release tag), an optional description, an optional reference to the previous version, an optional release date, and a status (in_progress, released, or eol).
Asset — a concrete thing that was analyzed and whose SBOM lives inside an app version. An app version can hold any number of assets — a container image, a filesystem analysis, an externally supplied Syft (native), CycloneDX, or SPDX document, or any mix of these.
The app version is the unit of aggregation: when Anchore Enterprise reports the packages, vulnerabilities, or policy status of “a release,” it is summarizing across the assets attached to a version.
Asset Types
Every asset has a type that describes what the SBOM represents. The supported types are:
container — a container image
filesystem — an analyzed directory tree
application, library, module, file, firmware, device, virtual_machine_disk — finer-grained classifications used primarily by externally supplied SBOMs that follow the CycloneDX component-type taxonomy
unknown — to be used when the type is not known
The three AnchoreCTL asset add commands allow the user to specify the asset type (what codebase element it represents) with the --type parameter. For app version asset add container-image, the --type parameter is defaulted to container and for app version asset add sbom it is defaulted to unknown.
The Asset Lifecycle
Adding an asset is an asynchronous operation. AnchoreCTL or the API submits a job that analyzes the artifact and generates the SBOM (or uploads the SBOM if external), processes the SBOM contents, and attaches the resulting asset to the named app version.
A job moves through the following states:
pending — accepted, waiting for a worker
processing — actively being analyzed
complete — finished successfully; the asset is queryable
failed — terminated with an error captured on the job record
cancelled — terminated by user request
You can wait for a job to finish (--wait on the CLI) or poll the job endpoint until status reaches a terminal state. Once an asset is complete, its SBOM, packages, vulnerabilities, and policy findings are queryable through the app-version endpoints.
Centralized and Distributed Analysis
Container images can be analyzed in two ways:
Centralized analysis (anchorectl app version asset add container-image-remote) — Anchore Enterprise pulls the image from your registry and analyzes it server-side. The SBOM is produced inside Anchore Enterprise.
Distributed analysis (anchorectl app version asset add container-image) — AnchoreCTL pulls or reads the image where you run the command, generates the SBOM locally, and uploads the result. Anchore Enterprise never sees the image bytes.
Both paths produce the same kind of asset. The trade-off is where the SBOM-generation work runs: centralized analysis runs it inside the Anchore Enterprise deployment, while distributed analysis runs it on the host where AnchoreCTL is invoked. Use distributed analysis to keep image-analysis load off the central deployment — useful when CI runners have spare capacity, when the central deployment is sized for evaluation and aggregation rather than analysis throughput, or when image bytes shouldn’t leave the build host (air-gapped or sensitive-image pipelines).
For the full mechanics — including diagrams, a worked CLI example, and the stateless one-time-scan variant — see Centralized and Distributed Analysis.
Unified Data Queries Across an App Version
Once an app version contains one or more assets, Anchore Enterprise exposes unified data queries that combine deduplicated data from every asset in the version:
List packages in a version — GET /apps/{app_id}/versions/{version_id}/packages
List vulnerabilities in a version — GET /apps/{app_id}/versions/{version_id}/vulnerabilities
Find assets that contain a given package — GET /apps/{app_id}/versions/{version_id}/assets-by-package?name=…&version=…
Find packages affected by a given vulnerability — GET /apps/{app_id}/versions/{version_id}/packages-by-vulnerability
These unified data queries are the practical reason to group assets under an app version: they let you answer “which images in this release contain openssl 3.0.13?” with one request.
API Conventions
Every entity carries a system_metadata envelope with a UUID id and RFC 3339 created_at/updated_at timestamps.
Pagination
Collection endpoints return paginated responses. The limit query parameter sets the page size (default and maximum 1000).
Account Scoping
App, version, and asset data is isolated per Anchore Enterprise account. A user with the appropriate role can act on another account’s data by setting the target account explicitly:
REST API — set the x-anchore-account request header to the target account name.
AnchoreCTL — set the account key in the AnchoreCTL config file, or export ANCHORECTL_ACCOUNT as an environment variable. AnchoreCTL does not have a per-command --account flag; the account is read from configuration before the command runs.
Supported SBOM Formats
SBOMs uploaded via app version asset add sbom are validated for schema correctness before the job moves out of pending. The supported formats are:
CycloneDX
JSON: versions 1.2–1.6
XML: versions 1.0–1.6
SPDX
JSON: versions 2.2–2.3
Tag-Value: versions 2.1–2.3
Initial SPDX 3.0 support for JSON — upload and download are supported, but content and vulnerability analysis are not yet functional
Syft native JSON
Performance Considerations
Asset analysis and SBOM scanning are queued and processed asynchronously. Though no explicit limits are enforced, the platform is tuned for releases of up to roughly 10,000 assets across all apps.
Vulnerability rescans run on a periodic schedule against the existing asset inventory as new vulnerability data lands in the Anchore Data Service. For more information on scheduling and tuning, see Imported SBOM Scanning.
8.2 - Organizing Software into Apps, Versions and Assets
An app is the top-level building block in Anchore Enterprise’s SBOM management model. It represents a piece of software you ship or host, and it groups the versions of that software together so you can track security health across the full release lifecycle.
Each app contains one or more app versions, and each version contains one or more assets — the concrete container images, filesystems, and externally supplied SBOMs that make up that release. See How It Works for the full mental model.
Watch: a walkthrough of Applications, versions, and assets.
When to Model an App
Create an app for each project or product whose security health you want to track over time. Common patterns are:
One app per service in a microservices architecture
One app per shippable artifact in a monorepo
One app per major product line, with versions tracking individual releases
One app per development repo, with versions tracking nightly or milestone builds
Anatomy of an App
An app carries a small, fixed set of fields:
Field
Required
Purpose
name
Yes
Human-readable identifier, unique within an account
description
No
Free-form summary of the app
contact
Yes
Owning person or team — name is required, email and phone are optional
policy_id
No
Default policy applied to every version unless overridden — set to null to use the account default
version_count
Read-only
Number of versions currently attached
system_metadata
Read-only
UUID and created_at / updated_at timestamps
For the full create and update payload reference, worked examples, and a side-by-side of the AnchoreCTL and API workflows, see Creating and Managing Apps.
Apps are managed through the Anchore Enterprise GUI, AnchoreCTL, or the Anchore API. The three surfaces share the same data model — see Anatomy of an App for the field reference.
The lifecycle is straightforward: create an app, list and inspect the apps in your account, update the version status as apps are released or releases reach end of life (EOL), and update an app’s metadata as ownership or policy assignment changes.
Manage Apps in the Anchore Enterprise GUI
The Apps view is the home for app management in the UI. From there you can browse every app in your current account, drill into a specific app to see its versions, and trigger the create / edit / delete flows from a single screen.
Create an App in the GUI
Click Create App in the Apps view to open the creation modal. Provide a name, an optional description, a contact (name required, email and phone optional), and an optional policy assignment.
If you leave the policy assignment blank, the app inherits the account’s default policy.
Edit an App in the GUI
From the Apps view or from an app’s detail page, open the Edit action to update the app’s name, description, contact, or policy assignment. The same field rules apply as on create.
Delete an App in the GUI
Open the Delete action from the Apps view or detail page. If the app still has versions attached, the GUI prompts you to confirm a forced delete that cascades to every version and asset under the app.
Deleting an app with force removes every version of the app and every asset attached to those versions. This operation is irreversible.
Manage Apps with AnchoreCTL
AnchoreCTL exposes the full CRUD surface for apps under anchorectl app. Every command accepts either an app name or its UUID, and the output format is controlled with -o text|json|json-raw|id.
Create an App
Create a new app with the add subcommand. The app name is the positional argument, and the contact name is the only required flag:
Optional flags include --contact-email, --contact-phone, --description, and --policy-id.
List Apps
List every app in the current account with no arguments:
anchorectl app list
To narrow the result to a single app by exact name, add --name:
anchorectl app list --name my-service
Get an App
Retrieve a single app’s record by either its name or UUID:
anchorectl app get my-service
Use -o json for the structured record, which includes system_metadata and the resolved policy_id.
Update an App
Update one or more fields on an existing app. Only the flags you provide are sent — omitted flags leave the corresponding fields unchanged:
anchorectl app update my-service \
--description "Customer-facing API service (regulated)"\
--policy-id strict-policy
To clear the policy assignment and fall back to the account default, pass an empty string: --policy-id "".
Delete an App
Delete an app by name or UUID. The default behavior refuses to delete an app that still has versions attached:
anchorectl app delete my-service
To cascade the delete through every version and every asset under the app, add --force:
anchorectl app delete my-service --force
Manage Apps with the API
App management is exposed under the /apps collection — create, list, get, update, and delete operations are all available, with cascading delete via ?force=true. The full endpoint inventory, request and response schemas, and error codes are in the API browser; search for the Apps tag.
A few conventions worth knowing as you call these endpoints:
List endpoints return paginated responses — see Pagination.
Cross-account requests are scoped via the x-anchore-account header or, from AnchoreCTL, the ANCHORECTL_ACCOUNT environment variable. See Account Scoping for the full mechanism.
DELETE /apps/{app_id}?force=true is destructive and irreversible — it removes every version of the app and every asset attached to those versions.
8.2.2 - Creating and Managing App Versions
An app version is a point-in-time release of an app — the unit that aggregates packages, vulnerabilities, and policy results across the assets that make up a release. Versions are managed through the Anchore Enterprise GUI, AnchoreCTL, or the Anchore API.
In addition to a name and description, an app version carries two fields that model the release lifecycle:
status — one of in_progress, released, or eol. New versions default to in_progress. Move a version to released when it ships, and to eol once support ends.
release_date — the date the version was released or hosted. Free-form for in_progress versions; typically set when the status moves to released.
Manage App Versions in the Anchore Enterprise GUI
Versions are listed on an app’s detail page in the Apps view. From there you can create a new version, open an existing version’s detail page, or edit and delete versions.
Create a Version in the GUI
From the app detail page, click Create Version to open the creation modal. Provide a name, an optional description, an optional status, an optional previous version to chain from, and an optional release date.
Edit a Version in the GUI
From the app detail page or the version’s own detail page, open the Edit action to update any field.
Delete a Version in the GUI
Open the Delete action from the version row or detail page. If the version still has assets attached, the GUI prompts you to confirm a forced delete that cascades to every asset.
Deleting a version with force removes every asset attached to that version. This operation is irreversible.
Version Detail Page
Open a version from the app detail page to land on its detail view. This is the centerpiece of SBOM management in the GUI — it aggregates every asset attached to the version and presents a tabbed view of the version’s overall compliance issues, packages, and vulnerabilities.
The header carries the version’s name, status, release date, and primary actions — Add Asset, Download Unified Documents, and an additional actions menu. The body is organised into tabs that presents the same underlying data through different perspectives. Each tab shows a data grid with a unique listing of relevant data. Above the grid are filters which can be used to reduce the data rows based on your desired criteria. Filters can be stacked to create multiple expressions. Next to the Filters is an Export button to download the unfiltered grid data into a data file. Each export creates an asynchronous job, and the resulting generated data file can be downloaded via the Recent Activity panel in the Summary tab.
Summary Tab
The summary tab gives an at-a-glance view of the version’s compositions and compliance state: list of assets with their metadata, total packages with a breakdown by ecosystem, vulnerability counts with several breakdowns, and a recent activity panel on the right side which shows application version jobs and downloads. It is the ideal landing page for an executive or release-manager glance at the version.
Recent Activity Panel
Every asset-add, export, and policy-evaluation operation runs as an asynchronous job. The version detail page surfaces these through a Recent Activity panel that polls live for status updates and shows each in-flight, completed, or failed job.
Click a row to open the job detail popup, which shows the job type, status, headline message, and — for failed jobs — the error code and reason captured during validation. The same job records are available through anchorectl app job list / get and through the API at /apps/{app_id}/jobs. For the validation error codes you may see on failed SBOM uploads, see Content Validation.
Contents Tab
The contents tab lists every unique package found across every asset in the version. Each row presents the package ecosystem, name and version, PURL, a vulnerability summary by severity and count, a list of licenses, and an affected asset count. From a package you can view which assets contain it. This is the GUI equivalent of the assets-by-package API endpoint described in Viewing an App Version’s SBOM.
Vulnerabilities Tab
The vulnerabilities tab lists every unique vulnerability surfaced across the version’s assets. Each row presents a unique vulnerability record consisting of the computed Anchore Score (a composite risk index consisting of the CVSS score and severity, the EPSS, and the CISA KEV status, used to prioritize remediation work), vulnerability ID, maximum CVSS severity and score (from a given security repository), the EPSS data, the CISA KEV status, the last time the vulnerability was reported, whether any of the associated packages have fixes available, and whether any of the associated packages have VEX annotations applied to them. Selecting a vulnerability opens a panel that shows which packages are affected and in which assets the impacted package lives. The packages panel can also be used to apply a VEX annotation to provide the security assessment for a given vulnerability-package combination for the current application version.
Clicking on any of the Vulnerability widgets will show the vulnerability repository from which the data is being provided, along with CVSS v2.0, v3.1, and v4.0 scores. There is also a link to the
Anchore Vulnerability Database website where you can conduct additional research about any vulnerabilities of interest looking across data aggregated across several providers.
Compliance Tab
The compliance tab shows the result of the most recent policy evaluation for the version. Findings are grouped by gate and trigger, and a STOP / WARN / GO badge on each finding mirrors what AnchoreCTL would surface from anchorectl app version policy findings list.
Manage App Versions with AnchoreCTL
App versions live under anchorectl app version. Every command requires the parent app via the --app flag and accepts either an app or version name, or its UUID.
Create a Version
Create a new version of an existing app. The version name is the positional argument, and the parent app is identified with --app:
Optional flags include --description, --status, and --release-date. New versions default to in_progress status.
List Versions for an App
List every version of an app, with the app name or UUID as the positional argument:
anchorectl app version list my-service
To narrow the result to a single version by exact name, add --name:
anchorectl app version list my-service --name 1.4.0
Get a Version
Retrieve a single version’s record. The version argument accepts either its name or UUID:
anchorectl app version get 1.4.0 --app my-service
Use -o json for the structured record, which includes system_metadata.
Update a Version
Update one or more fields on an existing version. Only the flags you provide are sent — omitted flags leave the corresponding fields unchanged. This is also how you transition the version’s status through its lifecycle:
anchorectl app version update 1.4.0 \
--app my-service \
--status released \
--release-date 2026-05-15
Delete a Version
Delete a version by name or UUID. The default behavior refuses to delete a version that still has assets attached:
anchorectl app version delete 1.4.0 --app my-service
To cascade the delete through every asset under the version, add --force:
anchorectl app version delete 1.4.0 --app my-service --force
Manage App Versions with the API
App version management is exposed under /apps/{app_id}/versions — create, list, get, update, and delete operations are all available, with cascading delete via ?force=true. The full endpoint inventory, request and response schemas, and error codes are in the API browser; search for the App Versions tag.
A few conventions worth knowing as you call these endpoints:
Pagination on list endpoints is cursor-based — see How It Works.
Status transitions are sent through the same PATCH endpoint as the name and description fields.
The release_date field is an RFC 3339 date-time. AnchoreCTL accepts the shorter YYYY-MM-DD form and converts it.
DELETE /apps/{app_id}/versions/{version_id}?force=true is destructive and irreversible — it removes every asset attached to the version.
8.2.3 - Managing Assets in an App Version
An asset is an application codebase element that was analyzed and whose SBOM lives inside an app version. It can be an externally supplied SBOM document, a container image, or an analyzed filesystem — all three sit side by side under the same version. The version aggregates packages, vulnerabilities, and policy results across every asset it contains.
Each asset carries a small set of fields:
Field
Required
Purpose
name
Yes
Human-readable identifier, unique within the parent app version
type
Yes
One of the values in the AssetType enum (e.g. container, filesystem, library)
annotations
No
Free-form key=value pairs for build metadata, ownership, environment tags, and so on
system_metadata
Read-only
UUID and created_at / updated_at timestamps
The SBOM content for an asset is fetched separately from the asset record itself.
Add an Asset
Assets are added asynchronously through a job. AnchoreCTL exposes four asset-add commands that map to four job types in the API; the choice depends on what you’re attaching:
SBOM — upload an existing CycloneDX, SPDX, or Syft-native SBOM produced outside Anchore Enterprise. See Managing SBOM Assets.
Filesystem — analyze a directory tree locally (i.e., source repo, build artifact dir, or a mounted VM) and upload the resulting SBOM. See Managing Filesystem Assets.
For the job lifecycle — pending → processing → complete / failed / cancelled — and the full distinction between centralized and distributed image analysis, see How It Works.
Manage Assets in the Anchore Enterprise GUI
A version’s detail page lists every asset attached to that version, with each asset’s type, status, and a quick path to its SBOM, packages, and vulnerabilities.
Asset Detail Popup
Selecting an asset on the version’s assets list opens a drill-in popup that shows the asset’s metadata. If the asset is an Image, click Go to image analysis to open the advanced images GUI. There you can review additional image details, assess advanced policies like FedRAMP or NIST 800-53, and view STIG results.
Edit an Asset in the GUI
Open an asset’s row action menu to edit its attributes — for example, choose Edit Annotations to manage the key=value annotations on the asset. Annotations are merged with what’s already there; clear a single key by setting its value to empty.
Delete an Asset in the GUI
From the version detail page, open the Delete action on the asset row. Deleting an asset removes it and its SBOM from the version; it does not affect any other asset or version.
Manage Assets with AnchoreCTL
Asset CRUD lives under anchorectl app version asset. Every command requires the parent app and version via --app and --version.
List Assets in a Version
List every asset attached to a specific version. The version name or UUID is the positional argument, and the parent app is identified with --app:
anchorectl app version asset list 1.4.0 --app my-service
To narrow the result to a single asset by exact name, add --name:
anchorectl app version asset list 1.4.0 --app my-service --name api-image
Get an Asset
Retrieve a single asset’s record. The asset argument accepts either its name or UUID:
anchorectl app version asset get api-image --app my-service --version 1.4.0
Use -o json for the structured record, which includes system_metadata and the asset’s annotations.
Get the SBOM for an Asset
The asset’s stored SBOM is fetched through a separate subcommand. Use --file to write the SBOM to disk, or omit it to write to stdout:
anchorectl app version asset sbom get api-image \
--app my-service \
--version 1.4.0 \
--file api-image.sbom.json
Edit an Asset
Edit an asset’s attributes — annotations, name, or type — with the update subcommand:
--annotations accepts a comma-separated list of key=value pairs. The list is merged with existing annotations; remove a single key by setting its value to empty (key=). Rename the asset with --name, or correct its type with --type.
Delete an Asset
Delete an asset by name or UUID. The version it belongs to is identified with --version, and its parent app with --app:
Deletion is unconditional — there is no --force flag because nothing depends on an asset’s existence other than the version it belongs to.
Manage Assets with the API
Asset management is exposed under /apps/{app_id}/versions/{version_id}/assets — list and get on the collection, get / update / delete on individual assets, and a separate sub-resource for the asset’s SBOM content at /apps/{app_id}/versions/{version_id}/assets/{asset_id}/sbom. Asset creation is performed through the App Jobs endpoints — one job type per add path. The full endpoint inventory, request and response schemas, and error codes are in the API browser; search for the App Version Assets and App Jobs tags.
A few conventions worth knowing as you call these endpoints:
The list endpoint returns paginated responses — see Pagination — and accepts ?name=<exact-name> and ?type=<AssetType> filters.
Cross-account requests are scoped via the x-anchore-account header or ANCHORECTL_ACCOUNT environment variable. See Account Scoping for the full mechanism.
The query endpoints under the same version path — packages and assets-by-package — answer cross-asset questions about a release. They are covered in Viewing an App Version’s SBOM; the vulnerability-side queries (vulnerabilities, packages-by-vulnerability) are covered in Scan an App Version.
8.2.3.1 - Managing SBOM Assets
An SBOM asset is created by uploading an SBOM that was produced outside Anchore Enterprise — by a vendor, a different SCA tool, or a custom build pipeline — and attaching it to an app version. Use this path when you already have an SBOM in hand and want to bring it into Anchore Enterprise’s vulnerability and policy analysis without re-scanning the underlying artifact.
The same upload path also serves as the GUI equivalent for filesystem-derived SBOMs — generate the SBOM with a tool of your choice, then upload it here.
Supported Formats
The supported SBOM formats are:
Format
JSON versions
XML versions
Tag-Value versions
CycloneDX
1.2 – 1.6
1.0 – 1.6
—
SPDX 2.x
2.2 – 2.3
—
2.1 – 2.3
SPDX 3.0
3.0
—
—
Syft
native
—
—
SPDX 3.0 documents can be uploaded and downloaded today, but content and vulnerability analysis against them are not yet functional.
Content Validation
Anchore Enterprise runs every uploaded SBOM through a multi-stage validation pipeline before extracting its packages into the app version’s catalog. The pipeline runs as the first step of the upload job; if any stage fails, the job moves to failed with the specific error captured on the job record.
The stages are:
Format detection — the document is classified as CycloneDX, SPDX (2.x or 3.0), or Syft based on identifying markers in the document head. Documents that match none of the supported formats are rejected before any parser runs.
Structural parsing — the format-specific parser deserialises the document. Anchore Enterprise uses the cyclonedx-python-lib library for CycloneDX, spdx-tools for SPDX, and a native parser for Syft. Invalid JSON, malformed XML, missing required fields, or wrong root elements are rejected at this stage.
Version support — for CycloneDX uploads, the declared specVersion must fall within the supported range listed above. Documents declaring an unsupported version are rejected even if they otherwise parse cleanly.
Content ingestion — only after the previous stages pass does Anchore Enterprise extract packages and dependencies from the document and insert them into the app version.
When the job fails, the error record carries one of the following codes alongside a human-readable reason:
Code
Meaning
AS510
Generic SBOM parse failure (no format-specific code applies)
AS511
SPDX parse failure
AS512
CycloneDX JSON parse failure
AS513
CycloneDX specVersion outside the supported range
AS514
CycloneDX XML is malformed
AS515
Document does not match any recognised SBOM format
AS516
Syft document failed structural parsing
You can inspect the failure detail for a job through any of the three surfaces. From the GUI, open the Recent Activity panel on the version detail page and click the failed job to see the error code and reason. From the API, GET /apps/{app_id}/jobs/{job_id} returns the same record. From AnchoreCTL, retrieve the job by its ID:
anchorectl app job get <job-id> --app my-service
Upload an SBOM Asset in the Anchore Enterprise GUI
From an app version’s detail page, open the Add Asset action and choose SBOM. The GUI walks through a short three-step wizard: pick the SBOM file from disk, supply the asset’s name and type, and optionally add annotations. The asset’s type tells Anchore Enterprise what the SBOM describes — a container, a filesystem, a library, an application, and so on — and is selected from the same AssetType enum used everywhere else.
Select the SBOM option:
Select the desired SBOM document:
Enter the SBOM Asset Name:
Optionally, enter up to 10 SBOM asset annotations:
You can view the recently added assets in the My Recent Activity panel on the App Version Summary tab:
Upload an SBOM Asset with AnchoreCTL
Use app version asset add sbom to upload a CycloneDX, SPDX, or Syft-native document to an app version. The SBOM file path is the positional argument; the parent app, parent version, and asset name are required:
Unlike the container-image and filesystem add commands, add sbom cannot infer the asset’s type from the input — the SBOM document describes its components, but Anchore Enterprise does not assume what the whole asset represents. The flag defaults to unknown. Set it explicitly to one of the AssetType values so downstream queries and filters work as expected:
By default the command submits the job and returns immediately. To block until the job reaches a terminal state — useful in CI pipelines where you want validation to gate later steps — add --wait:
POST /apps/{app_id}/jobs/add-sbom-asset — multipart form-data carrying the asset name, the parent version ID, the SBOM document, an asset_type value, and optional annotations.
The full request and response schemas are in the API browser; search for the App Jobs tag. The same endpoint is used by AnchoreCTL’s filesystem and distributed container-image flows after local SBOM generation, so a direct API caller can replicate any of those flows by generating an SBOM client-side and submitting it here with the appropriate asset_type.
A few conventions worth knowing as you call this endpoint:
Schema validation runs before the job leaves pending; a malformed document moves the job to failed with the validation error in the job record.
Job state transitions and polling are documented in How It Works.
Cross-account requests are scoped via the x-anchore-account header or, from AnchoreCTL, the ANCHORECTL_ACCOUNT environment variable. See Account Scoping for the full mechanism.
SBOMs produced by AnchoreCTL’s distributed container-image or filesystem analysis are uploaded automatically by those commands. Use this page when you have an SBOM produced outside of AnchoreCTL — by a vendor, by Syft directly, by another SCA tool, or by a custom pipeline.
8.2.3.2 - Managing Container Image Assets
A container image asset is created by analyzing an OCI or Docker image and attaching the resulting SBOM to an app version. Anchore Enterprise supports two analysis paths — pick the one that matches where the image bytes can be read from.
This page covers attaching a container image to an app version. The standalone advanced image analysis workflow — scanning an image without binding it to an app — is also fully supported in v6 through the Images view in the Anchore Enterprise GUI and the anchorectl image add command. See Image Analysis for that path. Use this page when you want a container image to participate in app-version aggregation, pivot queries, and exports.
Distributed vs Centralized Analysis
Path
Who pulls the image
Who generates the SBOM
When to use
Distributed
AnchoreCTL, on the host where you run the command
AnchoreCTL, locally; only the SBOM is uploaded
Offloading SBOM-generation load from the central deployment, air-gapped or sensitive-image pipelines, registries Anchore Enterprise cannot reach
Centralized
Anchore Enterprise, from the registry
Anchore Enterprise, server-side
Registries Anchore Enterprise can reach, when you want consistent server-side analysis without local resource use
For the underlying lifecycle these two paths share, see How It Works.
Add a Container Image Asset in the Anchore Enterprise GUI
From an app version’s detail page, open the Add Asset action and choose Container Image. Provide the image reference, an asset name, and (optionally) a Dockerfile to attach and annotations. The GUI submits the analysis job and shows its progress on the version’s recent activity panel.
Select the Image option:
Enter the Image Reference and optional Dockerfile:
Enter the Image Asset Name:
Optionally, enter up to 10 image asset annotations:
You can view the recently added assets in the My Recent Activity panel on the App Version Summary tab:
Add a Container Image Asset with AnchoreCTL
AnchoreCTL exposes the two analysis paths as separate subcommands. Both require the parent app, the parent version, and a name for the new asset.
Distributed Analysis
Use app version asset add container-image to have AnchoreCTL analyze the image locally and upload the SBOM. The default source is a registry pull:
Switch the source with --from. The supported values are:
Source
--from value
Notes
Registry (default)
omit, or registry
AnchoreCTL pulls the image from the registry
Local Docker daemon
docker
Reads an image already loaded into Docker
Local Podman daemon
podman
Reads an image already loaded into Podman
OCI/Docker archive
docker-archive:/path/to.tar
Loads the image from a local tar file
To analyze an image already loaded into your local Docker daemon — for example a freshly built image that hasn’t been pushed yet — point AnchoreCTL at the docker source:
The image reference must be resolvable from Anchore Enterprise — including registry credentials configured in your account. The centralized command does not accept --from or --platform, since Anchore Enterprise selects how to fetch the image.
Shared Flags
Both subcommands accept the same supporting flags:
--annotations "key=value,key=value" — attach build metadata at create time (see Managing Assets in an App Version for the merge and clear semantics)
--dockerfile /path/to/Dockerfile — attach the Dockerfile so policy checks can evaluate Dockerfile triggers
--wait — block until the job reaches a terminal state instead of returning immediately
--type — override the asset type (defaults to container); see the AssetType enum
These flags stack with both the distributed and centralized invocations. A complete CI/CD-friendly invocation that attaches a Dockerfile, captures build metadata, and blocks until the job completes:
Distributed and centralized analysis are two distinct job types in the API:
POST /apps/{app_id}/jobs/add-container-image-asset — used by the centralized path; Anchore Enterprise pulls and analyzes the image server-side.
POST /apps/{app_id}/jobs/add-imported-image-asset — used by the distributed path; AnchoreCTL analyzes the image locally and uploads the resulting SBOM together with the image manifest, image config, and any optional analysis artifacts (secret searches, content searches, file contents) as a multipart payload.
For both, the full multipart request schema and response schemas are in the API browser; search for the App Jobs tag.
A few conventions worth knowing as you call these endpoints:
Job state transitions and the --wait semantics are documented in How It Works.
The job response carries a job_id; poll GET /apps/{app_id}/jobs/{job_id} to track status.
Cross-account requests are scoped via the x-anchore-account header or, from AnchoreCTL, the ANCHORECTL_ACCOUNT environment variable. See Account Scoping for the full mechanism.
Server-side analysis depends on Anchore Enterprise being able to reach your registry and authenticate. Configure registry credentials in your account before submitting centralized jobs against private registries.
8.2.3.3 - Managing Filesystem Assets
A filesystem asset is created by analyzing a local directory tree and attaching the resulting SBOM to an app version. Use this path when the software you want to track is a build output, an unpacked archive, a virtual machine root, or any directory of files that does not live inside a container image.
Filesystem analysis happens on the host where you run AnchoreCTL: AnchoreCTL generates the SBOM locally and uploads the resulting document to Anchore Enterprise. To attach a filesystem-derived SBOM through the Anchore Enterprise GUI, generate the SBOM first and upload it via Managing SBOM Assets with the asset type set to filesystem.
Filesystem Assets in the Anchore Enterprise GUI
The GUI surfaces a filesystem asset once an app version asset add filesystem job completes — it appears in the version’s asset list alongside any other assets, with its type displayed as filesystem. For an ad-hoc upload of a pre-generated filesystem SBOM, use the GUI’s Add Asset → SBOM action with the asset type set to filesystem.
Add a Filesystem Asset with AnchoreCTL
Use app version asset add filesystem to analyze a directory and upload the resulting SBOM. AnchoreCTL runs Syft locally to generate the SBOM, then submits it to Anchore Enterprise as a job.
The directory path is the positional argument. The parent app, version, and asset name are required:
The asset type defaults to filesystem, so you typically do not need to set --type explicitly.
Set SBOM Document Author and Supplier
The generated SBOM document carries an author and a supplier field that downstream consumers (and SBOM quality checks) use to identify provenance. Both default to unknown. Set them with --author and --supplier:
--author follows the common Name <email> form. Both fields are free-text; pick values that match what your organization publishes for software provenance.
Annotate the Asset
Attach build metadata at create time with --annotations. The full merge and clear semantics are documented under Managing Assets in an App Version:
By default the command submits the job and returns immediately, leaving you to track progress through the asset list or job endpoint. To block until the job reaches a terminal state — useful in CI pipelines where you want the job’s outcome to gate later steps — add --wait:
Filesystem analysis happens on the AnchoreCTL host; only the resulting SBOM is sent to Anchore Enterprise. Under the hood, AnchoreCTL uploads the SBOM through the same job type used for any externally produced SBOM:
POST /apps/{app_id}/jobs/add-sbom-asset — the multipart request carries the asset name, the parent version ID, the SBOM payload, and an asset_type of filesystem.
The full request and response schemas are in the API browser; search for the App Jobs tag. If you are integrating directly with the API rather than using AnchoreCTL, you are responsible for running an SBOM generator (Syft or equivalent) against the filesystem and submitting the resulting document.
A few conventions worth knowing as you call this endpoint:
Job state transitions are documented in How It Works.
The job response carries a job_id; poll GET /apps/{app_id}/jobs/{job_id} to track status.
Cross-account requests are scoped via the x-anchore-account header or, from AnchoreCTL, the ANCHORECTL_ACCOUNT environment variable. See Account Scoping for the full mechanism.
8.3 - Generating SBOMs for an App Version
SBOMs are currently generated as part of attaching an asset to an app version. Where generation happens depends on the asset. AnchoreCTL generates the SBOM locally when it can read the source itself, such as a filesystem directory or a container image analyzed on your host, while centralized image analysis generates it server-side. For anything else, generate the SBOM with your own tooling and upload it as an SBOM asset. Either way, the SBOM is stored against the version where it becomes available for vulnerability analysis, policy evaluation, search, and export.
Coming soon: standalone SBOM generation. A future release of Anchore Enterprise will let AnchoreCTL produce an SBOM locally and write it to a file or stream without storing the result in Anchore Enterprise.
8.4 - Viewing an App Version's SBOM
Once an app version contains one or more assets, Anchore Enterprise aggregates the SBOM contents of every asset into a single package view for the version. Viewing that aggregate is how you look inside the stored SBOM: which packages a release contains and which assets carry them. Questions like “which images in this release contain openssl 3.0.13?” can be answered with a single API call.
A package that appears in more than one asset is listed once. A pivot query then shows you which assets contain it.
List every package across every asset in the version, deduplicated by name, version, type, and namespace. The command requires the parent app via --app and accepts either the version name or its UUID:
anchorectl app version package list 1.4.0 --app my-service
Use -o json for the structured record.
AnchoreCTL exposes the aggregate package list only. To find which assets contain a given package, use the assets-by-package API endpoint described below, or the affected-assets view on the version’s contents tab in the Anchore Enterprise GUI.
View SBOM Contents with the API
The API exposes the aggregate package list plus the pivot queries that link packages back to the assets that contain them.
Aggregate List Endpoint
Method
Path
Purpose
GET
/apps/{app_id}/versions/{version_id}/packages
Every package across every asset in the version
Pivot Endpoint
The pivot endpoint answers the cross-asset question that motivates grouping in the first place — locating which assets carry a package.
List assets that contain a specific package (filter by name and version, optionally narrowing by type or namespace)
The full request and response schemas for both the aggregate and pivot endpoints are in the API browser; search for the App Version Packages tag.
A few conventions worth knowing as you call these endpoints:
All list and pivot endpoints return paginated responses — see Pagination.
Cross-account requests are scoped via the x-anchore-account header or, from AnchoreCTL, the ANCHORECTL_ACCOUNT environment variable. See Account Scoping for the full mechanism.
The pivot endpoint is typically the most expensive query in this set. When you only need a count or a simple existence check, prefer the aggregate list with a filter; reach for the pivot when you specifically need the list of affected assets.
8.5 - Exporting SBOMs
Download a Single Asset SBOM in the Anchore Enterprise GUI
Anchore Enterprise allows users to generate a single Asset SBOM representing a generated SBOM for a container image or a filesystem analysis, or an imported external SBOM. Navigate to the App Version Summary tab, and click on the action menu for the desired asset. Then select the Download SBOM option.
This operation is synchronous and does not use jobs. The downloaded SBOM document will show up in your downloads folder per your browser configuration.
Export a Single Asset SBOM with AnchoreCTL
Retrieve the stored SBOM for a single asset. The asset argument accepts either its name or UUID. Use --file to write the SBOM to disk, or omit it to write to stdout:
anchorectl app version asset sbom get api-image \
--app my-service \
--version 1.4.0 \
--file api-image.sbom.json
Generate a Unified App Version SBOM in the Anchore Enterprise GUI
Anchore Enterprise supports the generation of a single unified SBOM document in an industry standard format for the entire app version. The system aggregates and deduplicates all of the packages and dependencies across every asset attached to the version and saves the result in an SBOM document in the user-selected format (SPDX v2.3 or CycloneDX v1.6).
The app version’s detail page has a Download button in the top-right of the screen which allows the user to select the desired document and format.
Once the desired options are selected, the GUI submits the download job and shows its progress on the version’s recent activity panel. Once the job completes, click the row in the recent activity panel to download the generated document.
Generate a Unified App Version SBOM with AnchoreCTL
AnchoreCTL hides the job lifecycle behind a single command: it submits the export, waits for the job to reach a terminal state, and streams the exported SBOM to stdout or a file.
Export the combined CycloneDX 1.x SBOM for an app version. The version name or UUID is the positional argument, and the parent app is identified with --app:
anchorectl app version export sbom-cyclonedx-1 1.4.0 --app my-service
By default the exported SBOM is written to stdout. To capture it to a file, pass --file:
Unified App Version SBOM exports run as asynchronous jobs. AnchoreCTL hides this behind a single command, but the API exposes each step so you can integrate exports into a pipeline that needs finer control.
Submit the Export Job
Submit an export by POSTing to the format-specific job endpoint with the app version ID in the request body. The accepted endpoints are:
Format
Endpoint
CycloneDX 1.x
POST /apps/{app_id}/jobs/export-sbom-cyclonedx-1
SPDX 2.x
POST /apps/{app_id}/jobs/export-sbom-spdx-2
The request body accepts optional format and spec_version fields:
Endpoint
format (default)
spec_version (default)
export-sbom-cyclonedx-1
json
1.6
export-sbom-spdx-2
json
2.3
For v6.0 each parameter accepts only the listed value; unsupported pairings are rejected with HTTP 422. The endpoint names leave room for additional CycloneDX 1.x or SPDX 2.x point versions in later releases.
The response carries a job_id.
Poll the Job
GET /apps/{app_id}/jobs/export-sbom-cyclonedx-1/{job_id} (or the SPDX equivalent) returns the current job record. Wait for status to reach a terminal state (complete, failed, or cancelled). When the job is complete, the response carries a completion_detail block whose download_id is the handle for the next step. The job lifecycle is documented in How It Works.
Download the Exported SBOM
Once the job is complete, retrieve the exported SBOM by GETing the download endpoint:
GET /apps/{app_id}/downloads/{download_id}
The endpoint returns:
200 with application/octet-stream — the file is ready and is streamed in the response body
202 while the export job is still processing — useful if you choose to poll the download endpoint directly instead of polling the job
404 if the download_id does not exist or is no longer available
The full endpoint inventory, request and response schemas, and error codes are in the API browser; search for the App Jobs and App Downloads tags.
A few conventions worth knowing as you call these endpoints:
Cross-account requests are scoped via the x-anchore-account header or, from AnchoreCTL, the ANCHORECTL_ACCOUNT environment variable. See Account Scoping for the full mechanism.
The download endpoint is reusable for any export job type, not just SBOM exports — the same handle pattern serves vulnerability, VEX, VDR, package, and policy-compliance exports.
8.6 - Searching SBOM Data
Coming soon: Search capability in GUI for packages and vulnerabilities.
What to Use Today
Until the search API is released, use the list endpoints with their built-in filter parameters:
Filter assets within a version — GET /apps/{app_id}/versions/{version_id}/assets?name=<filter>. See Managing Assets in an App Version.
Pivot across a version’s contents — use the assets-by-package endpoint to answer cross-asset package questions about a single release. See Viewing an App Version’s SBOM. For the packages-by-vulnerability pivot, see Scan an App Version.
8.7 - Overriding Package Licenses
The package override feature for license data lets you override license information for specific packages in your Anchore Enterprise deployment. Overrides apply globally within the account — every asset that contains the targeted package surfaces the corrected license data, regardless of which app version or image it appears in.
License Summary Document
Anchore Enterprise provides a per-image license summary document that lists each package alongside its detected license data. Each package entry includes the license identifiers detected at the time of analysis. When the identifier is a valid SPDX expression, additional fields are included — license name, text, header, URL, and copyright.
Retrieve the document with GET /v2/images/{image_digest}/content/licenses.
Any license override data is reflected in the license summary document.
Override License Data
Overrides target a specific package identified by its PURL. Any license field included in the override request is used in place of the upstream-reported license data. Create or update overrides by sending a POST or PUT to /exp/system/package-overrides/licenses.
An override may target one or more of the licenses that the package originally surfaced, or it may target specific license data such as the license text, header, URL, or copyright.
Any override applies globally to any image or asset that contains the specified package.
License Override RBAC Role
A dedicated RBAC role supports the license override feature. The license-override role can be conferred on any user — those users can then create, update, and delete license overrides. The role has a domain value of system and a resource value of license-overrides. The license-override role is not required to view the license summary document.
Users with the system-admin role also have permission to create, update, and delete license overrides.
Anchore Enterprise Experimental API
The license override feature is part of the Anchore Enterprise Experimental API.
Interfaces in this specification are unstable and may change in breaking ways between releases.
9 - Security Analysis and Reporting
Anchore Enterprise provides SBOM-powered vulnerability scanning and management capabilities that leverage curated vulnerability intelligence, with a focus on reducing false positives and producing high-confidence results at scale.
It automates continuous vulnerability management across the software supply chain, including:
Identifying vulnerabilities and risks that apply to components in an SBOM
Reducing false positives and noise to improve accuracy
Prioritizing findings to focus attention on meaningful risk
Searching, reporting, and producing evidence for vulnerability findings across the software portfolio
SBOMs Are the Foundation
Anchore Enterprise uses SBOMs as the starting point for vulnerability analysis across software artifacts in build pipelines, registries, and runtime environments.
Anchore Enterprise scans software artifacts to generate high-fidelity SBOMs, imports third-party SBOMs in SPDX or CycloneDX formats, and analyzes them to identify vulnerabilities and other compliance issues.
Because vulnerability analysis is SBOM-based, Anchore Enterprise can continue to assess deployed software as new vulnerability information becomes available, including newly disclosed or zero-day vulnerabilities, without needing to rescan software artifacts.
Two Evaluation Scopes
Anchore Enterprise evaluates vulnerabilities in two distinct scopes — pick the one that matches how your team organizes software. Both scopes draw from the same vulnerability data, though some matching behaviors are tuned differently for each (see What’s Shared and What Differs Between Scopes).
App-version-scoped — vulnerability findings aggregated across every asset attached to an app version. The v6-native surface, where the Anchore Score is used to prioritize vulnerabilities based on a composite index composed of CVSS severity and score, EPSS, and CISA KEV.
Image-scoped — vulnerability findings for a single analyzed container image. The long-standing v5 surface, fully supported in v6.
See Scans for the comparison and worked walkthroughs of each scope.
Identifying Vulnerabilities and Risks
Anchore Enterprise identifies vulnerabilities and risks by matching components in an SBOM to known vulnerability and risk data provided by the Anchore Data Service.
The Anchore Data Service is continuously updated with:
Aggregated vulnerability data from dozens of sources and ecosystems
Risk context including EPSS scores and CISA KEV data
Malware data sourced from ClamAV
Proprietary Anchore-enriched data to improve accuracy and reduce noise
In addition to vulnerabilities, Anchore Enterprise can surface additional risk signals derived from its extensive artifact metadata, including malware indicators, embedded secrets, file permissions, and other insecure practices.
Detailed artifact metadata to improve accuracy of vulnerability matching
Ecosystem-aware matching processes
Optimized vulnerability feed selection
Enriched vulnerability data exclusive to Anchore Enterprise — additional context and corrections that paid customers receive beyond what is available in the open source Grype scanner
Anchore Enterprise also provides two user-controlled mechanisms — Corrections and Hints — that let organizations further refine matching behavior and improve result quality.
Prioritizing Vulnerability Findings
Anchore Enterprise enables organizations to triage vulnerabilities and risks based on technical and operational context.
You can:
Prioritize risks based on severity, exploitability, deployment status, or fix availability
Use the Anchore Score — a composite risk index that combines CVSS severity and score, EPSS, and CISA KEV data — to prioritize vulnerabilities that matter most within an app version
Use policies to generate warnings or stop a build or deployment
Annotate vulnerabilities with VEX data fields to express how each finding impacts your software — see Annotations
Search, Reporting, and Evidence
Anchore Enterprise supports two distinct reporting jobs — both documented under Reporting.
Search — find vulnerabilities across assets through the Reports view in the GUI, saved reports, custom templates, and the query API
Evidence — produce formal documents for downstream consumers: VEX (Vulnerability Exploitability eXchange), VDR (Vulnerability Disclosure Report), and vulnerability data exports from images and app versions
For long-running registry coverage, repositories automatically analyze new image tags as they appear. For runtime visibility, Kubernetes inventory keeps Anchore Enterprise aware of containers active in your clusters, and continuously checks them against the latest set of security vulnerabilities.
9.1 - How It Works
Vulnerability management is the practice of identifying, categorizing, and remediating security vulnerabilities in software. Anchore Enterprise automates this by matching the contents of an SBOM against curated, Anchore-enriched vulnerability intelligence.
Internally, vulnerability data moves through a pipeline before it ever reaches your results:
Anchore Enterprise evaluates vulnerabilities in two distinct scopes — pick the one that matches how your team organizes software. Both scopes draw from the same vulnerability data, but they differ in what the matching runs against, how some matching behaviors are tuned, and how findings are aggregated. See What’s Shared and What Differs Between Scopes for the scope-specific matching behaviors.
Scope
What is evaluated
Where you read results
App-version-scoped
Every asset attached to an app version, aggregated and deduplicated
The version’s detail page in the GUI; AnchoreCTL: anchorectl app version vuln list; or API GET /apps/{id}/versions/{vid}/vulnerabilities
Image-scoped
A single analyzed container image, identified by digest
The image’s detail page in the GUI; AnchoreCTL: anchorectl image vulnerabilities; or API: GET /images/{digest}/vuln/{type}
The image-scoped surface is the long-standing path and remains fully supported. The app-version-scoped surface is the v6-native path for teams that have adopted the apps, versions, and assets model; it adds deduplicated aggregation across multiple assets in a release and surfaces the Anchore Score as a vulnerability prioritization index.
Vulnerability matching in Anchore Enterprise begins with collecting vulnerability data from multiple sources to identify vulnerabilities in the packages cataloged within an SBOM.
Anchore Enterprise consolidates data from these sources into a format suitable for vulnerability identification in SBOMs. One key source of data is the National Vulnerability Database (NVD). The NVD serves as a widely recognized, vendor-independent resource for vulnerability identification. Additionally, it provides a framework for measuring the severity of vulnerabilities. For instance, the NVD uses the Common Vulnerability Scoring System (CVSS), which assigns numerical scores ranging from 0 to 10 to indicate the severity of vulnerabilities. These scores help organizations prioritize vulnerabilities based on their potential impact.
However, due to known limitations with NVD data, relying on additional vulnerability data sources becomes essential. Anchore Enterprise also presents vulnerability data from vendor-specific databases, which play a crucial role in accurate and efficient detection. These sources enable vulnerability matching from the vendor’s perspective. Examples of such vendor-specific databases include GitHub, the Microsoft Security Response Center (MSRC), and the Red Hat Security Response Database, among many others.
Import and Normalize Data
Anchore’s collection framework reaches out to various data sources, parsing and normalizing that data, then storing it for future use.
There is not one standard format for publishing vulnerability data, and even when there is a standardized data format, such as OVAL or OSV, those formats often have minor incompatible differences in their implementation. The collection framework interprets each data source and outputs a single consistent format that can be used to construct a vulnerability database.
Providers
The process begins with Anchore’s collection framework reaching out to vulnerability data sources. These sources are known as “providers”. The following is a list of providers:
Alpine: Focuses on lightweight Linux distributions and provides vulnerability data tailored specifically to Alpine packages.
Amazon: Offers vulnerability data for its cloud services and Linux distributions, such as Amazon Linux.
Arch Linux / SecureOS: Provides vulnerability data for both Arch Linux and SecureOS.
Chainguard: Specializes in securing software supply chains and delivers vulnerability insights for containerized environments, including Chainguard libraries.
Debian: Maintains a robust security tracker for vulnerabilities in its packages, concentrating on open-source software used in Debian-based systems.
Fedora: Provides vulnerability data including EPEL packages sourced from the Bodhi update system.
GitHub: Provides vulnerability data supported by an extensive advisory database for developers covering numerous language ecosystems.
Mariner (CBL-Mariner): Provides vulnerability data for Microsoft’s CBL-Mariner Linux distribution.
NVD (National Vulnerability Database): Serves as the official U.S. government repository of vulnerability information.
Oracle: Tracks vulnerabilities in Oracle Linux and other Oracle products, focusing on enterprise environments.
RHEL (Red Hat Enterprise Linux): Delivers detailed and timely vulnerability data for Red Hat products, including EUS (Extended Update Support) data.
SLES (SUSE Linux Enterprise Server): Offers vulnerability data for SUSE Linux products, with a strong focus on enterprise solutions, particularly in cloud and container environments.
Ubuntu: Maintains a well-documented vulnerability tracker and provides regular security updates for its popular Linux distribution.
VMware PhotonOS: Provides vulnerability data for PhotonOS.
Wolfi: Provides vulnerability data for a community-driven, secure-by-default Linux distribution that emphasizes supply chain security.
Anchore’s collection framework reaches out to all of these providers, collects and consolidates vulnerability data for use. The result of these operations is the Grype database (GrypeDB).
Build GrypeDB
The data collected from Anchore’s collection framework is consolidated into GrypeDB, a vulnerability database used by Anchore Enterprise for matching vulnerabilities. The Anchore Enterprise database and the Grype database are not the same data. The hosted Anchore Enterprise database contains the consolidated GrypeDB as well as the Exclusion database and Microsoft MSRC vulnerability data. This additional information reserved for Anchore Enterprise both expands the set of known vulnerabilities as well as increases the accuracy of the vulnerability reporting.
Non-Anchore (upstream) Data Updates
When problems are identified in other data sources, Anchore contacts those upstream sources and works with them to correct issues. Anchore has an “upstream first” policy for data corrections — whenever possible, corrections are submitted to upstream data sources rather than applied only to Anchore’s data. This approach creates a better overall vulnerability data ecosystem and fosters beneficial collaboration with upstream projects.
Due to the known issues with the NVD, Anchore Enterprise enhances the quality of its data for analysis by enriching the information obtained from the NVD. This process involves human intervention to review and correct the data. Once this manual process is completed, the cleaned and refined data is stored in the Anchore Enrichment Database.
Before this process was implemented, correcting NVD data was a challenge. The enrichment process provides the flexibility to make changes to affected products and versions, and ensures that the data used by Anchore Enterprise is highly reliable — accurate and free from the common issues associated with NVD data.
Vulnerability Matching Process
Matching is the process of comparing SBOM data against the vulnerability data in Anchore Enterprise. Any vulnerability data surfaced in Anchore Enterprise is the result of a vulnerability match.
CPE Matching
CPE, which stands for Common Platform Enumeration, is a structured naming scheme standardized by the National Institute of Standards and Technology (NIST) to describe software, hardware, and firmware. It uses a standardized format that helps tools and systems compare and identify products efficiently.
CPE matching involves comparing the CPEs found in the SBOM of a software product against a list of known CPE entries to find a match. The diagram below illustrates the steps involved in CPE matching.
Due to the current state of the NVD data as mentioned above, CPE matching can sometimes lead to false positives. This led to the creation of the exclusions dataset managed within Anchore Enterprise. CPE matching is disabled by default for all GitHub-covered ecosystems to reduce false positives. Vulnerability matching can be further tuned by enabling or disabling CPE matching per ecosystem via the API, Anchore Enterprise GUI, or configuration file. See Vulnerability Matching Configuration for details.
The per-ecosystem CPE matching configuration applies to both image-scoped and app-version-scoped (asset) scans, since both run through the same matching engine.
Synthetic CPE Fallback for Packages Without an Ecosystem PURL
When a package is detected without a Package URL (PURL) that carries ecosystem information — for example, a binary surfaced by Syft that does not map to a known package manager — Anchore Enterprise generates a synthetic pkg:generic/{name}@{version} PURL and runs the matcher with --add-cpes-if-none. The matcher then synthesizes CPEs from the package’s name and version, and those CPEs participate in CPE-based matching against NVD.
This fallback ensures that packages without an ecosystem-specific PURL still receive vulnerability coverage, even when CPE matching is disabled by default for the ecosystems already covered through GHSA. The fallback applies regardless of the per-ecosystem by_cpe configuration — it operates one level below it, against packages that have no ecosystem to configure.
The synthetic-CPE fallback applies only to app-version-scoped (asset) scans; it has no effect on image-scoped scans.
Vulnerability Match Exclusions
When a false positive match cannot be resolved using data alone — generally due to limitations of CPE matching — Anchore Enterprise applies Vulnerability Match Exclusions. These exclusions remove a vulnerability from findings for a specific set of match criteria.
The vulnerability match exclusion data is held in a private repository and is not included in the open source Grype vulnerability data.
For example, CVE-2012-2055 is a vulnerability reported against the GitHub product. When matching a CPE against this CVE, CPE is unable to capture this level of detail, causing GitHub libraries for different ecosystems to appear as affected — the Python GitHub library is one such example. To resolve this, the language ecosystems are excluded using a match exclusion.
The exclusion data is shown below:
exclusions:- constraints:- namespaces:- nvd:cpepackages:- language:java- language:python- language:javascript- language:ruby- language:rust- language:go- language:phpjustification:This vulnerability affects the GitHub product suite, not language-specific clientsid:CVE-2012-2055
Matching
The matching process is the same in both Grype and Anchore Enterprise. The vulnerability data is stored in GrypeDB; details such as vulnerability ID, affected packages and versions, and fix information are part of these records.
For example, for vulnerability CVE-2024-9823, the package name (Jetty), fixed version (9.4.54), and affected ecosystems — such as Debian, NVD, and Java — are stored. These ecosystems are referred to as a namespace in the context of a match.
The namespace used for the match is determined by the package stored in the SBOM. For a Debian package, the Debian namespace is used; for Java, the GitHub namespace is used. CPE matching is disabled by default for all GitHub-covered ecosystems (including Java, Python, Ruby, Go, JavaScript, .NET, and Rust), resulting in higher quality matches with fewer false positives. CPE matching can be re-enabled per ecosystem if needed. See Vulnerability Matching Configuration for more details.
The details about the versions affected are used to determine if the version reported by the SBOM falls within the affected range. If it does, the vulnerability matches.
For a successful match, the fixed details field is used to display which version fixes a particular vulnerability. The fix details are specific to each namespace. The version in Debian that fixes this vulnerability, 9.4.54-1, is not the same as the version that fixes the Java package, 9.4.54.
Vulnerabilities on the match exclusion list are removed from results.
Once a match exists, additional metadata can be surfaced. Details such as severity and CVSS are stored with each match record. If a field is missing — such as severity or CVSS — it is filled in from NVD data when available.
The Anchore Score
The Anchore Score is a composite risk index score, ranging from 0.0 to 100.0. It is used to prioritize vulnerabilities, and is composed of the CVSS severity and score, the EPSS score, and the CISA KEV data:
The score is intended as a single value you can sort by, filter on, or set thresholds against to surface the vulnerabilities within an app version requiring the most urgent attention.
The Anchore Score is surfaced in the app-version-scoped evaluation surface — the version detail page in the Anchore Enterprise GUI, AnchoreCTL: anchorectl app version vuln list, and API: GET /apps/{id}/versions/{vid}/vulnerabilities. The image-scoped surface continues to use individual vulnerability metrics without the composite Anchore Score.
Configure Vulnerability Matching
Search by CPE can be globally configured per supported ecosystem. CPE matching is disabled by default for all GitHub-covered ecosystems, since vulnerability reports from the GitHub Security Advisory Database provide comprehensive coverage for these ecosystems. This reduces false positives caused by CPE matching against NVD data.
These settings can be managed in the following ways:
API: Use the GET /v2/system/configurations and PUT /v2/system/configurations/{uuid} endpoints to view and update individual CPE matching settings. Changes take effect dynamically without requiring a service restart.
Anchore Enterprise GUI: Navigate to System > Configuration to view and toggle CPE matching settings per ecosystem.
Configuration File: Settings can also be defined in the Anchore Enterprise configuration file under the policy_engine section.
The fully-specified default configuration is as follows:
policy_engine:vulnerabilities:matching:default:search:by_cpe:enabled:trueecosystem_specific:dotnet:search:by_cpe:enabled:falsegolang:search:by_cpe:enabled:falsejava:search:by_cpe:enabled:falsejavascript:search:by_cpe:enabled:falsepython:search:by_cpe:enabled:falseruby:search:by_cpe:enabled:falserust:search:by_cpe:enabled:falsestock:search:by_cpe:# Disabling search by CPE for the stock matcher will entirely disable binary-only matches# and is *NOT ADVISED*enabled:true
A shorter form of the default configuration, since the default by_cpe is true and all GitHub-covered ecosystems are disabled:
Anchore Enterprise aggregates vulnerability information from several upstream sources.
Common sources include:
National Vulnerability Database (NVD)
Linux distribution security advisories
GitHub Security Advisories (GHSA)
Vendor-specific advisory feeds
Each source may provide:
CVSS scores
Severity ratings
Vendor-specific metadata
Grype collects this information and normalizes it before returning results to Anchore Enterprise.
Vulnerability Severity and CVSS Scoring
Anchore Enterprise determines vulnerability severity using data from multiple upstream vulnerability providers. The following sections explain how severity ratings and CVSS scores are sourced, normalized, and displayed in vulnerability scan results.
Each vulnerability finding in Anchore Enterprise may contain two related values:
Attribute
Description
Severity
A categorical rating indicating the relative impact of the vulnerability
CVSS Score
A numeric score, ranging from 0.0 to 10.0, representing the quantitative risk value from the Common Vulnerability Scoring System (CVSS)
Severity and CVSS scores are derived from vulnerability data processed by Grype and the Grype vulnerability database (GrypeDB).
Different upstream vulnerability sources may report different severity levels or CVSS scores for the same vulnerability. Anchore Enterprise applies normalization and source-specific rules to determine which values are used.
Severity Levels
Anchore Enterprise uses the severity levels defined by Grype.
Supported severity levels are:
Severity
Description
Unknown
Severity cannot be determined
Negligible
Extremely low impact
Low
Low severity vulnerability
Medium
Moderate severity vulnerability
High
Significant severity vulnerability
Critical
Highest severity vulnerability
These values are normalized across all vulnerability sources to ensure consistent reporting.
Severity Schemes
Upstream vulnerability providers use different classification systems for severity. Grype normalizes these schemes into a common representation.
Supported severity schemes include:
Scheme
Severity Levels
CVSS
Severity derived from a CVSS base score
HML
High / Medium / Low
CHML
Critical / High / Medium / Low
CHMLN
Critical / High / Medium / Low / Negligible
Grype maps source-specific severity data into one of these normalized schemes before returning results to Anchore Enterprise.
When a vulnerability source only provides a numeric CVSS score, severity is derived from the score using the standard CVSS severity ranges.
CVSS Score to Severity Mapping
If a vulnerability record includes only a CVSS score, the severity is derived from the base score using the following mapping for CVSS v3 and v4 scoring:
CVSS Base Score
Severity
9.0 – 10.0
Critical
7.0 – 8.9
High
4.0 – 6.9
Medium
0.1 – 3.9
Low
>0 but <0.1
Negligible
Not available
Unknown
Notes
CVSSv3 scores are preferred over CVSSv2 and CVSSv4 scores when multiples are present. However, all 3 scores are provided when data is available for a given vulnerability.
Severity is derived from the advisory’s urgency field
If the urgency field is not defined, severity falls back to NVD severity
Ubuntu vulnerabilities:
Ubuntu advisories may mark vulnerabilities as won’t fix when the affected package belongs to an end-of-life (EOL) release.
Ubuntu CVE status definitions (including “won’t fix”) are available at ubuntu.com/security/cves.
When vulnerabilities are matched using CPE identifiers:
Severity is derived from NVD data
CVSS scores are also sourced from NVD
If multiple CVSS scores are present in the vulnerability record, Grype typically selects the highest available score, favoring CVSSv3 scores over CVSSv2.
“Won’t Fix” Vulnerabilities
Some vulnerabilities may be marked as won’t fix when vendors indicate that a patch will not be provided.
Debian:
Debian advisories may set the fixed version to 0, indicating that the vulnerability is not expected to be fixed.
Ubuntu:
Ubuntu marks vulnerabilities as won’t fix when the affected package belongs to an end-of-life release.
Red Hat:
Red Hat may mark vulnerabilities as Will not fix or Deferred depending on product lifecycle and support status.
Grype Database Processing:
During GrypeDB processing, vulnerabilities may be marked as won’t fix when:
The fixed version is set to 0, and
The advisory indicates that no fix is available.
Conflicting Severity Between Sources
Different vulnerability sources may report different severity ratings for the same vulnerability.
For example, GitHub Security Advisories and the National Vulnerability Database may assign different severity values.
In these cases:
Grype collects severity data from all available sources.
Anchore Enterprise uses the normalized severity returned by Grype.
Additional Notes
CVSS scores are included in Grype JSON output but are not displayed by default in CLI output.
Scan result exports (such as CSV reports) include all available CVSS scores along with their sources.
Comprehensive Distributions
When matching vulnerabilities against a Linux distribution, such as Alpine, Red Hat, or Ubuntu, there is a concept called “comprehensive distribution”. A comprehensive distribution reports both fixed and unfixed vulnerabilities in its data feed.
For example, Red Hat reports on all vulnerabilities, including unfixed vulnerabilities. Some distros, like Alpine, do not report unfixed vulnerabilities. When a distribution does not contain comprehensive vulnerability information, Anchore Enterprise falls back to other data sources on a best-effort basis to determine vulnerabilities affecting Alpine that have not yet been fixed.
Red Hat Enterprise Linux (RHEL) Extended Update Support (EUS)
Anchore Enterprise supports the use of RHEL EUS data when scanning relevant container images for vulnerabilities.
By default, Anchore Enterprise uses RHEL EUS data for any RHEL-based image that is automatically identified as having EUS support during the image analysis process.
The default behavior can be overridden at the system level by altering your vulnerability scanning configuration, or at the image level by applying the anchore.user/extended_support annotation to individual images.
To specify that a RHEL-based image should use EUS data for vulnerability scanning regardless of EUS support detection, set the anchore.user/extended_support annotation to true.
To specify that a RHEL-based image should not use EUS data for vulnerability scanning regardless of EUS support detection, set the anchore.user/extended_support annotation to false.
For more information on the presentation of Extended Update Support detection and its use in image vulnerability scans, see the API documentation for the /images/{image_digest} and /images/{image_digest}/vuln/{vuln_type} APIs.
There are some additional details for the fixed data from NVD that should be explained. NVD does not contain explicit fix information for a given vulnerability. Other namespaces do, such as GitHub and Debian. There is a concept of “Less Than” and “Less Than or Equal” in the NVD data. When a vulnerability is tagged with “Less Than or Equal”, it could mean there is no fix available, or the fix version could not be determined, or a fix was unavailable at the time NVD looked at it. In those cases, fix details cannot be shown for a vulnerability match.
If NVD uses “Less Than”, it is assumed that the version noted is the fixed version, unless that version is part of the affected range of a subsequent CPE configuration for the same CVE. That version is presented as containing the fix.
For example, given data that looks like this:
some_package LessThan 1.2.3
Version 1.2.3 is assumed to contain the fix, and any version less than that, such as 1.2.2, is vulnerable. Alternatively, given data like:
some_package LessThanOrEqual 1.2.2
Version 1.2.2 and below are known to be vulnerable, but the version containing the fix is not known. It could be in version 1.3.0, or 1.2.3, or even 2.0.0. In these cases, fix details are not surfaced. If such details become available in the future, the CVE data will be updated.
Scan Windows Images
Anchore Enterprise can analyze and provide vulnerability matches for Microsoft Windows images. Anchore Enterprise downloads, unpacks, and analyzes the Microsoft Windows image contents similar to Linux-based images, providing OS information as well as discovered application packages like npms, gems, Python, NuGet, and Java archives.
Vulnerabilities for Microsoft Windows images are matched against the detected operating system version and KBs installed in the image. These are matched using data from the Microsoft Security Response Center (MSRC) data API.
Supported Windows Base Image Versions
The following are the MSRC Product IDs that Anchore Enterprise can detect and provide vulnerability information for. These provide the basis for the main variants of the base Windows containers: Windows, ServerCore, NanoServer, and IoTCore.
Product ID
Name
10481
Windows 8.1 for 32-bit systems
10482
Windows 8.1 for x64-based systems
10484
Windows RT 8.1
10729
Windows 10 for 32-bit Systems
10735
Windows 10 for x64-based Systems
10788
Windows 10 Version 1511 for x64-based Systems
10789
Windows 10 Version 1511 for 32-bit Systems
10852
Windows 10 Version 1607 for 32-bit Systems
10853
Windows 10 Version 1607 for x64-based Systems
10951
Windows 10 Version 1703 for 32-bit Systems
10952
Windows 10 Version 1703 for x64-based Systems
11453
Windows 10 Version 1709 for 32-bit Systems
11454
Windows 10 Version 1709 for x64-based Systems
11583
Windows 10 Version 1709 for ARM64-based Systems
11497
Windows 10 Version 1803 for 32-bit Systems
11498
Windows 10 Version 1803 for x64-based Systems
11563
Windows 10 Version 1803 for ARM64-based Systems
11568
Windows 10 Version 1809 for 32-bit Systems
11569
Windows 10 Version 1809 for x64-based Systems
11570
Windows 10 Version 1809 for ARM64-based Systems
11644
Windows 10 Version 1903 for 32-bit Systems
11645
Windows 10 Version 1903 for x64-based Systems
11646
Windows 10 Version 1903 for ARM64-based Systems
11712
Windows 10 Version 1909 for 32-bit Systems
11713
Windows 10 Version 1909 for x64-based Systems
11714
Windows 10 Version 1909 for ARM64-based Systems
11766
Windows 10 Version 2004 for 32-bit Systems
11767
Windows 10 Version 2004 for ARM64-based Systems
11768
Windows 10 Version 2004 for x64-based Systems
11800
Windows 10 Version 20H2 for x64-based Systems
11801
Windows 10 Version 20H2 for 32-bit Systems
11802
Windows 10 Version 20H2 for ARM64-based Systems
11896
Windows 10 Version 21H1 for x64-based Systems
11897
Windows 10 Version 21H1 for ARM64-based Systems
11898
Windows 10 Version 21H1 for 32-bit Systems
11929
Windows 10 Version 21H2 for 32-bit Systems
11930
Windows 10 Version 21H2 for ARM64-based Systems
11931
Windows 10 Version 21H2 for x64-based Systems
12097
Windows 10 Version 22H2 for x64-based Systems
12098
Windows 10 Version 22H2 for ARM64-based Systems
12099
Windows 10 Version 22H2 for 32-bit Systems
11926
Windows 11 Version 21H2 for x64-based Systems
11927
Windows 11 Version 21H2 for ARM64-based Systems
12085
Windows 11 Version 22H2 for x64-based Systems
12086
Windows 11 Version 22H2 for ARM64-based Systems
10378
Windows Server 2012
10379
Windows Server 2012 (Server Core installation)
10483
Windows Server 2012 R2
10543
Windows Server 2012 R2 (Server Core installation)
10816
Windows Server 2016
10855
Windows Server 2016 (Server Core installation)
11571
Windows Server 2019
11572
Windows Server 2019 (Server Core installation)
11923
Windows Server 2022
11924
Windows Server 2022 (Server Core installation)
11466
Windows Server, version 1709 (Server Core installation)
11499
Windows Server, version 1803 (Server Core installation)
11647
Windows Server, version 1903 (Server Core installation)
11715
Windows Server, version 1909 (Server Core installation)
11769
Windows Server, version 2004 (Server Core installation)
11803
Windows Server, version 20H2 (Server Core installation)
Windows Operating System Packages
Just as Linux images are scanned for packages such as RPMs, DPKG, and APK, Windows images are scanned for the installed components and Knowledge Base patches (KBs). When listing operating system content on a Microsoft Windows image, the results returned are KB identifiers that are numeric. Both the name and version will be identical and are the KB IDs.
9.2 - Scans
A vulnerability scan in Anchore Enterprise is the result of matching an artifact’s SBOM against the vulnerability data provided by the Anchore Data Service. See How It Works for the underlying matching pipeline that produces every finding.
Anchore Enterprise exposes scan results in two distinct scopes. Pick the one that matches how your team organizes software.
Staying current:App-version-scoped results refresh automatically: findings are re-evaluated whenever the vulnerability database is updated from the Anchore Data Service, and whenever an asset is added to the version. No subscription or manual refresh is required. Image-scoped results refresh when you retrieve them, and can also be kept current automatically with subscriptions. For example, vuln_update re-scans an image and notifies you when its set of vulnerabilities changes.
Two Scan Scopes
The two scopes differ in what the scan runs against and how findings are aggregated. Both draw from the same vulnerability data and share the same matching engine.
Every asset attached to an app version: container images, analyzed filesystems, and externally supplied SBOMs (see Asset Types), deduplicated across the version
Aggregated list across all assets in the version, with Anchore Score prioritization for vulnerabilities
A single analyzed container image, identified by digest
Per-image list of findings with vulnerability attributes and fix details
The app-version-scoped surface is the v6-native path. An app version can hold any mix of asset types (not just container images, but also analyzed filesystems and externally supplied SBOMs), so this scope gives you a single, deduplicated vulnerability view across an entire app version regardless of how each part was analyzed. It also surfaces the Anchore Score as a vulnerability prioritization field.
The image-scoped surface is the long-standing v5 path; it remains the right choice for ad-hoc checks of a single image, image-stage CI gates, and any workflow that has not yet adopted the apps, versions, and assets model.
What’s Shared and What Differs Between Scopes
Both scopes draw from the same vulnerability data: NVD, vendor-specific feeds, GHSA, MSRC, and Anchore’s enrichment dataset all flow through both scopes equally.
The matching engine is shared as well: both scopes run the same matcher, so CPE matching configuration and namespace handling apply identically regardless of scope. One matching behavior is scope-specific:
Synthetic-CPE fallback for packages without an ecosystem PURL applies only to app-version-scoped (asset) scans. It has no effect on image-scoped scans.
The primary difference between the scopes is aggregation: an image-scoped scan returns one list for one image, while an app-version-scoped scan deduplicates across every asset in the version and aggregates the findings into a single list at the version level.
Where to Go Next
Scan an App Version: GUI / CLI / API walkthrough for the app-version-scoped path
For finding vulnerabilities across multiple assets at once (saved reports, custom report templates, and the query API), see Search.
9.2.1 - Scan an App Version
App-version-scoped vulnerability scanning produces a single, deduplicated list of vulnerabilities for an entire app version — across every asset attached to that version, whether the asset is a container image, an analyzed filesystem, or an externally supplied SBOM. This is the v6-native evaluation surface; for per-image scanning, see Scan a Container Image.
The app-version scope adds two capabilities that the image scope does not surface directly:
Deduplication across assets. A package of a given version contained in two assets produces one record at the version level, not two. The same logic applies across vulnerabilities and compliance issues. All instance data is collapsed into a single record with click-throughs for impacted assets.
Anchore Score prioritization. Every vulnerability includes a composite score combining CVSS severity and score, EPSS, and CISA KEV data. This score reflects a particular vulnerability’s relative ranking across all vulnerabilities for an app version. The Anchore Score can be used to sort or filter vulnerabilities.
Scan an App Version in the Anchore Enterprise GUI
The app version detail page in the GUI aggregates findings across the version’s assets into a single, deduplicated view. The Vulnerabilities tab is the primary surface for triaging findings; the per-asset drill-down and pivot queries answer the follow-on question of where a vulnerability lives.
Triage Findings by Anchore Score
Sort the Vulnerabilities tab by Anchore Score to put the highest-prioritized findings at the top. The score combines CVSS severity and score, EPSS, and CISA KEV data, so a single sort ordering surfaces the work most worth attention against all vulnerabilities in an app version.
Pivot to Affected Assets
From a single vulnerability record, open the affected-assets popup to see every asset in the version that contains the vulnerable package and where the package lives inside each asset. This is the GUI equivalent of the API’s pivot endpoints — packages-by-vulnerability below, and assets-by-package in Viewing an App Version’s SBOM.
Scan an App Version with AnchoreCTL
The vulnerability list for an app version is exposed under anchorectl app version vuln. The command requires the parent app via --app and accepts either the version name or its UUID.
List Vulnerabilities for an App Version
The default output is a terminal-friendly table aggregated across every asset in the version:
anchorectl app version vuln list 1.4.0 --app my-service
For programmatic consumption, use -o json to retrieve the full per-finding record including CVSS, EPSS, CISA KEV flags, source provenance, and the asset-level attribution for each finding:
anchorectl app version vuln list 1.4.0 --app my-service -o json
The app version vuln list command supports the formats text, json, json-raw, and id. For HTML or CSV outputs intended as downstream deliverables, use the export command described below.
Export Vulnerabilities as a Formal Report
To turn an app version’s findings into a formal, shareable document — a CSV vulnerability export, or a VEX or VDR document — use the anchorectl app version export commands. These run as server-side jobs and are documented, alongside the GUI and API equivalents, under Evidence.
Scan an App Version with the API
App-version vulnerability data lives under /apps/{app_id}/versions/{version_id}/vulnerabilities. The full request and response schemas — including the per-finding data shape with CVSS, EPSS, KEV flags, Anchore Score, and per-asset attribution — are in the API browser; search for the App Version Vulnerabilities tag.
Pivot: packages affected by a specific vulnerability
For the export-job endpoints (CSV, VEX, VDR) under the App Jobs tag, see Evidence.
A few conventions worth knowing as you call these endpoints:
Vulnerability deduplication respects each asset’s distro context for filtering, then merges related CVEs across sources. The deduplication logic matches what is applied elsewhere in Anchore Enterprise.
The vulnerabilities endpoint accepts an optional asset_id query parameter to narrow the result to a single asset rather than the aggregated view.
For the package-side query surface across an app version — package listings and the assets-by-package pivot — see Viewing an App Version’s SBOM.
Cross-account requests follow the standard pattern — see Account Scoping.
9.2.2 - Scan a Container Image
Image-scoped vulnerability scanning analyzes a single container image and returns the vulnerabilities discovered in its contents — packages, OS components, and Knowledge Base patches for Windows images. This is the long-standing v5 evaluation path and remains fully supported in v6. For the v6-native release-stage path that aggregates findings across every asset in an app version, see Scan an App Version.
Centralized vs Distributed Analysis
Anchore Enterprise supports two analysis modes. Both produce identical vulnerability results once analysis completes; they differ in where the image bytes are read and where the SBOM is generated.
Centralized analysis — AnchoreCTL or the API tells Anchore Enterprise to pull the image from your registry and analyze it server-side. This is the default mode. Because the full image contents are available to Anchore Enterprise, centralized analysis is required for malware scanning, which distributed analysis cannot perform.
Distributed analysis — AnchoreCTL pulls or reads the image where you run the command, generates the SBOM locally, and uploads the result. Anchore Enterprise never sees the image bytes.
Scan a Container Image in the Anchore Enterprise GUI
From an authenticated session, the Images menu in the left navigation opens the Image Analysis view. The Image Analysis view lists every image that has been submitted, with Analyze Tag and Analyze Repository controls to submit new work.
Only administrators and standard users with the requisite role-based access control permissions are allowed to submit items for analysis, or remove previously analyzed assets.
Analyze a Tag
Open Analyze Tag to submit a single image. Fill in the registry, repository, and tag. The dialog also exposes:
Watch Tag — monitor the tag for updates after the initial analysis. Subsequent pushes to the same tag will be picked up and re-analyzed.
Receive Alerts — subscribe the tag to the alerts subscription so Anchore Enterprise raises alerts when new findings are detected for it. See Subscriptions.
Force Reanalysis — re-analyze an already-analyzed tag, regenerating its SBOM. Useful for picking up new analyzer capabilities or a newly attached Dockerfile.
Add Annotation — attach key=value metadata to the image record. Annotations appear in the image overview, in webhook notifications, and in the API responses.
Dockerfile upload — attach the Dockerfile used to build the image so policy checks can evaluate Dockerfile triggers.
Analyze a Repository
Open Analyze Repository to submit every tag in a repository at once. Provide the registry and repository name, and pick how the repository should be monitored going forward:
One-Time Tag Analysis — analyze the tags currently present in the repository; do not monitor it for future additions.
Automatically Check for Updates to Tags — analyze current tags and continue monitoring the repository so new tags are picked up automatically.
The dialog also offers two checkboxes:
Exclude Existing Tags — when monitoring for updates, analyze only tags added after watching begins; the tags already present in the repository are not analyzed.
Receive Alerts — subscribe the repository to the alerts subscription so Anchore Enterprise raises alerts when new findings are detected across its images. See Subscriptions.
After confirmation, the dialog displays a count of the tags that will be queued for analysis so you can review the workload before committing.
View Vulnerabilities for an Image
From the Images view, drill into a repository, pick an image digest, and open the Vulnerabilities tab. The tab lists every finding for that image with severity, package, CVE, and fix data. The toolbar exposes a vulnerability-report download in JSON or CSV format.
Bulk Removal from a Repository
From a repository view, the Analysis Cancellation / Repository Removal control offers two actions:
Cancel Images Currently Pending Analysis — drain the analysis queue for tags in this repository that have not yet been analyzed
Remove Repository and Analyzed Items — remove the repository from view, including every image currently associated with it. If the repository is being watched, that subscription is also removed.
Scan a Container Image with AnchoreCTL
AnchoreCTL exposes the full image lifecycle under anchorectl image. Examples below use docker.io/my-org/api:1.4.0 as the canonical reference image.
Add an Image (Centralized Analysis)
anchorectl image add instructs Anchore Enterprise to pull and analyze the image server-side. The image record is created immediately with status not_analyzed; the status moves to analyzing once a worker picks it up and to analyzed when complete:
anchorectl image add docker.io/my-org/api:1.4.0
Anchore Enterprise can enforce a maximum image size for analysis. Submissions larger than the configured limit are rejected with an HTTP 400; the limit is disabled by default. See Scanning Configuration.
Add an Image (Distributed Analysis)
Pass --from to switch to distributed analysis. AnchoreCTL pulls or reads the image locally, generates the SBOM, and uploads it:
AnchoreCTL pulls the image from the registry (recommended over docker)
Local Docker daemon
docker
Reads an image already loaded into Docker
Docker archive
docker-archive:/path/to.tar
Loads from a local tar file
Syft SBOM stdin
- (combined with piped Syft output)
Imports a Syft-generated SBOM directly
When analyzing an image that has been pushed to a registry, prefer –from registry over –from docker. The registry source removes the need to have Docker installed locally, produces a consistent image digest, and avoids limitations of the Docker daemon’s manifest and digest handling.
Use --platform to pin a specific platform when the image manifest carries multiple architectures:
Always pass the Dockerfile for images you build yourself. The Dockerfile is stored alongside the image analysis and is used by the dockerfile policy gate:
To change an annotation, re-run the command with the updated value; the prior value is overridden.
Re-Analyze an Image
The --force flag resets an image’s analysis state back to not_analyzed and queues it for re-analysis. Use this when you change the Dockerfile or want to pick up new analyzer capabilities introduced in a later Anchore Enterprise release:
By default, adding an image subscribes the tag to the tag_update subscription so Anchore Enterprise watches the tag for new content. Pass --no-auto-subscribe to skip this:
To register a specific image by digest with its associated tag — useful for images that have moved off the current :latest pointer but are still available in the registry:
Submitting a specific digest with an associated tag tells Anchore Enterprise to treat that digest as the most recent for the tag. If the registry’s actual tag history differs (for example, a newer image has been pushed to that tag), the tag history in Anchore Enterprise may not match the registry.
Get Vulnerabilities for an Image
Once an image is analyzed, anchorectl image vulnerabilities returns its findings. The default output is a terminal-friendly table:
✔ Fetched vulnerabilities
┌────────────────┬──────────┬──────────────┬────────────┬──────┐
│ VULN ID │ SEVERITY │ PACKAGE │ FIX │ TYPE │
├────────────────┼──────────┼──────────────┼────────────┼──────┤
│ CVE-2024-3094 │ Critical │ xz-utils │ 5.6.2-1 │ os │
│ CVE-2024-1234 │ High │ openssl │ won't fix │ os │
│ CVE-2023-5678 │ Medium │ libcurl │ 7.85.0 │ os │
└────────────────┴──────────┴──────────────┴────────────┴──────┘
The output format is controlled with -o. Supported formats are text, json, json-raw, csv, cyclonedx-json, cyclonedx-xml, and html. The flags below combine cleanly with any of them:
Flag
Purpose
--type
Filter findings to a specific vulnerability type (for example os, non-os, java)
--vendor-only
Exclude vulnerabilities the vendor has marked as won’t-fix
--annotations
Filter by VEX annotation status (not_affected, affected, fixed, under_investigation)
--include-description
Include the full vulnerability description
--refresh
Re-run vulnerability matching against the latest data before returning
To produce a formatted HTML report suitable for saving as a build artifact, combine -o html with -d to write the result to a directory:
anchorectl image vulnerabilities docker.io/my-org/api:1.4.0 \
-o html \
-d ./reports
The same flags work for filtering before export — for example, an HTML report of only the findings the team has not yet annotated:
anchorectl image delete removes an analyzed image record. If the image is the only one associated with a tag, or if any subscriptions are active against the tag, pass --force:
Image scanning is exposed under /images and /images/{image_digest}. The full endpoint inventory, request and response schemas, and error codes are in the API browser; search for the Images tag.
Key endpoints:
Method
Path
Purpose
POST
/images
Submit an image for analysis (centralized)
GET
/images
List analyzed images
GET
/images/{image_digest}
Get an image’s full record
GET
/images/{image_digest}/vuln/{vuln_type}
Get vulnerabilities for an image
GET
/images/{image_digest}/check
Get the policy evaluation for an image
DELETE
/images/{image_digest}
Delete an image
A few conventions worth knowing as you call these endpoints:
The vuln_type path segment accepts os, non-os, all, and specific package types like java, python, npm, etc.
The vulnerabilities endpoint can return CycloneDX VEX-style documents via /images/{image_digest}/vuln/{vuln_type}/cyclonedx-json and cyclonedx-xml.
Cross-account requests use the x-anchore-account header — see Account Scoping.
Watch a Repository for New Images
For long-running registry coverage — where every new tag pushed to a repository should be picked up automatically without a manual image add — Anchore Enterprise lets you put a repository under watch. See Watch a Repository for New Images for the full workflow across the GUI, AnchoreCTL, and the API.
9.2.2.1 - Watch a Repository for New Images
Repositories give Anchore Enterprise a way to monitor a registry repository for new tags and automatically analyze them as they appear. This is a common setup for production registries where every new release tag should be picked up without a manual image add.
Repositories are an extension of the image scanning workflow — once a repository is added and watched, every tag picked up from it follows the same analysis pipeline as a manually added image, and its findings appear in the same image-scoped views.
In Anchore Enterprise, a registry is a stored credential configuration — it tells Anchore how to authenticate to a registry host and does not pull or analyze any images on its own. Repositories are the unit of automatic analysis — once a repository is added and watched, Anchore Enterprise enumerates its tags and pulls them in for analysis. For private repositories, configure the registry credentials first; see Container Registries.
Watch a Repository in the Anchore Enterprise GUI
Open the Images view, click Analyze Repository, and choose Automatically Check for Updates to Tags in the resulting dialog. Anchore Enterprise enumerates the repository’s current tags, queues them for analysis, and continues to monitor the repository for new ones.
Repository watching is managed through anchorectl repo. Each command operates on a registry/repository identifier such as docker.io/my-org/api.
Add a Repository to the Watch List
anchorectl repo add registers a repository and immediately starts watching it. Anchore Enterprise enumerates the current tags and queues them for analysis:
anchorectl repo add docker.io/my-org/api
To watch the repository for new tags without analyzing the existing ones, pass --exclude-existing-tags. To skip the default behavior of auto-subscribing discovered tags to the tag_update subscription, pass --auto-subscribe=false.
List Watched Repositories
anchorectl repo list shows every repository under watch:
anchorectl repo list
Pause and Resume Watching
unwatch pauses monitoring without removing the repository record. The repository stays in the list but no longer picks up new tags:
anchorectl repo unwatch docker.io/my-org/api
Re-enable monitoring with watch:
anchorectl repo watch docker.io/my-org/api
Stop Watching a Repository
anchorectl repo delete removes the repository from the watch list entirely. Existing image records analyzed from the repository are not affected by this command:
anchorectl repo delete docker.io/my-org/api
Remove a Repository and All Its Images
To remove the repository and every image record produced from it — for example, after accidentally watching a repository with a very large tag count — combine the unwatch, repository-delete, and image-delete steps. Unwatch first to prevent new tags from being added during the cleanup:
anchorectl repo unwatch docker.io/my-org/api
anchorectl repo delete docker.io/my-org/api
for digest in $(anchorectl -q image list | grep docker.io/my-org/api | awk '{print $2}'); do anchorectl image delete "$digest" --force
done
Image deletion can affect more than the repository being cleaned up — an image with the same digest may have tags in other repositories or even other registries. Verify the scope of the deletion before running the loop.
Watch a Repository with the API
Adding a repository to the watch list is exposed under /repositories; listing and removing watches are managed through /subscriptions, since a repository watch is a repo_update subscription. The full endpoint inventory, request and response schemas, and error codes are in the API browser; search for the Repository and Subscriptions tags.
List subscriptions; filter to repo_update for watched repositories
DELETE
/subscriptions/{subscription_id}
Stop watching a repository (delete its repo_update subscription)
For the per-tag subscription model that drives the auto-analysis behavior — what tag_update subscriptions are, how repo_update differs, and how to manage them in bulk — see Subscriptions.
9.3 - Reporting
Anchore Enterprise supports two distinct reporting jobs that operate on the vulnerability and package data already produced by scans: looking for vulnerabilities across the image catalog, and producing formal documents for downstream consumers.
Two Reporting Jobs
The two jobs use different surfaces and produce different outputs. Pick the one that matches the question you are answering.
Formal documents in standard formats — VEX, VDR, vulnerability data exports
Sharing with customers, auditors, regulators, downstream consumers
Search is the analytical surface and currently covers the image catalog only. The Reports view in the Anchore Enterprise GUI lets you build custom report templates, save them, and run them on demand. The same data is reachable from the Query API for tooling integrations. App-version-scoped search is on the roadmap — see Search for the full current state.
Evidence is the document-producing surface and covers both image-scoped and app-version-scoped exports today. AnchoreCTL and the API submit jobs that produce a fully-formed document — a VDR (Vulnerability Disclosure Report), a VEX (Vulnerability Exploitability eXchange), or a vulnerability data export — that you can hand to a downstream consumer or attach to a release.
Where to Go Next
Search — find vulnerabilities across assets using the GUI Reports view, saved reports, custom templates, and the query API
Evidence — produce VEX, VDR, and vulnerability data exports from images and app versions
For routing vulnerability findings into external systems like Slack or Jira, the Anchore Enterprise GUI also includes an Action Workbench for building action plans on top of the integrations configured in your account. The Workbench is an additional surface for teams that need to push findings into existing ticketing or notification workflows — the primary day-to-day reporting mechanisms remain the Reports view, the export jobs, and the API.
9.3.1 - Search
Search answers questions that span more than one image in your catalog: “Which images have a Critical finding with a known KEV?”, “Which images contain a vulnerable version of a specific package?”, “Which images failed a policy evaluation in the last week?”
Coming soon: Applications search capability in the GUI and API.
Current search and reporting capability operates on the image catalog only — the Query API and Reports view below cover image-scoped questions.
Anchore Enterprise exposes two search surfaces over the image catalog. They draw from the same underlying vulnerability and package data — the choice is about who is running the query and what they want back.
For producing formal documents — VEX, VDR, SBOMs, vulnerability data exports — see Evidence. Evidence exports are available at both image and app-version scopes today.
Search via the Reports View
The Reports tab in the Anchore Enterprise GUI is the interactive search surface. Reports are built from templates that define which filters appear on the report form and which columns appear in the result, and from executions that capture the result of running a configured report at a point in time.
New Report
The New Report tab is where reports are composed and executed. Pick a template, set the filter values, and run the report once for an immediate result, or save it for re-use.
Saved Reports
Saved reports retain their template, filter selections, and execution history. From the Saved Reports tab you can:
Run a saved report on demand — Generate Now.
Schedule the report to run on a recurring cadence and notify subscribers when results are ready.
Browse past executions, download their CSVs, or drill into the on-screen results.
Templates
Templates define the shape of a report: which filters are presented to the user, with what defaults, and which columns appear in the result.
Anchore Enterprise ships a set of system templates as starting points — for example, “Images Affected by Vulnerability”, “Images Failing Policy Evaluation”, and “Tags by Vulnerability”. System templates cannot be modified, but you can copy any of them into a user template and tailor the filter and column set to your team’s needs.
Templates and reports are both account-scoped. Templates created by other users in the same account are visible and can be used as a starting point for further customization.
The reporting data cycle is configurable on the deployment, and results in the Reports view may lag analysis output. See Reporting Service configuration for the cycle frequency and tuning options.
Search via the API
The Query API is the programmatic surface for zero-day investigation and tooling integrations. Two endpoints cover the common patterns: look up a vulnerability by ID, or find images containing a specific package version.
The Query API operates on container images only, matching the current scope of search and reporting in Anchore Enterprise. For known app versions, use anchorectl app version vuln list or the per-version API endpoints documented in Scan an App Version directly.
Find Images by Package
When the vulnerability record is incomplete — common in the first hours after disclosure — search by the affected package version directly. The classic example: locate every image with a vulnerable version of k8s.io/ingress-nginx.
curl -X GET \
'{anchore-url}/v2/query/images/by-package?name=k8s.io%2Fingress-nginx&package_type=go&version=v1.11.0'\
-H 'accept: application/json'
The response is a paginated PaginatedImageList — each entry names the image digest, the tag history that points at it, and the package records that match the filter:
For the full zero-day investigation pattern — including how to escalate from a package match to remediation — see the Find Zero-day Vulnerabilities quickstart.
Look Up a Vulnerability by ID
When the vulnerability ID is known, GET /v2/query/vulnerabilities returns the underlying record and the packages it affects:
curl -X GET \
'{anchore-url}/v2/query/vulnerabilities?id=CVE-2024-3094'\
-H 'accept: application/json'
Useful as a quick “does Anchore Enterprise know about this yet?” check before kicking off a broader hunt.
The full request and response schemas for both endpoints are in the API browser under the Query tag.
Where to Go Next
Evidence — produce formal documents from search results: VEX, VDR, vulnerability data exports.
Annotations — record VEX dispositions on findings; annotations feed the VEX evidence exports and will be filterable through the future app-version search surface.
Evidence is what you hand to a customer, an auditor, a regulator, or a downstream consumer. Anchore Enterprise turns the vulnerability and annotation data it already holds into three kinds of formal, standards-aligned documents:
Document
Format
What’s in it
VEX (Vulnerability Exploitability eXchange)
CycloneDX JSON (app-version)
CycloneDX JSON, CycloneDX XML, OpenVEX (image)
The vulnerabilities found and the VEX annotations recorded against them — your published statement on what affects the product.
VDR (Vulnerability Disclosure Report)
CycloneDX JSON
A combined SBOM-plus-vulnerabilities document: the components, their known vulnerabilities, and the VEX annotations alongside. The single artifact to attach to a release for downstream consumers.
The raw finding rows: vulnerability ID, severity, CVSS, EPSS, KEV, fix availability, affected package, and source. For ingestion into tickets, spreadsheets, and downstream tooling.
Evidence is available at both app-version and image scope.
For SBOM evidence — CycloneDX and SPDX SBOM exports of an app version’s contents — see Export an SBOM.
Evidence from an App Version
App-version evidence runs as an asynchronous job — submit the job, wait for completion, and the result is written to a file or stdout.
Via the Anchore Enterprise GUI
Open the app version detail page, click on the Download button, and choose the document type from the menu along with the desired format (where supported), and click Download. The My Recent Activity panel on the App Version Summary tab shows the job’s progress and, once complete, the link to download the generated document.
Via AnchoreCTL
Each evidence type has a dedicated subcommand under anchorectl app version export:
Each command submits a job, waits for completion, and writes the resulting document to the path supplied with --file (or to stdout if --file is omitted).
Today the app-version VEX and VDR exports both produce CycloneDX JSON. The vulnerability data export — the raw finding rows surfaced by anchorectl app version export vulnerabilities — is CSV-only at app-version scope; VEX and VDR carry the same findings wrapped in their respective document forms.
Via the API
App-version exports live under the App Jobs tag of the API:
Download the completed document referenced by a finished job
The job lifecycle is: POST to submit, poll GET .../{job_id} until status is completed, then fetch download_id from the job’s response and GET /apps/{app_id}/downloads/{download_id}. The full request and response schemas are in the API browser; search for the App Jobs tag.
Evidence from an Image
Image-scoped evidence is synchronous — the document is generated on the fly when you request it. No job to track, no separate download step.
Via the Anchore Enterprise GUI
Open the image detail page, switch to the Vulnerabilities tab, and use the Download menu to pick a format. The document streams back to your browser when the request completes.
Via AnchoreCTL
anchorectl image vulnerabilities doubles as the image evidence command — the -o flag selects the output format:
anchorectl image vulnerabilities sha256:<digest> -o csv > image-vulns.csv
anchorectl image vulnerabilities sha256:<digest> -o cyclonedx-json > image-vulns.cdx.json
anchorectl image vulnerabilities sha256:<digest> -o html -d ~/reports/ # -d takes a directory; the HTML file is written into ~/reports/
Supported formats are text, json, json-raw, csv, cyclonedx-json, cyclonedx-xml, and html. The CycloneDX outputs embed VEX annotations recorded on the image’s findings; HTML produces a human-readable summary document suitable as a build artifact.
Via the API
Method
Path
Produces
GET
/images/{image_digest}/vex/openvex
OpenVEX document for the image
GET
/images/{image_digest}/vex/cyclonedx-json
VEX in CycloneDX JSON
GET
/images/{image_digest}/vex/cyclonedx-xml
VEX in CycloneDX XML
GET
/images/{image_digest}/vuln/{vuln_type}
Vulnerability data for the image as paginated JSON. vuln_type is one of os, non-os, or all
Image VEX exports support OpenVEX in addition to CycloneDX — useful for downstream consumers that have standardized on the OpenVEX format.
Where to Go Next
Search — investigate vulnerabilities before producing the formal documents.
Annotations — record the VEX dispositions that drive every VEX and VDR document.
Export an SBOM — produce Syft-native, CycloneDX, or SPDX SBOMs for the components that the vulnerability evidence above sits alongside.
9.4 - Annotations and VEX
A vulnerability annotation records how a specific (vulnerability, package version) pair affects an app version or an individual container image. Each annotation captures a VEX (Vulnerability Exploitability eXchange) status — whether the package is affected, not affected, fixed, or under investigation — along with the justification, supporting notes, and the actions you intend to take.
Annotations serve two purposes:
Internal triage. A not_affected or fixed annotation removes the finding from the default Vulnerabilities view so triage attention stays on the unresolved work. Findings without annotations remain visible; filters can always be adjusted to bring annotated findings back into view.
Downstream evidence. Every annotation becomes part of the unified VEX document generated for an app version. Downstream consumers — customers, certifying bodies, deployment gates — see your analysis state directly rather than having to ask.
Annotations in Anchore Enterprise v6 are anchored at the app version and govern findings across every asset attached to that version. A single annotation against (vulnerability, package version) therefore applies whether the affected package was discovered in a container image asset, a filesystem asset, or an externally supplied SBOM asset — you annotate once at the release level rather than once per asset.
The app-version anchor reflects how VEX works in practice: a VEX statement is a release-level claim about how a product is built and used, not a claim about one specific container image. Anchoring the annotation at the version surfaces it consistently across every asset that makes up the release. For the underlying scan surfaces this annotation governs, see Two Evaluation Scopes.
VEX Status
Every annotation carries one of four statuses:
Status
Meaning
not_affected
The product contains the vulnerable code, but the vulnerability cannot be exploited for various reasons. Additional information should be provided for a detailed explanation.
affected
The vulnerable package is included in the product and the vulnerability can be exploited. Remediation is typically required.
fixed
The product previously contained the vulnerability, but a patch or remediation has been applied to fix it.
under_investigation
The software supplier is still reviewing their product to determine if it is vulnerable.
Annotations with status not_affected and fixed are hidden from the default Vulnerabilities view at the app-version level as well as the individual image vulnerability view so that triage attention stays on the unresolved findings. Use the VEX Status filter on the Vulnerabilities tab to bring them back into view.
Justification
When status is not_affected, supply a justification that names the reason the vulnerability does not impact the product:
Justification
Meaning
component_not_present
The vulnerable component is not included in the product.
vulnerable_code_not_present
The vulnerable component is included, but the vulnerable code is not — usually because of how the component was built or configured.
vulnerable_code_not_in_execute_path
The vulnerable code is present but is never executed by the product.
vulnerable_code_cannot_be_controlled_by_adversary
The vulnerable code runs but cannot be reached or influenced by an attacker.
inline_mitigations_already_exist
The product includes built-in protections that prevent exploitation and cannot be disabled by the attacker.
fix_not_planned
The vulnerability impacts the product but no fix is planned. Anchore-specific extension to the CISA VEX values; available via the API.
The first five justifications are CISA’s minimum requirements for a VEX statement and have direct equivalents in OpenVEX and CycloneDX. fix_not_planned is an Anchore extension and is omitted from CycloneDX exports because it has no CycloneDX justification equivalent.
Supporting Fields
Beyond status and justification, every annotation can carry the following free-text fields. Each is optional except where the VEX format requires it:
Status notes — additional context about why this status was chosen.
Impact statement — required for affected when no justification is supplied; describes how the vulnerability impacts the product.
Action statement — for affected annotations: what steps will be taken to remediate the finding.
Additional details — any other context that should travel with the annotation.
Anchore Enterprise stamps created_at and updated_at timestamps automatically; the two timestamps correspond to “Analysis First Issued” and “Analysis Last Updated” in the exported VEX document.
Roles and Permissions
Creating, editing, and deleting annotations is restricted by RBAC. The built-in role vuln-annotator-editor carries the relevant permissions:
createVulnAnnotation
getVulnAnnotation
listVulnAnnotations
updateVulnAnnotation
deleteVulnAnnotation
Any role that grants listImages (such as read-only) can view annotation data and generate VEX exports — see Evidence for the export surfaces.
The Vulnerabilities tab on an app version detail page is the primary interface for annotation work. Each row is one (vulnerability, package) finding, and the Annotated column shows the current VEX status.
Record an Annotation
Open the app version’s Vulnerabilities tab and click the finding you want to annotate to open its detail panel. To set the status alone, use the inline VEX Status dropdown in the panel (None, Not Affected, Affected, Fixed, or Under Investigation). For a full annotation, click Add VEX Annotation (it reads Edit VEX Annotation once an annotation exists) to open the Vulnerability Exploit Statement editor, where you set the Status, a Justification when the status is Not Affected, and any of the optional supporting fields: Status Notes, Impact Statement, Action Statement, and Additional Details. Save stays disabled until a status other than None is selected; click Save to record the annotation.
Once saved, the Annotated column reflects the status across every related finding.
Delete an Annotation
To remove an annotation, open the Edit VEX Annotation editor for an annotated finding and set Status back to None.
A warning confirms that the annotation will be removed and the Save button changes to Delete. Click Delete to clear the annotation.
Filter Annotated Findings
By default the Vulnerabilities tab shows unannotated findings plus those marked Affected or Under Investigation, so unresolved work stays at the top; findings marked Not Affected or Fixed are hidden. Use the VEX Status filter to add Not Affected or Fixed back into view, which is useful when reviewing the triage backlog or preparing a VEX document for export.
Manage Annotations with AnchoreCTL
Annotation management is exposed under anchorectl app version vex. Every command requires the parent app via --app.
Add an Annotation
The package identity (--pkg-name, --pkg-type, --pkg-version) plus --vuln-id together uniquely identify the (vulnerability, package) pair the annotation applies to:
anchorectl app version vex add 1.4.0 \
--app my-service \
--vuln-id CVE-2024-3094 \
--pkg-name xz-utils \
--pkg-type deb \
--pkg-version 5.6.0-0.2 \
--status not_affected \
--justification vulnerable_code_not_in_execute_path \
--status-notes "xz-utils is bundled but the affected SSH path is not used by this service."
A second annotation for the same (vuln_id, package_name, package_version, package_type) tuple is rejected with a 409 conflict — update the existing annotation instead.
List Annotations for an App Version
anchorectl app version vex list 1.4.0 --app my-service
The default table output covers status, justification, package identity, and the annotation UUID. Use -o json for the full per-annotation record including all supporting fields.
Update an Annotation
Annotations are updated by UUID (the id returned at creation, or the id field from list):
anchorectl app version vex update 943629bb-83ab-0f2c-3326-f0c011ab16cf \
--app my-service \
--version 1.4.0 \
--status fixed \
--status-notes "Upgraded to xz-utils 5.6.2-1 in the 1.4.0 release."
Only the fields supplied on the command line are changed; omitted fields keep their existing values.
Deleting an annotation does not affect the underlying vulnerability finding — the finding reappears in the default Vulnerabilities view because nothing is filtering it out anymore.
Export VEX for an App Version
anchorectl app version export vex produces a CycloneDX VEX document for the app version. The export runs as a server-side job; AnchoreCTL waits for completion and writes the result to a file or stdout:
Annotation endpoints live under /apps/{app_id}/versions/{version_id}/vulnerability-annotations. The full request and response schemas are in the API browser; search for the App Version Vulnerability Annotations tag.
A few conventions worth knowing as you call these endpoints:
The uniqueness constraint is (account, app, version, vulnerability_id, package_name, package_version, package_type). Creating a second annotation for the same tuple returns 409.
PATCH accepts a partial body; omitted fields are left untouched. Explicit null is rejected for the status field — drop the key to leave the status unchanged.
VEX exports are produced by the App Jobs export endpoints rather than the annotation endpoints directly — see Evidence.
Cross-version annotation searches — finding every vulnerability annotated as not_affected across an account, for example — are not yet exposed through a programmatic surface. App-version search and reporting is on the roadmap; see Search for the current state and the per-version data sources available in the meantime.
Policy Gating by Annotation Status
The package trigger on the vulnerabilities compliance gate exposes two parameters that filter findings by annotation state — missing annotation and annotation status. These parameters are available only on rule sets whose artifact type is image; SBOM/app-version rule sets do not currently expose annotation-status filtering at the policy layer. App-version-scoped annotation filtering through search or reports is on the roadmap — see Search for the current state.
Anchore Enterprise can compare an image’s findings — both vulnerabilities and policy results — against those of its base image, so developers can focus on issues introduced by their own changes and filter out noise inherited from a platform team’s golden image.
Base-image comparison is image-scoped only — it operates on a pair of analyzed container images and tags each finding by whether the same issue is present in the base. App-version-scoped evaluations do not currently surface a base-image dimension; for the broader v6 evaluation surface, see Scans.
For an overview of how Anchore Enterprise identifies a candidate base image and applies its selection rules, see Base and Parent Images.
How It Works
Both the image policy-check and the image vulnerabilities API accept an optional base_digest query parameter. When supplied, each finding in the response carries an inherited_from_base field:
true — the same finding exists in the base image.
false — the finding is unique to the evaluated image.
null — no comparison was performed (no base_digest was supplied).
base_digest=auto instructs Anchore Enterprise to select the base image automatically using the ancestry rules described in Base and Parent Images.
Compare Policy Checks
The policy-check endpoint evaluates both images against the same policy and tag, which keeps the comparison fair:
curl -X GET -u <username:password> \
"http://<servername:port>/v2/images/sha256:xyz/check?tag=p/q:r&base_digest=sha256:abc"
Each finding object in the response carries "inherited_from_base": true|false. A dockerfile-instruction trigger that fires on both images will be marked inherited; a vulnerability-package trigger that fires only on the evaluated image will not. The full request and response schemas are in the API browser.
Compare Vulnerabilities
The image-vulnerabilities endpoint also accepts base_digest and tags each matched vulnerability with the same inherited_from_base field:
curl -X GET -u <username:password> \
"http://<servername:port>/v2/images/sha256:xyz/vuln/all?base_digest=sha256:abc"
A CVE that affects the same package in both images is marked inherited_from_base: true; a CVE that affects a package present only in the evaluated image is false.
Where the Comparison Is Used
Beyond the direct API calls, base-image information shows up in several places:
Policies. The Ancestry gate gates rules on the resolved base or ancestor digests. The vulnerabilities gate’s package trigger accepts an inherited_from_base parameter so you can write rules that fire only on findings unique to the evaluated image — see Vulnerabilities gate.
Reports. Vulnerability reports include an Inherited From Base column populated from the same field.
Anchore Enterprise GUI. The image detail page displays the resolved base image and uses it to flag inherited findings on the Vulnerabilities and Compliance tabs.
For the underlying matching pipeline that produces these findings before the comparison runs, see How It Works.
9.6 - False Positives
False positives in vulnerability scanning fall into two distinct categories, and Anchore Enterprise gives you a different tool for each:
The package was identified correctly, but its metadata is wrong — the analyzer guessed a CPE or PURL that doesn’t line up with how vulnerability data describes the same component. Findings either appear that shouldn’t, or fail to appear at all. Fix with Corrections.
The package was not identified at all — your build installs software that Anchore Enterprise’s analyzers don’t recognize, so the SBOM (and therefore the scan) misses it entirely. Fix with Hints.
Corrections and Hints apply only to packages discovered through container image analysis — they do not modify externally supplied SBOMs.
Both features are user-controlled refinements that sit alongside Anchore Enterprise’s built-in false-positive controls — see Reducing False Positives and Noise for the broader context. For the matching pipeline that produces every vulnerability finding before these controls apply, see How It Works.
9.6.1 - Corrections
A correction is a rule that rewrites a package’s metadata at vulnerability-scan time. Anchore Enterprise’s analyzers generate a best-effort PURL and CPE for every package they find, but for some ecosystems — particularly Java archives that ship without a complete manifest — the guess does not match what vulnerability data uses to identify the same component. The result is either spurious matches or missed matches. A correction restates the package’s PURL, CPEs, or other fields so that subsequent scans match against the right vulnerability records.
For the broader context — how SBOM packages get matched against vulnerability data, and the synthetic-CPE fallback that handles unknown ecosystems — see How It Works.
Corrections apply only to packages discovered through container image analysis; they do not modify externally supplied SBOMs.
When to Add a Correction
A worked example: an Anchore Enterprise analysis of a Tomcat image surfaces the catalina.jar archive with this content:
The CPE vendor/product (apache:catalina), the Maven group/artifact in the PURL (org.apache.tomcat-catalina/catalina), and the package name (catalina) all disagree with how the upstream advisory data describes Tomcat Catalina. Vulnerability matches against this package will be unreliable.
Add a Correction
Corrections are managed with anchorectl correction. The command supports both an inline form and a JSON-file form.
description — free-text note describing the correction’s intent.
type — the correction type. Only package is supported.
match.type — the package ecosystem to apply the correction to. In the inline form this is what the --type flag sets; the correction type is always package. Supported values are driven by the analyzers your deployment runs and currently include java, gem, python, npm, os, go, and nuget. Run anchorectl image content --available-types to list the valid content types on a given deployment.
match.field_matches — one or more (field_name, field_value) pairs that select which packages this correction applies to.
replace — the field/value pairs the correction will write. For cpes and purl only, curly-brace templates like {version} are substituted from the matched package at scan time. If a templated field is missing on the package, the CPE component is replaced with * and the PURL replacement is skipped entirely.
Manage Corrections
anchorectl correction list
anchorectl correction get <correction-uuid>
anchorectl correction delete <correction-uuid>
Corrections are referenced by the UUID returned at creation. The same operations are available on the /corrections API — see the API browser for the full request and response schemas.
Verify a Correction
Corrections take effect at the next vulnerability scan. To confirm a correction is matching the way you intended, inspect the analyzed content for a representative image:
A hints file lets a build process tell Anchore Enterprise about packages that its analyzers cannot detect on their own. If you know a container image installs a piece of software through a non-standard mechanism — a manual tar extract, a vendored binary, a build-time install that leaves no package-manager trace — you can declare those packages in a hints file and Anchore Enterprise will include them in the SBOM exactly as if they had been discovered normally.
Hints add packages to the SBOM. They cannot modify or remove findings produced by the regular analyzers — for that, see Corrections. If a hints record names a package the analyzers also find, the hint is ignored and a warning is logged.
Hints apply only during container image analysis; they do not affect externally supplied SBOMs.
The hints feature is disabled by default. Enabling it means whoever builds your container images can inject additional packages into the SBOM — entries the analyzers didn’t produce — which directly affects vulnerability and policy outcomes. Only enable this feature when the build process is fully under your control. See Configuring Content Hints for how to enable it.
How the Hints File Works
When the hints feature is enabled, the Anchore Enterprise analyzer looks for a file at /anchore_hints.json inside every container image it analyzes. Records in that file are added to the image’s SBOM and become part of every subsequent scan.
The file is a JSON object with a single packages array. Each record describes one package:
The schema differs slightly between OS packages and language packages, covered below.
OS Package Records
OS packages represent components installed through an OS distro’s package manager. Supported types are rpm (Red Hat / Rocky / Alma / Amazon), dpkg (Debian / Ubuntu), and apkg (Alpine).
Package names are unique per SBOM in this category. If a hint names an OS package the analyzers already discovered, the hint is ignored (per the rule above); OS hints add only packages the analyzers don’t detect on their own.
Language packages cover the ecosystem-specific package managers. Supported types include java, python, gem, npm, nuget, go, and binary. The full set available on a given deployment is whatever anchorectl image content lists.
Multiple packages with the same name can legitimately co-exist (a project can depend on two versions of the same library installed in different locations), so a location field is the primary disambiguator.
The musl and wicked records from the examples above will appear in the os and gem content listings respectively, as if the analyzers had discovered them directly.
9.7 - Working with Subscriptions
Subscriptions tell Anchore Enterprise to pay attention to specific things — a tag, an image, a registry repository, a Kubernetes namespace — and either keep them up to date or notify you when their state changes. Every long-running automated behavior in Anchore Enterprise that runs in the background on your behalf is driven by one of these subscription types.
For the configuration-side write-up of each subscription type (granularity, background-process behavior, default state), see Subscriptions.
Subscription keys identify what is being watched and depend on the type. For tag_update, policy_eval, vuln_update, and analysis_update, the key is a fully qualified registry/repo:tag. For repo_update, it is a registry/repo. alerts accepts either form — a registry/repo:tag for tag-scoped alerting, or a registry/repo to alert on every image in the repository. For runtime_inventory, it is a cluster/namespace identifier.
Manage Subscriptions in the Anchore Enterprise GUI
A subset of subscription types can be created and toggled directly in the GUI, from the feature area that owns the watched resource. The remaining types — policy_eval, vuln_update, and analysis_update — are managed through AnchoreCTL or the API, covered below.
Watch a Tag in the GUI
On the Analyze Tag dialog in the Images view, enable Watch Tag to create a tag_update subscription for the tag. See Analyze a Tag for the full dialog.
Watch a Repository in the GUI
On the Analyze Repository dialog in the Images view, choose Automatically Check for Updates to Tags to create a repo_update subscription that picks up new tags as they appear. See Watch a Repository for New Images.
Receive Alerts in the GUI
Both the Analyze Tag and Analyze Repository dialogs include a Receive Alerts checkbox that creates an alerts subscription — tag-scoped from the tag dialog, repository-scoped from the repository dialog.
Watch a Cluster or Namespace in the GUI
From the Kubernetes runtime inventory views, toggle a cluster or namespace watch to create a runtime_inventory subscription. See Kubernetes Inventory.
Manage Subscriptions with AnchoreCTL
Subscriptions are managed with the anchorectl subscription command tree; runtime-inventory watches use anchorectl inventory watch.
List Subscriptions
anchorectl subscription list returns every subscription on the deployment and its current state:
tag_update, policy_eval, vuln_update, and analysis_update subscriptions are tied to a fully qualified registry/repo:tag, not to image digests — a subscription survives the tag pointing at a new digest.
Activate and Deactivate Subscriptions
anchorectl subscription activate enables a subscription for a given key and type:
When AnchoreCTL adds a new image with anchorectl image add, it creates and activates a tag_update subscription for that tag by default. To suppress the auto-subscribe:
The same suppression is available via the environment variable ANCHORECTL_IMAGE_NO_AUTO_SUBSCRIBE=true.
Runtime Inventory Subscriptions
Runtime-inventory subscriptions are managed under a dedicated command tree because they take a cluster/namespace key rather than a tag. anchorectl inventory watch enumerates the watched namespaces and toggles activation:
anchorectl inventory watch list
✔ Fetched watches
┌─────────────────────────────────────┬───────────────────┬────────┐
│ KEY │ TYPE │ ACTIVE │
├─────────────────────────────────────┼───────────────────┼────────┤
│ cluster-one/platform-services │ runtime_inventory │ true │
└─────────────────────────────────────┴───────────────────┴────────┘
anchorectl inventory watch activate creates the subscription if one does not already exist.
For the broader Kubernetes integration — the agent, what it reports, and the namespace-scoped views in the Anchore Enterprise GUI — see Kubernetes Inventory.
Manage Subscriptions with the API
Subscriptions are exposed under the /subscriptions collection — create, list, get, update (activate/deactivate), and delete are all available. The full request and response schemas, and error codes, are in the API browser; search for the Subscriptions tag.
Key endpoints:
Method
Path
Purpose
POST
/subscriptions
Create a new subscription of a given type for a key
GET
/subscriptions
List subscriptions; filter with the subscription_key and subscription_type query parameters
GET
/subscriptions/{subscription_id}
Get a single subscription
PUT
/subscriptions/{subscription_id}
Update an existing subscription, including its active state
DELETE
/subscriptions/{subscription_id}
Delete a subscription
A few conventions worth knowing as you call these endpoints:
Create a subscription with POST; change an existing one — including activating or deactivating it — with PUT. The AnchoreCTL activate and deactivate commands change the active state through these endpoints.
GET, PUT, and DELETE address a subscription by its subscription_id. AnchoreCTL accepts the friendlier key-and-type form and resolves the ID for you.
Cross-account requests are scoped via the x-anchore-account header or, from AnchoreCTL, the ANCHORECTL_ACCOUNT environment variable. See Account Scoping for the full mechanism.
9.8 - Kubernetes Inventory
Kubernetes Inventory gives Anchore Enterprise a continuously updated view of every container image running in your clusters, broken down by cluster, namespace, node, and pod. Once a cluster is wired up, Anchore Enterprise pulls in the images it discovers, analyzes them, and surfaces the resulting vulnerability and policy findings on a Kubernetes-aware view in the Anchore Enterprise GUI — so you can answer “where in production is an image running which contains a vulnerable package for a given CVE?” directly rather than by spreadsheet.
The inventory agent and its deployment are documented separately:
Kubernetes Runtime Inventory — installation and configuration of anchore-k8s-inventory, the in-cluster agent that reports container metadata back to Anchore Enterprise.
Runtime Inventory — deployment-wide runtime configuration: inventory time-to-live, retention behavior, and shared options that apply to both Kubernetes and ECS inventory agents.
The Anchore Kubernetes Inventory Agent is a licensed add-on. Make sure your deployment has a valid runtime license entitlement before configuring it.
Watch a Cluster or Namespace
A runtime_inventory subscription tells Anchore Enterprise to automatically pull and analyze every image the agent reports from a given cluster or namespace. New images discovered in a watched namespace are queued like any other analysis job.
Manage cluster and namespace watches with anchorectl inventory watch, or from the Anchore Enterprise GUI. See Subscriptions for the full management surface across the GUI, AnchoreCTL, and the API.
Before watching a busy namespace, confirm that registry credentials for the images it runs are configured in Anchore Enterprise — see Container Registries. Watching a new cluster can queue a large analysis backlog and affect other workloads on the deployment.
Navigate the Kubernetes View
The Kubernetes Inventory view in the Anchore Enterprise GUI is the primary interface for runtime triage. Summary charts at the top break down compliance — compliant, non-compliant, and non-evaluated images — and vulnerabilities by severity, across every cluster the deployment has analyzed. Drilling into a cluster, namespace, node, or pod scopes the charts and the underlying tables to that selection.
The view can be filtered to read by cluster, by image, or by vulnerability:
By cluster. Browse the cluster and namespace hierarchy and see the compliance and vulnerability posture of each scope.
By container image. List the images running in the selected scope and pivot from any image to the same per-image data surfaced elsewhere — vulnerabilities, policy results, SBOM.
By vulnerability. List vulnerabilities found across the selected scope and, for each one, see which images and which deployments are affected. Hover the “seen in X clusters and Y more…” callout to see the full list of locations — the fastest way to answer the “blast radius” question for a new CVE.
Filtering chips at the top of the view (severity, fixability, namespace) refine both the charts and the underlying tables. A severity filter set to “Critical and High” hides every cluster or namespace that has no findings at those levels.
Data Freshness
The Kubernetes Inventory view is built from two independently scheduled pipelines: the in-cluster agent’s reporting interval, and Anchore Enterprise’s analysis queue. Findings appear after both pipelines have run end-to-end, so the view is near-real-time but not synchronous with the cluster.
The deployment-wide inventory time-to-live (how long Anchore Enterprise retains a container record after the agent last reported it) is set on the catalog service — see Runtime Inventory configuration.
Policy and Account Scoping
Policy results on the Kubernetes Inventory view come from each account’s default policy. If you want a Kubernetes-specific policy to gate the view — for example, a tighter ruleset for runtime than for build-time — set up a dedicated account that hosts the watch, switches its default policy to the desired ruleset, and uses the corresponding registry credentials.
Anchore Enterprise gives security and platform teams a consistent, scalable way to enforce software standards across container images, SBOMs, and the apps that contain them — from development through production.
It supports the full compliance lifecycle, from policy authoring to enforcement and audit, including:
Defining policies and rules that govern what is acceptable in a software artifact
Mapping policies to artifacts to control which policy applies to which images or SBOMs
Managing exceptions to handle edge cases and reduce noise
Evaluating compliance against both individual container images and the app versions that aggregate them
Policies Turn Findings into Decisions
Anchore Enterprise uses policies to translate SBOM analysis into actionable compliance outcomes. Once an artifact has been analyzed, a policy evaluates it and produces a Pass or Fail verdict — giving CI/CD pipelines, admission controllers, and security teams a clear, consistent signal to act on.
Policies are reusable and account-scoped, with multiple policies supported per account — making them suitable for enforcing consistent standards across teams, artifact types, and deployment environments.
Define Compliance Policies
Anchore Enterprise provides a flexible policy engine that lets organizations define compliance rules tailored to their security and regulatory requirements. Policies are structured around gates and triggers:
Gates group checks into broad categories such as packages, vulnerabilities, secrets, licenses, file permissions, and Dockerfile configuration. The full gate set is available for container-image rule sets; at this time, SBOM rule sets only support the Vulnerabilities gate.
Triggers define specific conditions to check within a gate, with configurable actions (STOP, WARN, GO).
To accelerate compliance adoption, Anchore Enterprise provides pre-built policy packs mapped to common regulatory frameworks. The Secure policy pack ships with every Anchore Enterprise deployment. The NIST and CIS packs require the Anchore Enforce license entitlement; the FedRAMP and DoD packs require Anchore Enforce plus an additional pack-specific add-on.
Secure — the default policy pack included in every deployment
FedRAMP — validates against FedRAMP Vulnerability Scanning Requirements and NIST 800-53 Rev 5 and NIST 800-190 controls
CIS — based on the CIS Docker Benchmark for container image security
DoD — validates against DISA Image Creation and Deployment Guide and IronBank requirements
For policy CRUD — creating, listing, updating, activating, and deleting policies — see Manage Policies.
Map Policies to Artifacts
Anchore Enterprise uses policy mappings to control which policies and allowlists are applied to which artifacts during evaluation.
You can:
Define mapping rules per artifact type — container images and SBOMs each have their own mapping configuration
Use wildcard rules to apply policies broadly across registries, repositories, or tags
Specify which policy and which allowlists to use for each mapping match
Manage Exceptions
Anchore Enterprise provides mechanisms to suppress or override policy findings without modifying the underlying policy rules. The two mechanisms live together under Exceptions:
Define allowlists that exclude specific findings — such as a CVE — from policy evaluation. Multiple allowlists can be attached to a single policy for granular exception management.
Anchore Enterprise evaluates policies in two scopes — pick the one that matches how your team organizes software. See Evaluate Policy Compliance for the comparison and worked walkthroughs.
App-version-scoped — evaluate a policy against every asset attached to an app version, with results aggregated and a single per-version status returned. This is the v6-native surface for teams that have adopted the apps/versions/assets model.
Image-scoped — evaluate a policy against a single analyzed container image. The image is identified by digest, the result returns a Pass / Fail verdict and the per-trigger findings. This is the long-standing evaluation surface and remains fully supported in v6.
Both modes are integrated into CI/CD pipelines using AnchoreCTL or the REST API to gate deployments on policy outcomes.
Specialized Frameworks
Anchore Enterprise also provides two specialized compliance features that sit alongside the policy engine:
STIG — Security Technical Implementation Guide evaluation against analyzed container images. STIG evaluation requires an additional license entitlement.
SBOM Drift — detects when SBOM content changes between successive builds of the same image tag and surfaces the drift through the tag_drift gate.
10.1 - How It Works
Compliance management in Anchore Enterprise is built around a policy engine that evaluates software artifacts against customizable rules and produces a Pass or Fail verdict. A policy is composed of one or more rule sets, each containing gates and triggers that define specific conditions to check. Policies are bound to artifacts through mappings, and findings can be suppressed by exceptions (allowlists, plus allowed and denied image lists).
The same policy engine evaluates against two scopes — a single analyzed container image, or every asset attached to an app version — letting the same rule set serve both per-artifact gates and release-level aggregation.
Specific topics related to the compliance management framework can be referenced per the links below:
A policy is structured around two levels of detail:
Gates group checks into broad categories such as packages, vulnerabilities, secrets, licenses, file permissions, Dockerfile configuration, and tag drift. The full gate library applies to container-image rule sets; SBOM rule sets currently support the Vulnerabilities gate only.
Triggers define the specific condition to check within a gate, and carry parameters that tune the check — for example, the Vulnerabilities gate’s package trigger accepts a minimum severity and a CVSS comparison.
Each rule fires with one of three actions:
Action
Effect on Evaluation
STOP
The only action that causes a policy evaluation to fail
WARN
Recorded in findings but does not affect the Pass / Fail verdict
GO
Recorded in the audit trail but does not affect the verdict
Rules are evaluated independently — two rules with the same trigger condition but different actions both fire and produce separate findings. Detailed gate, trigger, and parameter reference lives under Policy Gates.
Policy Mappings
Policy mappings bind policies and allowlists to the artifacts they apply to. Each mapping carries selection filters (registry, repository, tag, name, version), and the resolved match identifies which rule sets and allowlists evaluate the artifact.
Container-image mapping rules are evaluated in order and halt on the first match; a catch-all rule using wildcards in every field is recommended at the end of the list so every image is covered. App-version evaluation behaves differently in v6.0 — every asset is evaluated against all SBOM-type rule sets in the bundle, the container-image mappings are not consulted, and sbom_mappings are used only to supply allowlists. Container images and SBOMs each have their own mapping configuration.
Exceptions
Two mechanisms suppress policy findings without modifying the underlying rules. Both live under Exceptions:
Allowlists target individual findings — a specific CVE on a specific package, with optional expiry. When an allowlist item matches a finding, the finding’s action is overridden to GO and the evaluation output records which allowlist item produced the match.
Allowed and denied image lists are system-wide overrides applied before any mapping logic. Images on the denied list fail immediately; images on the allowed list pass immediately. When an image appears on both, the denied list takes precedence.
The Evaluation Pipeline
When an artifact is submitted for evaluation, Anchore Enterprise performs the following steps in order:
Allowed and denied image lists are checked first. These are system-wide overrides applied before any mapping or rule set logic. This step applies only to container images.
A mapping rule is resolved. For standalone container-image evaluation, the artifact’s identity — registry, repository, and tag — is matched against the ordered list of mapping rules, evaluated in order and halting on the first match. In app-version evaluation (v6.0), mappings are not used to select rule sets: every asset is evaluated against all SBOM-type rule sets in the bundle, and sbom_mappings supply only the allowlists.
All specified rule sets are evaluated. Each rule within each rule set is evaluated independently against the artifact’s SBOM. Every triggered rule produces a finding with the action defined in that rule.
Allowlists are applied to findings. Each allowlist item is matched against the set of findings from step 3. A matched finding has its action overridden to GO and is flagged as allowlisted in the evaluation output.
A final action is determined. The engine aggregates all remaining findings into a single verdict:
Final Action
Condition
stop
At least one rule fired with action STOP and was not allowlisted. The evaluation fails.
warn
No STOP results, but at least one WARN. The evaluation passes with warnings.
go
No STOP or WARN results. The evaluation passes cleanly.
Evaluation Scopes
The same policy engine runs against two distinct scopes — pick the one that matches how your team organizes software. Both are covered in Evaluate Policy Compliance.
App-version-scoped — evaluate a policy against every asset attached to an app version, with results aggregated into a single per-version status. This is the v6-native surface, used by anchorectl app version policy status get / policy findings list, the /apps/{id}/versions/{vid}/policy/* endpoints, and the evaluate-policy job that re-runs aggregation on demand.
Image-scoped — evaluate a policy against a single analyzed container image, identified by digest. The result returns a Pass / Fail verdict and the per-trigger findings for that one image. This is the long-standing evaluation surface, used by anchorectl image check, the /images/{digest}/check API, and CI/CD gates that don’t yet model releases as app versions.
Both scopes share the same policies, mappings, and exceptions — there is no separate policy authoring surface for each. The scope only determines what the policy runs against.
Findings as First-Class Records
Every finding produced by an evaluation is a structured record stored in Anchore Enterprise’s database — not an entry buried inside a result envelope. Each finding carries its own UUID, its created_at and updated_at timestamps, the gate and trigger that produced it, the resolved action (including any allowlist override), and the matched allowlist item when one applied.
This shape makes it practical to query findings the same way you query packages or vulnerabilities — see the pivot endpoints documented in Viewing an App Version’s SBOM for the app-version-scoped queries. Findings are exposed directly through /apps/{id}/versions/{vid}/policy/findings/all and /policy/findings/vulnerabilities, and through anchorectl app version policy findings list.
Specialized Frameworks
Anchore Enterprise also provides two specialized features that sit alongside the policy engine:
STIG — Security Technical Implementation Guide evaluation against analyzed container images. STIG runs independently of the standard policy pipeline and requires an additional license entitlement.
SBOM Drift — surfaces package-level additions, removals, and modifications between successive builds of the same image tag. Drift detection runs through the tag_drift gate within the standard policy pipeline rather than as a separate report.
10.2 - Manage Policies
A policy is a JSON document — the policy bundle — that carries everything the policy engine needs to evaluate an artifact: rule sets, mappings, allowlists, and image overrides. Policies are managed through the Anchore Enterprise GUI, AnchoreCTL, or the Anchore API. All three surfaces operate on the same bundle structure.
Anchore Enterprise supports multiple policies per account. Each has a unique name and UUID, and exactly one policy is active at any time — the active policy is used for automated evaluations, notifications, and the Kubernetes admission controller. Inactive policies can still be explicitly requested by policy ID, making it practical to keep historical policies for audit and side-by-side comparison.
Apps can override the account-level active policy by setting policy_id on the app itself, scoping a different policy to all of that app’s versions without affecting other apps in the account. See Anatomy of an App for the per-app field reference.
Anatomy of a Policy Bundle
A bundle is built around five sections plus its identifying metadata. The detail of each section is documented under its own page; this table is the top-level orientation.
Field
Required
Purpose
id
Yes
UUID identifying the bundle
name
Yes
Human-readable name, unique within the account
version
Yes
Bundle schema version
description
No
Free-form description
rule_sets
Yes
Named sets of rules that define the checks to run — see Policy Gates
A bundle authored manually or downloaded from the API can be uploaded as-is through the Anchore Enterprise GUI, AnchoreCTL, or the Anchore API. The full schema and a complete example are in the API browser; search for the Policies tag.
Source mappings as found in v5.x of Anchore Enterprise are deprecated in v6. They have been replaced with filesystem scans via AnchoreCTL, which are represented by SBOM assets within an app version.
Manage Policies in the Anchore Enterprise GUI
The Policies tab is the home for policy management. From there you can browse every policy in the current account, drill into a policy to inspect or edit its rule sets, and trigger the create / copy / activate / download / delete flows.
Create a Policy in the GUI
Click Create New Policy and provide a name and description. Then click Add New Rule Set and choose either Container Images or SBOMs for the artifact type the rule set will evaluate. Configure each rule set under Edit by selecting a gate from the dropdown, choosing a trigger within that gate, supplying any required parameters, and selecting an action (STOP, WARN, or GO). Save the rule set when the rule list looks correct.
For SBOM rule sets, only the Vulnerabilities gate is available. Container-image rule sets support the full gate library.
Edit a Policy in the GUI
From the policy’s detail page, open the Edit action to modify name, description, rule sets, mappings, allowlists, or the allowed and denied image lists. The same field rules apply as on create.
Activate a Policy in the GUI
Activating a policy makes it the default used for automated evaluations across the account. Select Activate on a policy’s row; the previously active policy is automatically marked inactive — only one policy is active at a time. The active policy is highlighted in the list with a green indicator.
Adding a policy does not automatically activate it. New policies become available for explicit evaluation requests but must be activated separately to become the account default.
Copy a Policy in the GUI
To use an existing policy as a starting point for another, choose Copy Policy from the policy’s Tools menu, then give the copy a new name (and optionally a description). The copy inherits all rule sets, mappings, allowlists, and image lists from the original.
Download a Policy in the GUI
Choose Download to JSON from the policy’s Tools menu to save the policy bundle as a JSON file. Use this when transferring a policy between accounts, archiving a snapshot, or hand-editing the bundle for upload.
Delete a Policy in the GUI
Choose Delete Policy from the policy’s Tools menu. The active policy cannot be deleted — to remove it, first mark another policy as active. Rule sets in use by active mappings also cannot be deleted until they have been removed from every associated mapping.
Policy deletion is irreversible. Download the policy first if you need a backup.
Manage Policies with AnchoreCTL
Policy CRUD lives under anchorectl policy. The add and update verbs read a bundle from a JSON file; the rest accept the policy name or its UUID.
List Policies
List every policy in the current account, with a terse one-line-per-policy summary by default:
anchorectl policy list
Add --detail together with a JSON output format to retrieve every policy’s full bundle content in one call:
Update replaces the bundle in full — there is no partial update. To change a single field, retrieve the bundle, edit it locally, and submit the updated file.
Activate a Policy
Make a policy the active default for the account:
anchorectl policy activate strict-policy
The previously active policy is automatically marked inactive. Only one policy is active at a time.
Delete a Policy
Delete a policy by name or UUID:
anchorectl policy delete strict-policy
The active policy cannot be deleted. Activate a different policy first, then delete the one you no longer need.
Manage Policies with the API
Policy CRUD is exposed under /policies — create, list, get, update, and delete operations are all available. The full endpoint inventory, request and response schemas (including the complete bundle schema), and error codes are in the API browser; search for the Policies tag.
A few conventions worth knowing as you call these endpoints:
The bundle uploaded on POST /policies and PUT /policies/{policy_id} is the same JSON shape that AnchoreCTL submits and the GUI emits. There is no separate API-only format.
The detail query parameter on GET /policies controls whether each entry in the list response carries its full bundle content or just metadata.
Activation is set with the active query parameter on PUT /policies/{policy_id} (the update endpoint). Marking a policy active automatically deactivates the previously active one; an active policy cannot be deactivated directly (activate a different policy instead). The AnchoreCTL policy activate command wraps this.
Cross-account requests follow the standard pattern — see Account Scoping.
10.2.1 - Policy Gates
This page is the canonical list of policy gates supported by Anchore Enterprise. Each gate documented here has its own detail page covering its triggers, parameters, and example rules.
A rule inside a policy is built from four pieces:
Gate — the broad category of check (vulnerabilities, dockerfile, licenses, and so on).
Trigger — the specific condition to evaluate within the gate.
Parameters — gate- and trigger-specific values that tune the check.
Action — STOP, WARN, or GO, applied when the trigger fires.
For the broader conceptual model — how rules combine into rule sets, how mappings select which rule sets evaluate an artifact, and where allowlists override the result — see How It Works.
SBOM rule sets support the vulnerabilities gate (and the always utility gate), but not every trigger of the vulnerabilities gate is available in this scope. The supported triggers for SBOM rule sets are:
denylist — fire when a specific CVE is present.
package — fire when a package has a vulnerability matching the configured severity, CVSS, or fix-state criteria.
stale_feed_data(deprecated) — fire when the vulnerability data source has not been updated within a configured time window.
The stale_feed_data trigger is deprecated in v6 and is no longer included in the default policy. Avoid using it in new rule sets.
The remaining vulnerabilities triggers and all other gates apply only to container-image rule sets. To use the full gate library on a release that includes both images and SBOMs, model the release as an app version and let the per-asset mappings pick the appropriate rule set for each asset.
Runtime Gate Inventory
The table above describes the gate library shipped with Anchore Enterprise. To retrieve the gate inventory as implemented by a specific running instance — including any gates added in a later release — call GET /system/policy-spec. The endpoint returns every gate, trigger, parameter, and value type the running instance supports, in the same shape that the policy validator uses.
10.2.1.1 - Gate: always
Introduction
The “always” gate is intended for testing purposes and is advised against actual policy usage. The “always” gate only has one trigger that if it is part of a rule set, the policy evaluation will automatically result with the configured action (in most cases, “STOP”). This is especially useful when users want to test mappings and allowlists because they can use this rule in combination with other rules in a single rule set without having to manually create dedicated policies for running tests.
The gate will always trigger with the configured action if it is included inside an active policy.
Reference: always
Trigger Name
Description
Parameter
Description
Example
always
Fires if present in a policy being evaluated. Useful for things like deny-listing images or testing mappings and allowlists by using this trigger in combination with policy mapping rules.
10.2.1.2 - Gate: ancestry
Introduction
The “ancestry” gate gives users the ability to construct policy rules against an image’s ancestry, specifically the base and ancestor images. This gate becomes useful when a user needs to quickly identify if an image SBOM is not part of an organization’s approved set of base and/or ancestor images.
Base images is referred to the image that a given image was built from. It serves as a template for developers to create a standardized environment on top of which they can build their custom images (often referred to as a “golden” image).
Ancestor images is referred to the chain of images built from other images.
Goal: Fail a policy evaluation if an image is not part of a list of approved base images.
Example rule set configuration in Anchore Enterprise
Gate: ancestry Trigger: allowed base image digest Required Parameters: base digest = “SHA256:abcdef123456” Recommendation (Optional): The image is not derived from an approved base image. Remediation required. Action: STOP
Reference: ancestry
Trigger Name
Description
Parameter
Description
Example
allowed_base_image_digest
Checks to see if base image is approved
base_digest
List of approved base image digests.
sha256:123abc
allowed_base_image_tag
Checks to see if base image is approved
base_tag
List of approved base image tags.
docker.io/nginx:latest
denylist_ancestor_image_digest
Triggers if any of the ancestor images have the provided image digest(s)
ancestor_digest
List of ancestor image digests to check for. Accepts comma separated list of digests.
sha256:123abc
denylist_ancestor_image_tag
Triggers if any of the ancestor images have the provided image tag(s)
ancestor_tag
List of denied image tags to check the ancestry for. Accepts comma separated list of tags.
docker.io/nginx:latest
no_ancestors_analyzed
Checks to see if the image has a known ancestor
10.2.1.3 - Gate: distro
Introduction
The “distro” gate is solely intended to deny an image that is running on a specific distro. This is especially useful if a user wants to create a rule that can quickly discover any image SBOMs containing a specific version of a distro that is denied in their organization.
Example Use-case
Scenario 1
Goal: Create a rule that results in a STOP action for images that are running below Debian version 9.
Example rule set configuration in Anchore Enterprise
Gate: distro Trigger: deny Required Parameters: distro = “debian”, version = “9”, check = “<”
Recommendations (optional): “Image is running on an old version of Debian. Update required.” Action: STOP
Reference: distro
Trigger Name
Description
Parameter
Description
Example
deny
Triggers if the image distro and version match the criteria
distro
Name of the distribution to match
debian
deny
Triggers if the image distro and version match the criteria
version
Version of distribution to compare against
9
deny
Triggers if the image distro and version match the criteria
check
The comparison to use in the evaluation
<
10.2.1.4 - Gate: dockerfile
Introduction
This article reviews the “dockerfile” gate and its triggers. The dockerfile gate allows users to perform checks on the content of the dockerfile or docker history for an image and make policy actions based on the construction of an image, not just its content. This is particularly useful for enforcing best practices or metadata inclusion (e.g. labels) on images.
Anchore Enterprise is either given a dockerfile or infers one from the docker image layer history. There are implications to what data is available and what it means depending on these differing sources, so first, we’ll cover the input data for the gate and how it impacts the triggers and parameters used.
The “dockerfile”
The data that this gate operates on can come from two different sources:
The actual dockerfile used to build an image, as provided by the user at the time of running anchorectl image add <img ref> --dockerfile <filename> or the corresponding API call to: POST /images?dockerfile=
The history from layers as encoded in the image itself (see docker history <img> for this output)
All images have data from history available, but data from the actual dockerfile is only available when a user provides it. This also means that any images analyzed by the tag watcher functionality will not have an actual dockerfile.
The FROM line
In the actual dockerfile, the FROM instruction is preserved and available as used to build the image, however in the history data, the FROM line will always be the very first FROM instruction used to build the image and all of its dependent based image. Thus, for most images, the value in the history will be omitted and Anchore Enterprise will automatically infer a FROM scratch line, which is logically inserted for this gate if the dockerfile/history does not contain an explicit FROM entry.
For example, using the docker.io/jenkins/jenkins image:
FROMopenjdk:8-jdk-stretchRUN apt-get update && apt-get install -y git curl && rm -rf /var/lib/apt/lists/*ARGuser=jenkins
ARGgroup=jenkins
ARGuid=1000ARGgid=1000ARGhttp_port=8080ARGagent_port=50000ARGJENKINS_HOME=/var/jenkins_homeENV JENKINS_HOME $JENKINS_HOMEENV JENKINS_SLAVE_AGENT_PORT ${agent_port}# Jenkins is run with user `jenkins`, uid = 1000# If you bind mount a volume from the host or a data container,# ensure you use the same uidRUN mkdir -p $JENKINS_HOME\
&& chown ${uid}:${gid}$JENKINS_HOME\
&& groupadd -g ${gid}${group}\
&& useradd -d "$JENKINS_HOME" -u ${uid} -g ${gid} -m -s /bin/bash ${user}# Jenkins home directory is a volume, so configuration and build history# can be persisted and survive image upgradesVOLUME$JENKINS_HOME# `/usr/share/jenkins/ref/` contains all reference configuration we want# to set on a fresh new installation. Use it to bundle additional plugins# or config file with your custom jenkins Docker image.RUN mkdir -p /usr/share/jenkins/ref/init.groovy.d# Use tini as subreaper in Docker container to adopt zombie processesARGTINI_VERSION=v0.16.1COPY tini_pub.gpg ${JENKINS_HOME}/tini_pub.gpgRUN curl -fsSL https://github.com/krallin/tini/releases/download/${TINI_VERSION}/tini-static-$(dpkg --print-architecture) -o /sbin/tini \
&& curl -fsSL https://github.com/krallin/tini/releases/download/${TINI_VERSION}/tini-static-$(dpkg --print-architecture).asc -o /sbin/tini.asc \
&& gpg --no-tty --import ${JENKINS_HOME}/tini_pub.gpg \
&& gpg --verify /sbin/tini.asc \
&& rm -rf /sbin/tini.asc /root/.gnupg \
&& chmod +x /sbin/tiniCOPY init.groovy /usr/share/jenkins/ref/init.groovy.d/tcp-slave-agent-port.groovy# jenkins version being bundled in this docker imageARG JENKINS_VERSIONENV JENKINS_VERSION ${JENKINS_VERSION:-2.121.1}# jenkins.war checksum, download will be validated using itARGJENKINS_SHA=5bb075b81a3929ceada4e960049e37df5f15a1e3cfc9dc24d749858e70b48919
# Can be used to customize where jenkins.war get downloaded fromARGJENKINS_URL=https://repo.jenkins-ci.org/public/org/jenkins-ci/main/jenkins-war/${JENKINS_VERSION}/jenkins-war-${JENKINS_VERSION}.war# could use ADD but this one does not check Last-Modified header neither does it allow to control checksum# see https://github.com/docker/docker/issues/8331RUN curl -fsSL ${JENKINS_URL} -o /usr/share/jenkins/jenkins.war \
&& echo "${JENKINS_SHA} /usr/share/jenkins/jenkins.war" | sha256sum -c -ENV JENKINS_UC https://updates.jenkins.ioENVJENKINS_UC_EXPERIMENTAL=https://updates.jenkins.io/experimentalENVJENKINS_INCREMENTALS_REPO_MIRROR=https://repo.jenkins-ci.org/incrementalsRUN chown -R ${user}"$JENKINS_HOME" /usr/share/jenkins/ref# for main web interface:EXPOSE${http_port}# will be used by attached slave agents:EXPOSE${agent_port}ENV COPY_REFERENCE_FILE_LOG $JENKINS_HOME/copy_reference_file.logUSER${user}COPY jenkins-support /usr/local/bin/jenkins-supportCOPY jenkins.sh /usr/local/bin/jenkins.shCOPY tini-shim.sh /bin/tiniENTRYPOINT ["/sbin/tini", "--", "/usr/local/bin/jenkins.sh"]# from a derived Dockerfile, can use `RUN plugins.sh active.txt` to setup /usr/share/jenkins/ref/plugins from a support bundleCOPY plugins.sh /usr/local/bin/plugins.shCOPY install-plugins.sh /usr/local/bin/install-plugins.sh
Anchore Enterprise will detect the history/dockerfile as this, if not explicitly provided (note order is reversed from docker history output, so it reads in same order as actual dockerfile):
NOTE: Anchore Enterprise processes the leading /bin/sh commands, so you do not have to include those in any trigger param config if using the docker history output.
The actual_dockerfile_only Parameter
The actual vs history impacts the semantics of the dockerfile gate’s triggers. To allow explicit control of the differences, most triggers in this gate includes a parameter: actual_dockerfile_only that if set to true or false will ensure the trigger check is only done on the source of data specified. If actual_dockerfile_only = true, then the trigger will evaluate only if an actual dockerfile is available for the image and will skip evaluation if not. If actual_dockerfile_only is false or omitted, then the trigger will run on the actual dockerfile if available, or the history data if the dockerfile was not provided.
Differences in data between Docker History and actual Dockerfile
With Actual Dockerfile:
FROM line is preserved, so the parent tag of the image is easily available
Instruction checks are all against instructions created during the build for that exact image, not any parent images
When the actual_dockerfile_only parameter is set to true, all instructions from the parent image are ignored in policy processing. This may have some unexpected consequences depending on how your images are structured and layered (e.g. golden base images that establish common patterns of volumes, labels, healthchecks)
COPY/ADD instructions will maintain the actual values used
Multistage-builds in that specific dockerfile will be visible with multiple FROM lines in the output
With Docker History data, when no dockerfile is provided:
FROM line is not accurate, and will nearly always default to ‘FROM scratch’
Instructions are processed from all layers in the image
COPY and ADD instructions are transformed into SHAs rather than the actual file path/name used at build-time
Multi-stage builds are not tracked with multiple FROM lines, only the copy operations between the phases
Trigger: instruction
This trigger evaluates instructions found in the “dockerfile”.
Parameters
actual_dockerfile_only (optional): See above
instruction: The dockerfile instruction to check against. One of:
ADD
ARG
COPY
CMD
ENTRYPOINT
ENV
EXPOSE
FROM
HEALTHCHECK
LABEL
MAINTAINER
ONBUILD
USER
RUN
SHELL
STOPSIGNAL
VOLUME
WORKDIR
check: The comparison/evaluation to perform. One of: =, != , exists, not_exists, like, not_like, in, not_in.
value (optional): A string value to compare against, if applicable.
Examples
Ensure an image has a HEALTHCHECK defined in the image (warn if not found).
This trigger processes all USER directives in the dockerfile or history to determine which user will be used to run the container by default (assuming no user is set explicitly at runtime). The detected value is then subject to a allowlist or denylist filter depending on the configured parameters. Typically, this is used for denylisting the root user.
Parameters
actual_dockerfile_only (optional): See above
users: A string with a comma delimited list of username to check for.
type: The type of check to perform. One of: ‘denylist’ or ‘allowlist’. This determines how the value of the ‘users’ parameter is interpreted.
This trigger processes the set of EXPOSE directives in the dockerfile/history to determine the set of ports that are defined to be exposed (since it can span multiple directives). It performs checks on that set to denylist/allowlist them based on parameter settings.
Parameters
actual_dockerfile_only (optional): See above
ports: String of comma delimited port numbers to be checked.
type: The type of check to perform. One of: ‘denylist’ or ‘allowlist’. This determines how the value of the ‘users’ parameter is interpreted.
Examples
Allow only ports 80 and 443. Trigger will fire on any port defined to be exposed that is not 80 or 443.
This trigger allows checks on the way the image was added, firing if the dockerfile was not explicitly provided at analysis time. This is useful in identifying and qualifying other trigger matches.
Parameters
None
Examples
Raise a warning if no dockerfile was provided at analysis time .
Goal: Create a rule that results in a STOP action for username “root” found in an image SBOM’s dockerfile “USER” line.
Example rule set configuration in Anchore Enterprise
Gate: dockerfile Trigger: effective_user Required Parameters: users = “root”, type = “denylist” Recommendations (optional): “The username “root” is found in USER line. Fix required.” Action: STOP
Scenario 2
Goal: Create a rule that results in a WARN action for usernames “nginx” or “jenkins” not found in an image SBOM’s dockerfile “USER” line.
Example rule set configuration in Anchore Enterprise
Triggers if any directives in the list are found to match the described condition in the dockerfile.
instruction
The Dockerfile instruction to check.
from
instruction
Triggers if any directives in the list are found to match the described condition in the dockerfile.
check
The type of check to perform.
=
instruction
Triggers if any directives in the list are found to match the described condition in the dockerfile.
value
The value to check the dockerfile instruction against.
scratch
instruction
Triggers if any directives in the list are found to match the described condition in the dockerfile.
actual_dockerfile_only
Only evaluate against a user-provided dockerfile, skip evaluation on inferred/guessed dockerfiles. Default is False.
true
effective_user
Checks if the effective user matches the provided user names, either as a allowlist or blocklist depending on the type parameter setting.
users
User names to check against as the effective user (last user entry) in the images history.
root,docker
effective_user
Checks if the effective user matches the provided user names, either as a allowlist or blocklist depending on the type parameter setting.
type
How to treat the provided user names.
denylist
exposed_ports
Evaluates the set of ports exposed. Allows configuring allowlist or blocklist behavior. If type=allowlist, then any ports found exposed that are not in the list will cause the trigger to fire. If type=denylist, then any ports exposed that are in the list will cause the trigger to fire.
ports
List of port numbers.
80,8080,8088
exposed_ports
Evaluates the set of ports exposed. Allows configuring allowlist or blocklist behavior. If type=allowlist, then any ports found exposed that are not in the list will cause the trigger to fire. If type=denylist, then any ports exposed that are in the list will cause the trigger to fire.
type
Whether to use port list as a allowlist or denylist.
denylist
exposed_ports
Evaluates the set of ports exposed. Allows configuring allowlist or blocklist behavior. If type=allowlist, then any ports found exposed that are not in the list will cause the trigger to fire. If type=denylist, then any ports exposed that are in the list will cause the trigger to fire.
actual_dockerfile_only
Only evaluate against a user-provided dockerfile, skip evaluation on inferred/guessed dockerfiles. Default is False.
true
no_dockerfile_provided
Triggers if anchore analysis was performed without supplying the actual image Dockerfile.
10.2.1.5 - Gate: files
Introduction
The “files” gate performs checks against the files in an analyzed image SBOM and is useful when users need to create policies that trigger against any matched file content, names and/or attributes.
The “files” gate differs from the “retrieved_files” gate. The “files” gate searches against the files present in an image SBOM whereas the “retrieved_files” gate utilizes Anchore Enterprise’s cataloger capability and checks against files that are provided and stored by the user before analysis.
Example Use-cases
Scenario 1
Goal: Create a rule that results in a STOP action for any file name that contains “.pem”, which may include information such as the public certificate or even an entire certificate chain (public key, private key, and root certificates) of an image SBOM.
Example rule set configuration in Anchore Enterprise
Gate: files Trigger: name match Required Parameters: regex = “.*\.pem” Recommendations (optional): “Filename with “.pem” found - Remediation required.” Action: STOP
Scenario 2
Goal: Create a rule that results in a STOP action for any file that matches against regex string “.*password.*” in an image SBOM.
In order to use this gate, the analyzer_config.yaml file for your Anchore Enterprise deployment must have specific regex strings configured under the content_search section as the rule will only check against regex strings that appear in this list. Please use the optional parameter “regex name” if you want to specify a single string for your policy rule. If this parameter is not configured, then every regex string stored in the content_search section in the analyzer_config.yaml will be checked against.
Example rule set configuration in Anchore Enterprise
Gate: files Trigger: content regex match Optional Parameters: regex name = “ABC” Recommendations (optional): “Regex string “.*password.*” found in file. Fix required.” Action: STOP
analyzer_config.yaml file
Reference: files
Trigger Name
Description
Parameter
Description
Example
content_regex_match
Triggers for each file where the content search analyzer has found a match using configured regexes in the analyzer_config.yaml “content_search” section. If the parameter is set, the trigger will only fire for files that matched the named regex. Refer to your analyzer_config.yaml for the regex values.
regex_name
Regex string that also appears in the FILECHECK_CONTENTMATCH analyzer parameter in analyzer configuration, to limit the check to. If set, will only fire trigger when the specific named regex was found in a file.
.password.
name_match
Triggers if a file exists in the container that has a filename that matches the provided regex. This does have a performance impact on policy evaluation.
regex
Regex to apply to file names for match.
.*.pem
attribute_match
Triggers if a filename exists in the container that has attributes that match those which are provided . This check has a performance impact on policy evaluation.
filename
Filename to check against provided checksum.
/etc/passwd
attribute_match
Triggers if a filename exists in the container that has attributes that match those which are provided . This check has a performance impact on policy evaluation.
checksum_algorithm
Checksum algorithm
sha256
attribute_match
Triggers if a filename exists in the container that has attributes that match those which are provided . This check has a performance impact on policy evaluation.
Triggers if a filename exists in the container that has attributes that match those which are provided . This check has a performance impact on policy evaluation.
checksum_match
Checksum operation to perform.
equals
attribute_match
Triggers if a filename exists in the container that has attributes that match those which are provided . This check has a performance impact on policy evaluation.
mode
File mode of file.
00644
attribute_match
Triggers if a filename exists in the container that has attributes that match those which are provided . This check has a performance impact on policy evaluation.
mode_op
File mode operation to perform.
equals
attribute_match
Triggers if a filename exists in the container that has attributes that match those which are provided . This check has a performance impact on policy evaluation.
skip_missing
If set to true, do not fire this trigger if the file is not present. If set to false, fire this trigger ignoring the other parameter settings.
true
suid_or_guid_set
Fires for each file found to have suid or sgid bit set.
ignore dir
When set to true, the gate will not trigger if found on a directory. The default is false which will include evaluating directories as well as files
true
10.2.1.6 - Gate: image_source_drift
This gate is deprecated in v6.x and is no longer used.
The image_source_drift gate compared the package contents of a built container image against the SBOM of its source repository, surfacing packages added, removed, or modified between the source and the image.
10.2.1.7 - Gate: licenses
Introduction
The “licenses” gate allows users to perform checks against found licenses in an image SBOM and perform different
policy actions with available triggers.
License names are normalized to SPDX format. Please refer to the SPDX License List for more information.
Example Use-case
Scenario 1
Goal: Create a rule that results in a STOP action for any “GNU packages” that are running on General Public License (GPL) version 2 or later.
Example rule set configuration in Anchore Enterprise
Triggers if the evaluated image has a package installed with software distributed under the specified (exact match) license(s).
licenses
List of license names to denylist exactly.
GPLv2+,GPL-3+,BSD-2-clause
denylist_exact_match
Triggers if the evaluated image has a package installed with software distributed under the specified (exact match) license(s).
package_type
Only trigger for specific package type.
all
denylist_partial_match
triggers if the evaluated image has a package installed with software distributed under the specified (substring match) license(s)
licenses
List of strings to do substring match for denylist.
LGPL,BSD
denylist_partial_match
triggers if the evaluated image has a package installed with software distributed under the specified (substring match) license(s)
package_type
Only trigger for specific package type.
all
10.2.1.8 - Gate: malware
Introduction
The “Malware” Policy Gate allows users to apply compliance rules when malware has been detected within an image.
Anchore Enterprise uses ClamAV during image analysis to detect malware. ClamAV is an open-source antivirus toolkit and can be used to detect various kinds of malicious threats on a system. For additional details, please see Malware Scanning.
Please Note: Files in an image which are greater than 2GB will be skipped due to a limitation in ClamAV. Any skipped file will be identified with a Malware Signature as ANCHORE.FILE_SKIPPED.MAX_FILE_SIZE_EXCEEDED.
When performing Malware Scanning on these larger images, please expect an increase in your analysis time.
Reference: malware
Trigger
Description
Parameters
scans
Triggers if the malware scanner has found any matches in the image.
scan_not_run
Triggers if a file was skipped because it exceeded max file size.
Fire on Skipped Files
Example Use-case
Scenario 1
Goal: Create a rule that results in a STOP action if malware is detected on an image SBOM.
Example rule set configuration in Anchore Enterprise
Gate: malware Trigger: scans Action: STOP
10.2.1.9 - Gate: metadata
Introduction
The “metadata” gate provides users a variety of attributes to create policy rules that check against image SBOM metadata. Currently, the following attributes are provided in the “metadata” gate for policy rule creation:
size
architecture
os type
distro
distro version
like distro
layer count
Example Use-case
Scenario 1
Goal: Create a rule that results in a STOP action for an image SBOM containing alpine OS.
Example rule set configuration in Anchore Enterprise
Triggers if a named image metadata value matches the given condition.
attribute
Attribute name to be checked.
size
attribute
Triggers if a named image metadata value matches the given condition.
check
The operation to perform the evaluation.
>
attribute
Triggers if a named image metadata value matches the given condition.
value
Value used in comparison.
1073741824
10.2.1.10 - Gate: packages
Introduction
The “packages” gate allows users to perform checks against the packages discovered in an image SBOM. It provides triggers for requiring specific packages, denylisting unwanted packages, filtering on package metadata, and verifying package integrity against the package database.
Example Use-cases
Scenario 1
Goal: Create a rule that results in a STOP action if libssl packages are not found in an image SBOM.
Example rule set configuration in Anchore Enterprise
Goal: Create a rule that results in a STOP action if libssl-dev packages are found in an image SBOM but running on a version other than 1.1.1-1ubuntu2.1~18.04.23.
Example rule set configuration in Anchore Enterprise
Gate: packages Trigger: metadata Optional Parameters: name = “libssl-dev”, name comparison = “=”, version = “1.1.1-1ubuntu2.1~18.04.23”, version comparison = “!=” Action: STOP
Reference: packages
Trigger Name
Description
Parameter
Description
Example
required_package
Triggers if the specified package and optionally a specific version is not found in the image.
name
Name of package that must be found installed in image.
libssl
required_package
Triggers if the specified package and optionally a specific version is not found in the image.
version
Optional version of package for exact version match.
1.10.3rc3
required_package
Triggers if the specified package and optionally a specific version is not found in the image.
version_match_type
The type of comparison to use for version if a version is provided.
exact
verify
Check package integrity against package db in the image. Triggers for changes or removal or content in all or the selected “dirs” parameter if provided, and can filter type of check with the “check_only” parameter. Requires enable_package_db_load to be enabled. See Enable the Package Database.
only_packages
List of package names to limit verification.
libssl,openssl
verify
Check package integrity against package db in the image. Triggers for changes or removal or content in all or the selected “dirs” parameter if provided, and can filter type of check with the “check_only” parameter. Requires enable_package_db_load to be enabled. See Enable the Package Database.
only_directories
List of directories to limit checks so as to avoid checks on all dir.
/usr,/var/lib
verify
Check package integrity against package db in the image. Triggers for changes or removal or content in all or the selected “dirs” parameter if provided, and can filter type of check with the “check_only” parameter. Requires enable_package_db_load to be enabled. See Enable the Package Database.
check
Check to perform instead of all.
changed
denylist
Triggers if the evaluated image has a package installed that matches the named package optionally with a specific version as well.
name
Package name to denylist.
openssh-server
denylist
Triggers if the evaluated image has a package installed that matches the named package optionally with a specific version as well.
version
Specific version of package to denylist.
1.0.1
denylist
Triggers if the evaluated image has a package installed that matches the named package optionally with a specific version as well.
version comparison
The type of comparison to use for version if a version is provided.
>
metadata
Triggers on a package type comparison.
type
The type of package.
rpm
metadata
Triggers on a package name comparison.
name
The name of the package. Wildcards are supported.
*ssl
metadata
Triggers on a package version comparison.
version
The version of the package. Wildcards are supported.
*fips
Enable the Package Database
The verify trigger requires the package database to be loaded into the policy engine. This setting is disabled by default in newer deployments of Anchore Enterprise, though it was previously enabled by default. Only enable this setting if you intend to use the verify trigger, as loading the package database has a significant performance impact on the database.
You can confirm the current value of this setting from the System -> Configuration screen by searching for “load”.
To enable it, change enable_package_db_load from false to true:
If you re-enable this setting after it has been disabled, any images analyzed while the setting was disabled must be re-analyzed to populate the package database table. If you disable this setting after it was previously enabled, the underlying table must be manually truncated once the setting has been disabled and the services restarted.
10.2.1.11 - Gate: passwd_file
Introduction
The “passwd_file” gate allows users to perform checks against /etc/passwd files with the retrieve_files cataloger. For more information about cataloger scans, please click here.
Example Use-case
Scenario 1
Goal: Create a rule that results in a STOP action for username “foobar” that is found in /etc/passwd in values.yaml file.
In order to use this gate, the values.yaml file for your Anchore Enterprise deployment must have usernames configured for deny listing.
Example rule set configuration in Anchore Enterprise
Triggers if the /etc/passwd file is not present/stored in the evaluated image.
denylist_usernames
Triggers if specified username is found in the /etc/passwd file
user_names
List of usernames that will cause the trigger to fire if found in /etc/passwd.
daemon,ftp
denylist_userids
Triggers if specified user id is found in the /etc/passwd file
user_ids
List of userids (numeric) that will cause the trigger to fire if found in /etc/passwd.
0,1
denylist_groupids
Triggers if specified group id is found in the /etc/passwd file
group_ids
List of groupids (numeric) that will cause the trigger to fire if found in /etc/passwd.
999,20
denylist_shells
Triggers if specified login shell for any user is found in the /etc/passwd file
shells
List of shell commands to denylist.
/bin/bash,/bin/zsh
denylist_full_entry
Triggers if entire specified passwd entry is found in the /etc/passwd file.
entry
Full entry to match in /etc/passwd.
ftp:x:14:50:FTP User:/var/ftp:/sbin/nologin
10.2.1.12 - Gate: retrieved_files
Introduction
The “retrieved_files” gate allows users to check against the content and/or presence of files retrieved at the time of analysis for an image SBOM. The intent of this gate is to allow users to utilize the retrieve_files cataloger in order to create policy rules from a configured file list. However, the usage of this gate depends on running the retrieve_files cataloger which will require more resources and time to perform analysis on the image SBOM. For more information about cataloger scans, please click here.
The “retrieved_files” gate differs from the “files” gate. The “retrieved_files” gate utilizes Anchore Enterprise’s cataloger capability and checks against files that are provided and stored by the user, while the “files” gate checks against the files present in the analyzed image SBOM (ie file content, file names, filesystem attributes)
Example Use-case
Scenario 1
Goal: Create a rule that results in a STOP action if the regex “SSIEnabled” is not found in the content of the file in the path /etc/httpd.conf.
Example rule set configuration in Anchore Enterprise
Triggers if the specified file is not present/stored in the evaluated image.
path
The path of the file to verify has been retrieved during analysis
/etc/httpd.conf
content_regex
Evaluation of regex on retrieved file content
path
The path of the file to verify has been retrieved during analysis
/etc/httpd.conf
content_regex
Evaluation of regex on retrieved file content
check
The type of check to perform with the regex
match
content_regex
Evaluation of regex on retrieved file content
regex
The regex to evaluate against the content of the file
.SSlEnabled.
10.2.1.13 - Gate: secret_scans
Introduction
The “secret_scans” gate allows users to perform checks against secrets and content found in an image SBOM using configured regexes found in the “secret_search” section of the analyzer_config.yaml file.
In order to use this gate effectively, ensure that regexes are properly configured in the analyzer_config.yaml file in the Anchore Enterprise deployment. By default, the following names are made available in the “secret_search” section:
Goal: Create a rule that results in a STOP action for disclosed AWS access key regex strings (that includes “/etc/.*) in an image SBOM.
In order to use this gate, the analyzer_config.yaml file for your Anchore Enterprise deployment must have regexps named and configured.
If none of the optional parameters are used for the policy rule, by default, all regexp_match that are configured in the analyzer_config.yaml file will be checked.*
Example rule set configuration in Anchore Enterprise
Gate: secret scans Trigger: content regex checks Optional Parameters: content regex name = “AWS_ACCESS_KEY”, filename regex = “/etc/.*”, match type = “found” Action: STOP
Reference: secret_scans
Trigger Name
Description
Parameter
Description
Example
content_regex_checks
Triggers if the secret content search analyzer has found any matches with the configured and named regexes. Checks can be configured to trigger if a match is found or is not found (selected using match_type parameter). Matches are filtered by the content_regex_name and filename_regex if they are set. The content_regex_name should be a value from the “secret_search” section of the analyzer_config.yaml.
content_regex_name
Name of content regexps configured in the analyzer that match if found in the image, instead of matching all. Names available by default are: [‘AWS_ACCESS_KEY’, ‘AWS_SECRET_KEY’, ‘PRIV_KEY’, ‘DOCKER_AUTH’, ‘API_KEY’].
AWS_ACCESS_KEY
content_regex_checks
Triggers if the secret content search analyzer has found any matches with the configured and named regexes. Checks can be configured to trigger if a match is found or is not found (selected using match_type parameter). Matches are filtered by the content_regex_name and filename_regex if they are set. The content_regex_name should be a value from the “secret_search” section of the analyzer_config.yaml.
filename_regex
Regexp to filter the content matched files by.
/etc/.*
content_regex_checks
Triggers if the secret content search analyzer has found any matches with the configured and named regexes. Checks can be configured to trigger if a match is found or is not found (selected using match_type parameter). Matches are filtered by the content_regex_name and filename_regex if they are set. The content_regex_name should be a value from the “secret_search” section of the analyzer_config.yaml.
match_type
Set to define the type of match - trigger if match is found (default) or not found.
found
10.2.1.14 - Gate: stig
Introduction
The STIG policy gate is intended to deny an image that does not have at least one companion STIG evaluation stored
alongside of it. The STIG evaluation can be generated by using an AnchoreCTL workflow that will generate and upload
it to your Anchore Enterprise deployment.
For more information on the Anchore STIG feature, please see the Anchore STIG documentation.
Example Use-case
Scenario 1
Goal: Create a rule that results in a STOP action for images that do not contain a STIG evaluation.
Example rule set configuration in Anchore Enterprise
Gate: stig Trigger: no stig evaluations available Required Parameters: n/a Recommendations (optional): “Perform STIG evaluation on image” Action: STOP
Scenario 2
Goal: Create a rule that results in a STOP action for images where the uploaded STIG evaluations is older than 7 days.
Example rule set configuration in Anchore Enterprise
Gate: stig Trigger: stig evaluations outdated Required Parameters: max days since stig evaluation = “7” Recommendations (optional): “Perform new STIG evaluation on image” Action: STOP
Reference: stig
Trigger Name
Description
Parameter
Description
Example
no stig evaluations available
Triggers if Anchore Enterprise does not have STIG evaluations for this image
n/a
n/a
n/a
stig evaluations outdated
Triggers if all of the uploaded STIG evaluations are outdated
max days since stig evaluation
The maximum age (in days) for any STIG evaluation - an image won’t trigger as long as it has at least one STIG evaluation within this window.
7
10.2.1.15 - Gate: tag_drift
Introduction
If evaluating by image tag, the “tag_drift” gate allows users to perform checks against packages that have been changed (added, removed, modified) on an image SBOM from the tag’s previous image SBOM.
Example Use-case
Scenario 1
Goal: Create a rule that results in a STOP action for any packages that have been modified in an evaluated image tag’s SBOM from the tag’s previous evaluation results.
Example rule set configuration in Anchore Enterprise
Gate: tag drift Trigger: packages modified Action: STOP
Reference: tag_drift
Gate: Tag Drift
Compares the SBOM from the evaluated image’s tag and the tag’s previous image, if found. Provides triggers to detect packages added, removed or modified.
Trigger Name
Description
Parameter
Description
Example
packages_added
Checks to see if any packages have been added.
package_type
Package type to filter for only specific types. If omitted, then all types are evaluated.
apk
packages_removed
Checks to see if any packages have been removed.
package_type
Package type to filter for only specific types. If omitted, then all types are evaluated.
apk
packages_modified
Checks to see if any packages have been modified.
package_type
Package type to filter for only specific types. If omitted, then all types are evaluated.
apk
10.2.1.16 - Gate: vulnerabilities
Introduction
The “vulnerabilities” gate provides users the ability to use either a single or combination of triggers and attributes that match against vulnerability metadata to create policies for the vulnerabilities discovered in an image SBOM.
Currently, only the following triggers are available for SBOM rule sets:
Denylist
Package
Stale Feed Data (deprecated in v6)
Example Use-cases
Scenario 1
Goal: Create a rule that results in a STOP action for every critical vulnerability.
Example rule set configuration in Anchore Enterprise
Gate: vulnerabilities
Trigger: package
Required Parameters: package type = “all”
Optional Parameters: severity comparison = “=”, severity = “critical”
Recommendations (optional): “Remediation is required for critical vulnerabilities.”
Action: STOP
Scenario 2
Goal: Create a rule that results in a STOP action for every vulnerability that is a part of CISA’s KEV list.
Example rule set configuration in Anchore Enterprise
Gate: vulnerabilities
Trigger: kev list
Recommendations (optional): “This vulnerability is part of CISA’s Known Exploited Vulnerability (KEV) catalogue. Remediation is required.”
Action: STOP
Scenario 3
Goal: Create a rule that results in a WARN action for every critical vulnerability with a fix that will not be addressed by a vendor.
Example rule set configuration in Anchore Enterprise
Gate: vulnerabilities
Trigger: package
Required Parameters: package type = “all”
Optional Parameters: severity comparison = “=”, severity = “critical”, vendor only = “false”
Recommendations (optional): “Even though this is a critical vulnerability, the vendor indicates that a fix will not be addressed.”
Action: WARN
Reference: vulnerabilities
The missing annotation and annotation status parameters on the package trigger are available only on image rule sets. SBOM rule sets do not expose annotation-status filtering at the policy layer — use the search API for app-version-scoped annotation filtering. This capability will be coming in a future release.
Trigger Name
Description
Parameter
Description
Example
package
Triggers if a found vulnerability in an image meets the comparison criteria.
package_type
Only trigger for specific package type.
all
package
Triggers if a found vulnerability in an image meets the comparison criteria.
severity_comparison
The type of comparison to perform for severity evaluation.
>
package
Triggers if a found vulnerability in an image meets the comparison criteria.
severity
Severity to compare against.
high
package
Triggers if a found vulnerability in an image meets the comparison criteria.
cvss_v3_base_score_comparison
The type of comparison to perform for CVSS v3 base score evaluation.
>
package
Triggers if a found vulnerability in an image meets the comparison criteria.
cvss_v3_base_score
CVSS v3 base score to compare against.
None
package
Triggers if a found vulnerability in an image meets the comparison criteria.
cvss_v3_exploitability_score_comparison
The type of comparison to perform for CVSS v3 exploitability sub score evaluation.
>
package
Triggers if a found vulnerability in an image meets the comparison criteria.
cvss_v3_exploitability_score
CVSS v3 exploitability sub score to compare against.
None
package
Triggers if a found vulnerability in an image meets the comparison criteria.
cvss_v3_impact_score_comparison
The type of comparison to perform for CVSS v3 impact sub score evaluation.
>
package
Triggers if a found vulnerability in an image meets the comparison criteria.
cvss_v3_impact_score
CVSS v3 impact sub score to compare against.
None
package
Triggers if a found vulnerability in an image meets the comparison criteria.
fix_available
If present, the fix availability for the vulnerability record must match the value of this parameter.
true
package
Triggers if a found vulnerability in an image meets the comparison criteria.
vendor_only
If True, an available fix for this CVE must not be explicitly marked as wont be addressed by the vendor
true
package
Triggers if a found vulnerability in an image meets the comparison criteria.
max_days_since_creation
A grace period, in days, for a vulnerability match to be present after which the vulnerability is a policy violation. Uses the date the match was first found for the given image.
7
package
Triggers if a found vulnerability in an image meets the comparison criteria.
max_days_since_fix
If provided (only evaluated when fix_available option is also set to true), the fix first observed time must be older than the days provided, to trigger. Please note that days since fix begins when your Anchore Enterprise Deployment first sees there is a fix available.
30
package
Triggers if a found vulnerability in an image meets the comparison criteria.
vendor_cvss_v3_base_score_comparison
The type of comparison to perform for vendor specified CVSS v3 base score evaluation.
>
package
Triggers if a found vulnerability in an image meets the comparison criteria.
vendor_cvss_v3_base_score
Vendor CVSS v3 base score to compare against.
None
package
Triggers if a found vulnerability in an image meets the comparison criteria.
vendor_cvss_v3_exploitability_score_comparison
The type of comparison to perform for vendor specified CVSS v3 exploitability sub score evaluation.
>
package
Triggers if a found vulnerability in an image meets the comparison criteria.
vendor_cvss_v3_exploitability_score
Vendor CVSS v3 exploitability sub score to compare against.
None
package
Triggers if a found vulnerability in an image meets the comparison criteria.
vendor_cvss_v3_impact_score_comparison
The type of comparison to perform for vendor specified CVSS v3 impact sub score evaluation.
>
package
Triggers if a found vulnerability in an image meets the comparison criteria.
vendor_cvss_v3_impact_score
Vendor CVSS v3 impact sub score to compare against.
None
package
Triggers if a found vulnerability in an image meets the comparison criteria.
package_path_exclude
The regex to evaluate against the package path to exclude vulnerabilities
.test.jar
package
Triggers if a found vulnerability in an image meets the comparison criteria.
inherited_from_base
If true, only show vulns inherited from the base, if false than only show vulns not inherited from the base. Don’t specify to include vulns from the base image and the current image. See Base and Parent Images for more details.
True
package
Triggers if a found vulnerability in an image meets the comparison criteria.
epss score
The EPSS score to compare against.
0.25
package
Triggers if a found vulnerability in an image meets the comparison criteria.
epss_score_comparison
The type of comparison to perform for EPSS base score evaluation.
>
package
Triggers if a found vulnerability in an image meets the comparison criteria.
epss percentile
The EPSS percentile to compare against.
87
package
Triggers if a found vulnerability in an image meets the comparison criteria.
epss percentile comparison
The type of comparison to perform for EPSS percentile evaluation.
>
package
Triggers if a found vulnerability in an image meets the comparison criteria.
known exploited vulnerability
If True, only trigger for vulnerabilities that are in the CISA KEV list (Known Exploited Vulnerability).
True
package
Triggers if a found vulnerability in an image meets the comparison criteria.
missing annotation
If true, only show vulnerabilities that are not annotated. Only available on image rule sets — not on SBOM rule sets.
True
package
Triggers if a found vulnerability in an image meets the comparison criteria.
annotation status
Comma-separated list of annotation statuses to filter vulnerabilities. Only available on image rule sets — not on SBOM rule sets.
affected
denylist
Triggers if any of a list of specified vulnerabilities has been detected in the image.
vulnerability_ids
List of vulnerability IDs, will cause the trigger to fire if any are detected.
CVE-2019-1234
denylist
Triggers if any of a list of specified vulnerabilities has been detected in the image.
vendor_only
If set to True, discard matches against this vulnerability if vendor has marked as will not fix in the vulnerability record.
True
stale_feed_data
Deprecated for SBOM rule sets in v6. Triggers if the CVE data is older than the window specified by the parameter MAXAGE (unit is number of days).
max_days_since_sync
Fire the trigger if the last sync was more than this number of days ago.
10
vulnerability_data_unavailable
Triggers if vulnerability data is unavailable for the image’s distro packages such as rpms or dpkg. Non-OS packages like npms and java are not considered in this evaluation
None
None
None
10.2.2 - Policy Mappings
Source mappings as found in v5.x of Anchore Enterprise are deprecated in v6.
Policy mappings bind rule sets and allowlists to the artifacts they evaluate. When an artifact is checked against a policy, the mapping section of the bundle is what decides which rule sets to run and which allowlists to apply, based on the artifact’s identity.
Each artifact type — container images and SBOMs — has its own mapping configuration inside the policy bundle. Mappings are evaluated in order; the first match wins; everything else in the list is ignored for that artifact.
A typical bundle ends with a catch-all mapping that uses wildcards in every selection field, so every artifact gets matched against at least one rule set. Without a catch-all, an artifact that matches no specific mapping is treated as unmapped.
Mapping Selection Fields
The two mapping types match on different artifact attributes, but share the same set of action fields — the rule sets and allowlists the mapping applies.
Container Image Mappings
Field
Purpose
name
Human-readable label for the mapping
registry
Registry hostname to match. Wildcards supported; * matches any registry
repository
Repository name including namespace. Wildcards supported; partial matches like web*/* work
image
Tag, digest, or image ID. type is one of tag, digest, or id; value is the matching string, wildcards supported
rule_set_ids
The container-image rule sets that evaluate matching images
allowlist_ids
The allowlists applied to the evaluation results
A worked example: an image at registry.example.com/anchore/webapi:latest matches a mapping with registry = registry.example.com, repository = anchore/web*, and image.value = *.
SBOM Mappings
Field
Purpose
name
Human-readable label for the mapping
sbom_name
Name of the SBOM to match. Ignored in v6.0 — see the note below
sbom_version
Version string to match. Ignored in v6.0 — see the note below
rule_set_ids
The SBOM rule sets that evaluate matching SBOMs
allowlist_ids
The allowlists applied to the evaluation results
App Version policy evaluation uses all SBOM rules and ignores SBOM mapping selectors in v6.0. When a policy is evaluated against an app version, every asset in the version — container images and SBOMs alike — is evaluated against all SBOM-type rule sets in the policy bundle, whether or not a rule set is referenced by an SBOM mapping. The container-image mappings list is not used at all. SBOM mappings are consulted only for their allowlists: every allowlist referenced by any SBOM mapping is applied to the results. The sbom_name and sbom_version selectors are completely ignored.
If you need different rule sets to apply to different applications, set a specific policy on each Application (its policy_id) rather than relying on SBOM mappings to differentiate them.
SBOM rule sets support a limited gate library — see Policy Gates for the per-rule-set-type availability.
Order of Evaluation
Container-image mappings within the mappings list are evaluated top-to-bottom and halt on the first match. This means:
Order matters. A specific mapping placed below a wildcard mapping will never fire.
A catch-all should always be last. Putting wildcards (*) in every selection field at the bottom of the list guarantees nothing slips through.
Image and SBOM mappings are independent. Container images consult the mappings list only; SBOMs consult the sbom_mappings list only. An image’s mapping order has no effect on what an SBOM matches.
SBOM mappings are not used to select rule sets in v6.0. During app-version evaluation, all SBOM-type rule sets in the bundle are applied regardless of mappings; sbom_mappings are consulted only for their allowlists, and the sbom_name / sbom_version selectors are ignored. See SBOM Mappings above.
The allowed and denied image lists are applied before mappings. An image on the denied list fails immediately regardless of which mapping it would otherwise have matched. See Allowed and Denied Images.
Manage Mappings in the Anchore Enterprise GUI
Mappings live on the Mappings tab of the policy editor, with separate panels for container-image and SBOM mappings. Each panel shows the existing mappings in order, with controls to add, edit, reorder, or delete entries.
Add a Mapping in the GUI
From the relevant panel, click Add Mapping (or the prompt that appears when the panel is empty). Provide a name, the rule sets the mapping should apply, optional allowlists, and the selection fields for the artifact type (registry / repository / tag for images; name / version for SBOMs). When more than one mapping exists, a Position field also appears so the new mapping can be placed at the right point in the evaluation order.
Reorder, Edit, or Delete a Mapping
Use the row actions on each mapping to edit, reorder, or delete it. Because order matters, the reorder action carries the most operational weight — moving a wildcard mapping above a specific one effectively disables the specific one.
Manage Mappings with AnchoreCTL
Mappings live inside the policy bundle JSON. There is no dedicated anchorectl mapping command — to change a policy’s mappings, retrieve the bundle, edit the mappings and sbom_mappings arrays, and submit the updated bundle through anchorectl policy update. The full CRUD workflow is documented under Manage Policies.
A minimal pair of bundle excerpts — one image mapping and one SBOM mapping, each terminated by a catch-all:
The mappings and sbom_mappings arrays are part of the Policy schema and are created and updated through the same POST /policies and PUT /policies/{policy_id} endpoints as the rest of the bundle. The full schema for each mapping type, including every selection field and allowed value, is in the API browser; search for the Policies tag.
10.2.3 - Policy Packs
Policy packs are pre-built policies that map to common regulatory frameworks. Each pack ships as a complete bundle — rule sets, mappings, and allowlists — ready to import, customize, and activate against your account.
The Secure pack ships with every Anchore Enterprise deployment. The remaining packs require additional license entitlements:
Australian Signals Directorate (ASD) Essential Eight, Maturity Levels 1–3
Anchore Enforce
The NIST SSDF sub-pack covers the Secure Software Development Framework (NIST SP 800-218); see the NIST page for how it relates to the broader NIST pack.
How Packs Are Used
Each pack page covers the same workflow: download the bundle, import it into Anchore Enterprise, activate it, and adjust its mappings or allowlists for your environment. The mechanics — anchorectl policy add, the GUI’s Import action, and the POST /policies endpoint — are the same as for any policy. See Manage Policies for the general CRUD workflow.
Packs are a starting point, not a final shape. Most teams customize the pack they import — adjusting mappings to scope the pack to specific registries or repositories, attaching allowlists for known false positives, or layering additional rule sets on top — before activating the result as the account’s default policy.
10.2.3.1 - FedRAMP
Current FedRAMP policy pack version: Anchore FedRAMP v5 Checks v20250101
The FedRAMP pack requires the Anchore Enforce entitlement plus the FedRAMP add-on. Contact Anchore Customer Success to request the latest version.
Introduction
FedRAMP (Federal Risk and Authorization Management Program) is a standardized approach for assessing, authorizing, and monitoring cloud service providers (CSPs) that provide service to federal agencies. Through a rigorous and comprehensive process, FedRAMP ensures that CSPs meet security standards by providing a baseline set of security controls to enhance the overall security of federal information systems.
Anchore Enterprise’s FedRAMP policy validates whether container images are compliant with the FedRAMP Vulnerability Scanning Requirements, and validates them against the FedRAMP controls specified in NIST 800-53 Rev 5 and NIST 800-190. The policy checks only the specification requirements relevant to software supply chain security.
Anchore Enterprise’s FedRAMP policy checks for the following specifications:
AC-6(10) ACCESS CONTROL: Prevent Non-Privileged Users from Executing Privileged Functions
CM-2(2), CM-3(1), CM-6 CONFIGURATION MANAGEMENT: Baseline Configuration | Configure Systems and Components for High-risk Areas
IA-05(7) IDENTIFICATION AND AUTHENTICATION: Authenticator Management | No Embedded Unencrypted Static Authenticators
RA-5, SI-02(2) RISK ASSESSMENT: Vulnerability Monitoring and Scanning
SC-5 SYSTEM AND COMMUNICATIONS PROTECTION: Denial-of-Service Protection
Using the Pack
Import the pack like any other policy — see Manage Policies for the GUI, AnchoreCTL, and API workflows. Once imported, scope it to the registries and repositories it should apply to through Policy Mappings, then activate it as the account’s default policy.
Configuring Rule Sets
Some control specifications need configuration for your environment. The control specifications are represented by rule sets, edited from the policy’s Edit action in the Anchore Enterprise GUI (see Manage Policies).
The following rule sets must be configured before using the FedRAMP policy:
CM-2(2), CM-3(1), CM-6 CONFIGURATION MANAGEMENT: Baseline Configuration | Configure Systems and Components for High-risk Areas
Current NIST 800-53 and 800-190 policy pack versions: Anchore NIST 800-53 v20251201 and Anchore NIST 800-190 v20250101
The NIST packs require the Anchore Enforce entitlement. Contact Anchore Customer Success to request the latest versions.
Introduction
The National Institute of Standards and Technology (NIST) is a non-regulatory agency of the U.S. Commerce Department that provides industry standards and guidelines to help federal agencies meet requirements set by the Federal Information Security Management Act (FISMA).
Anchore Enterprise provides two NIST policies:
NIST 800-53 — a catalog of security and privacy controls for the U.S. Federal Government. These controls are also the foundation of FedRAMP, the Joint Special Access Program (SAP) Implementation Guide (JSIG), and Intelligence Community Directive (ICD) 503. Anchore helps security teams meet the subset of these controls that can be evaluated against container and SBOM content.
NIST 800-190 — the Application Container Security Guide, which describes security concerns with container technologies and recommendations to address them across the container lifecycle.
Anchore Enterprise assesses for the following controls:
Control Families
NIST 800-53 Control
Anchore Role
Access Control (AC)
AC-6(10) Least Privilege
Validate containers are not running as root
Configuration Management (CM)
CM-7(1b) Network Ports
Check for allowed ports that can be exposed & which ports cannot be exposed
Configuration Management (CM)
CM-8 System Component Inventory
Generate an SBOM to understand all components within source code and containers
Identification and Authentication (IA)
IA-5(7) Authenticator Management
Validate that there are no embedded unencrypted static authenticators/passwords
Risk Assessment (RA)
RA-5 Vulnerability Monitoring & Scanning
Vulnerability scans of both containers and source code
System and Information Integrity (SI)
SI-3 Malicious Code Protection
Scan source and container images for malware
Secure Communications (SC)
SC-5 Denial of Service Protection
HEALTHCHECK instruction within the Dockerfile
Supply Chain (SR)
SR-4(4) Provenance
Only trusted registries shall be used for container images
NIST 800-190
Anchore Enterprise checks for the following control specifications in the NIST 800-190 policy:
Countermeasures
NIST 800-190 Reference
Anchore Role
Image
4.1.1 Image Vulnerabilities
Leverage policies to continuously detect image vulnerabilities sourced from the CVE database and KEV list. The policy can be defined with something as extreme as no known vulnerabilities allowed, down to only if a critical vulnerability is on the KEV list. The date of the vulnerability database is also crucial, especially in an air-gapped environment, which is part of this policy
Image
4.1.2 Image Configuration Defects
Assess images and source code for specific configuration requirements as set by organizational policy
Image
4.1.3 Embedded Malware
Images and source code are scanned for malware using up-to-date anti-virus definitions
Image
4.1.4 Embedded Clear Text Secrets
Scan container images for clear text passwords, API keys, and private keys
Image
4.1.5 Use of Untrusted Images
Policy as code is used to ensure that containers are built only using trusted registries, repositories, and tags
Container
4.4.1 Vulnerabilities within the runtime software
Runtime containers can be scanned both in CI and via Kubernetes Runtime Inventory, ensuring vulnerabilities are scanned and mitigated according to organizational requirements
Container
4.4.2 Unbounded network access from containers
Evaluate containers to ensure only authorized ports are open
Container
4.4.3 Insecure container runtime configurations
Ensure the container is not running as the root user
Using the Pack
Import the pack like any other policy — see Manage Policies for the GUI, AnchoreCTL, and API workflows. Once imported, scope it to the registries and repositories it should apply to through Policy Mappings, then activate it as the account’s default policy.
Configuring Rule Sets
Some control specifications need configuration for your environment. The control specifications are represented by rule sets, edited from the policy’s Edit action in the Anchore Enterprise GUI (see Manage Policies).
The following rule sets must be configured before using the NIST 800-53 policy:
CM-6(b) Confidential Data Checks
CM-7(1b) Network Port Exposure Checks
CM-7(a) Container Image Build Content Checks
10.2.3.2.1 - SSDF
In February 2021, The National Institute of Standards and Technology (NIST) created NIST SP 800-218, otherwise known as Secure Software Development Framework (SSDF), in response to a new executive order mandated by the federal government.
SSDF provides a comprehensive set of guidelines aimed at integrating security into the software development lifecycle, thereby enhancing the security posture of software products from inception to deployment. To verify and validate that organizations meet the controls needed to be SSDF compliant, CISA created an official SSDF Attestation Form that allows organizations to verify and attest that they adhere to the SSDF guidelines and comply with a subset of security controls.
Purpose
Anchore provides a downloadable document that serves as an evidence attachment for the SSDF Attestation Form. The document makes the assumption Anchore Enterprise is used in the organization’s environment and is configured to scan the software that is in scope for the SSDF Attestation Form.
The SSDF Attestation Form consists of three sections that must be completed. Sections I and II cover organization-specific details, whereas Section III lists requirements against various security controls. The intent of this document is to provide guidance for first time applicants and help organizations save time collecting evidence required for Section III of the SSDF Attestation Form.
Download
Detailed instructions to complete the form can be found on page 1. This document uses the official SSDF Attestation Form as its base template. Once completed, the document can be directly attached to an SSDF Attestation Form submission. Click below to obtain the form:
Additional Resources
SSDF Attestation 101: A practical guide for Software Producers - Download eBook
Using the Common Form for SSDF Attestation: What Software Producers Need to Know - Read blog
Automate NIST compliance and SSDF attestation with Anchore Enterprise - Learn more
The Center for Internet Security (CIS) provides prescriptive configuration recommendations for a variety of software vendors. Anchore Enterprise’s CIS policy pack is based on the CIS Docker 1.8 Benchmark and validates a subset of security and compliance checks against container images.
The CIS pack requires the Anchore Enforce entitlement. Contact Anchore Customer Success to request the latest version.
Controls
Anchore Enterprise checks for the following control specifications in the CIS policy:
4.1 Ensure that a user for the container has been created
4.2 Ensure that containers use only trusted base
4.3 Ensure that unnecessary packages are not installed in the container
4.4 Ensure images are scanned and rebuilt to include security patches
4.6 Ensure that HEALTHCHECK instructions have been added to container images
4.7 Ensure update instructions are not used alone in Dockerfiles
4.8 Ensure setuid and setgid permissions are removed
4.9 Ensure that COPY is used instead of ADD in Dockerfiles
4.10 Ensure secrets are not stored in Dockerfiles
4.11 Ensure only verified packages are installed
5.8 Ensure privileged ports are not mapped within containers
Using the Pack
Import the pack like any other policy — see Manage Policies for the GUI, AnchoreCTL, and API workflows. Once imported, scope it to the registries and repositories it should apply to through Policy Mappings, then activate it as the account’s default policy.
Configuring Rule Sets
Some control specifications need configuration for your environment. The control specifications are represented by rule sets, edited from the policy’s Edit action in the Anchore Enterprise GUI (see Manage Policies).
The following rule sets must be configured before using the CIS policy:
4.2 Ensure that containers use only trusted base
4.3 Ensure that unnecessary packages are not installed in the container
5.8 Ensure privileged ports are not mapped within containers
10.2.3.4 - DoD
Current IronBank policy pack version: Anchore DoD Iron Bank v20250101
Current DISA policy pack version: Anchore DISA Image Creation and Hardening Guide v20250101
The DoD packs require the Anchore Enforce entitlement plus the DoD add-on. Contact Anchore Customer Success to request the latest versions.
Introduction
Anchore Enterprise provides two DoD policies:
DISA Image Creation and Deployment Guide — provided by the Defense Information Systems Agency (DISA), the agency that supplies IT and communications support to the U.S. government and federal organizations. This policy provides security and compliance checks that align with specific NIST 800-53 and NIST 800-190 controls as described in the DoD Container Image Creation and Deployment Guide.
IronBank — validates images against DoD security and compliance requirements in alignment with U.S. Air Force security standards at Platform One and IronBank, written in accordance with DoD Enterprise DevSecOps Reference Design documentation.
DISA
Anchore Enterprise checks for the following control specifications in the DISA policy:
AC-6(10) Container Image Must Have Permissions Removed from Executables that Allow a User to Execute Software at Higher Privileges
CM-6(b) Confidential Data Checks
CM-7(1b) Network Port Exposure Checks
CM-7(a) Container Image Build Content Checks
IA-5(2a) Base Image Checks
IA-5(7) Embedded Credentials
RA-5 Software Vulnerability Checks
SC-5 Image Checks
SC-8(2) Base Image Checks
SI-2(6) Image Software Update/Layer Checks
IronBank
The IronBank policy includes checks across the following areas:
Import the pack like any other policy — see Manage Policies for the GUI, AnchoreCTL, and API workflows. Once imported, scope it to the registries and repositories it should apply to through Policy Mappings, then activate it as the account’s default policy.
Configuring Rule Sets
The IronBank policy does not require rule set configuration. The DISA policy, however, requires configuration for certain specifications — the control specifications are represented by rule sets, edited from the policy’s Edit action in the Anchore Enterprise GUI (see Manage Policies).
The following rule sets must be configured before using the DISA policy:
CM-6(b) Confidential Data Checks
CM-7(1b) Network Port Exposure Checks
CM-7(a) Container Image Build Content Checks
10.2.3.5 - Secure
The default Secure policy pack comes included (and enabled) in every fresh deployment of Anchore Enterprise.
Current Secure policy pack version: Anchore Enterprise - Secure v20250101
Introduction
Anchore Enterprise’s default Secure policy pack includes standard vulnerability and system-level checks and can be used against an image SBOM for policy compliance based on the policy actions configured in each rule. All the rules that are configured by default can (and should) be adjusted according to an organization’s security policy.
Anchore Enterprise checks for the following control specifications in the Secure policy:
Feed Data not available Fail if feed data is unavailable
Warn on low and moderate with fixes Warn when there are low and medium severity vulnerabilities found that also
have a fix present (Available for Containers, Sources, and SBOMs)
Warn on week old Important Warn when there are important severity vulnerabilities found that are more than a week old (Available for Containers, Sources, and SBOMs)
“Important” indicates the severity of a vulnerability. By default, it is set to “High” but this can be configured in the policy rule set
Fail on criticals Fail when there are critical severity vulnerabilities present (Available for Containers, Sources, and SBOMs)
10.2.3.6 - CMMC
The CMMC policy pack maps the controls of the Cybersecurity Maturity Model Certification (CMMC) to checks that the Anchore Enterprise policy engine can evaluate against container images. The pack is grounded in NIST SP 800-171r3, the security-requirement publication that CMMC uses as its control set, and ships as a single bundle ready to import as a policy.
What’s in the Pack
Pack name: Anchore CMMC — NIST 800-171r3
Frameworks covered: CMMC compliance via NIST 800-171r3 controls
Artifact coverage: container images and SBOMs. The pack ships rule sets for both, plus the mappings that bind each rule set to its artifact type.
Rule set organization: rule sets are named by NIST 800-171r3 control identifier (for example 03.01.07 — Least Privilege), so the mapping from a bundle finding back to its underlying compliance control is direct.
The pack maps the 800-171r3 controls that are reachable from SBOM and image content into rule sets the policy engine can evaluate. Controls that depend on organizational process or physical environment — rather than artifact content — are out of scope for a container-image or SBOM policy and are not represented in the bundle.
How to Use the Pack
Import the pack like any other policy — see Manage Policies for the GUI, AnchoreCTL, and API workflows. Once imported, scope it to the registries and repositories it should apply to through Policy Mappings, and attach any allowlists you need before activating it as the account’s default policy.
The CMMC pack is intended as a starting point. Most teams customize mappings, attach allowlists for accepted risks, or layer additional rule sets on top before activating the pack against production registries.
10.2.3.7 - ASD Essential 8
The ASD Essential 8 policy pack maps the Australian Signals Directorate’s Essential Eight mitigation strategies to checks that the Anchore Enterprise policy engine can evaluate against container images. The pack covers Maturity Levels 1 through 3 and ships as a single bundle ready to import as a policy.
Artifact coverage: container images and SBOMs. The pack ships rule sets for both, plus the mappings that bind each rule set to its artifact type.
Rule set organization: rule sets are named by Essential Eight control identifier (for example Patch OS ISM-1876), covering the subset of mitigation strategies that are reachable from artifact content.
The pack maps the Essential Eight controls that depend on artifact content — patching status, package version currency, configuration of distributed software — into rule sets the engine can evaluate. Controls that depend on organizational process, network configuration, or runtime posture are out of scope for a container-image or SBOM policy and are not represented in the bundle.
How to Use the Pack
Import the pack like any other policy — see Manage Policies for the GUI, AnchoreCTL, and API workflows. Once imported, scope it to the registries and repositories it should apply to through Policy Mappings, and attach any allowlists you need before activating it as the account’s default policy.
The ASD Essential 8 pack is intended as a starting point. Most teams customize mappings, attach allowlists for accepted risks, or layer additional rule sets on top before activating the pack against production registries.
10.3 - Manage Exceptions
Exceptions suppress or override policy findings without modifying the underlying rule sets. Anchore Enterprise provides two distinct mechanisms — pick the one that matches the scope of the override you want.
When to Use Which
The two mechanisms differ in what they target and when they are evaluated.
Whole images, identified by name, image ID, or digest
Image only — image mappings
Before any mapping or rule logic runs
Unconditionally trusting a base image, blocking an image known to be unfit for production
Both mechanisms record their action in the evaluation output, so a finding that was allowlisted or an image that was denied is still visible in the audit trail — the override is transparent, not silent.
How Exceptions Fit Into a Policy
Both allowlists and the allowed and denied image lists are stored inside the policy bundle, alongside rule sets and mappings. See Anatomy of a Policy Bundle for where each lives in the JSON structure.
Allowlists are referenced by mappings — when a mapping rule matches an artifact, it identifies which rule sets evaluate the artifact and which allowlists are applied to the resulting findings. The allowed and denied image lists are global to the bundle and are checked before any mapping is resolved.
The evaluation pipeline walks through the full order — including where each exception mechanism takes effect.
10.3.1 - Allowlists
Allowlists suppress specific policy findings without modifying the underlying rules — useful for accepted risks or known false positives. Each allowlist is stored inside the policy bundle alongside its rule sets and mappings, and is applied to findings during the evaluation pipeline. For how allowlists relate to the other exception mechanism, see Manage Exceptions.
Allowlists apply to both image-scoped and app-version-scoped policy evaluation — they target individual findings and are referenced by both image and SBOM mappings.
An allowlist contains one or more entries, each matching a specific gate/trigger result — for example, excluding a particular CVE from policy evaluation. Allowlists are optional, and a policy may contain multiple of them. An allowlist takes effect only when a matched mapping rule references it; when an allowlist entry matches a policy trigger output, that output’s action is set to go and the evaluation result records the matching allowlist and item IDs.
Manage Allowlists in the Anchore Enterprise GUI
The Allowlist tab shows the allowlists present in a policy.
Add a New Allowlist
Click Add New Allowlist to create a new, empty allowlist.
Enter a name. A name is required and should be unique.
Optionally add a description. A description is recommended — it is often updated as entries are added, to explain the background (for example, “Updated to account for a false positive in the glibc library”).
Import or Paste an Allowlist
If you have a JSON document containing an existing allowlist, you can upload it into Anchore Enterprise. You can also edit the allowlist directly in its native JSON format — see Manage Allowlists with AnchoreCTL for the structure.
Click Import Allowlist.
Drag an allowlist file into the dropzone, or click Add a Local File to load it from your filesystem.
Click OK to upload. Anchore Enterprise validates the allowlist; only validated allowlists are stored.
Copy an Allowlist
You can copy an existing allowlist, give it a new name, and reuse it for policy evaluation.
From the Tools drop-down, select Copy Allowlist.
Enter a unique name.
Optionally add a description.
Download an Allowlist
To download an existing allowlist as a JSON file, open the Tools drop-down and click Download to JSON.
Edit Allowlist Entries
The Allowlists editor lets you create, edit, and remove allowlist entries.
Each entry has these components:
Gate — the gate the entry matches, so trigger IDs are not matched in the wrong context.
Trigger ID — the specific trigger result to match. The format is gate/trigger-specific; for the vulnerabilities gate it is the CVE trigger ID. Wildcards are supported for partial matches.
id — an identifier for the entry, unique within the allowlist.
Expires On(optional) — an RFC 3339 date-time after which the entry no longer applies. An expired entry that matches is not allowlisted.
From the Select a Gate dropdown you can choose any active gate (deprecated gates appear in a separate group). The fields shown depend on the gate: the vulnerabilities gate takes a CVE / vulnerability identifier and a package, while any other gates differ. The steps below use the vulnerabilities gate as the example.
Choose an allowlist and click Edit.
Choose a gate — for example, vulnerabilities. A vulnerabilities entry has two elements: a CVE / vulnerability identifier and a package.
Enter a CVE / Vulnerability Identifier — the vulnerability to match (for example, CVE-2017-7246), in the same format shown in the image vulnerabilities report. Wildcards are supported, but use them carefully to avoid allowlisting too many vulnerabilities.
Enter a Package — the package to match with the vulnerability (for example, libc-bin). Wildcards are supported.
An entry can specify both a CVE and a package for an exact match (for example, CVE-2005-2541 + tar), or use a wildcard package where multiple packages are built from the same source (for example, CVE-2017-9000 + bind-* allowlists bind-utils, bind-libs, and bind-license). Take special care with wildcards in the CVE field — a wildcard there allowlists any vulnerability for the package, which is appropriate only in specific cases (for example, the bind-license package, a single copyright file included in all CentOS:7 images, which commonly accrues Bind CVEs that do not actually apply to it).
Save all changes before leaving the editor — at that point the edits are sent to Anchore Enterprise.
Manage Allowlists with AnchoreCTL
There is no dedicated AnchoreCTL command for allowlists — they are part of the policy bundle. To manage them from the CLI, edit the allowlists array in the bundle JSON and apply the bundle with anchorectl policy add or anchorectl policy update.
Each allowlist in the allowlists array is a JSON object:
{
"id": "allowlist1",
"name": "My First Allowlist",
"comment": "An allowlist for my first try",
"version": "2",
"items": [
{
"gate": "vulnerabilities",
"trigger_id": "CVE-2018-0737+*",
"id": "rule1",
"expires_on": "2026-12-30T12:00:00Z" }
]
}
id, name — identifier and label for the allowlist; comment is an optional description.
items — the allowlist entries. Each has a gate, a trigger_id (gate/trigger-specific; wildcards supported), an id unique within the allowlist, and an optional expires_on (RFC 3339). An entry whose expires_on has passed is not applied.
An allowlist takes effect only when a matched mapping rule references it. When an entry matches a trigger output, that output’s action is set to go and the result records the matching allowlist and item IDs.
Manage Allowlists with the API
Allowlists are submitted as part of the policy bundle, not through a dedicated endpoint. Include the allowlists array (shape above) in the bundle when you create or update a policy:
Method
Path
Purpose
POST
/policies
Create a policy whose bundle includes allowlists
PUT
/policies/{policy_id}
Update an existing policy’s bundle, including its allowlists
The full request and response schemas are in the API browser; search for the Policies tag.
10.3.2 - Allowed and Denied Images
The allowed and denied image lists are system-wide overrides that pass or fail images unconditionally, before any policy mapping logic runs. Both lists are stored inside the policy bundle and are checked at the very first step of the evaluation pipeline. For how these lists relate to the other exception mechanism, see Manage Exceptions.
Allowed and denied image lists apply to image policy evaluation only — they match whole images by identity and have no effect on SBOM (app-version) assets.
An image can be referenced in one of three ways:
Name — registry, repository, and tag. For example: docker.io/library/centos:latest. Wildcards (*) are supported. Names are not unique — over time different images may carry the same tag — so a descriptive identifier is recommended.
Image ID — the full 64-character hex image ID. For example: e934aafc22064b7322c0250f1e32e5ce93b2d19b356f4537f5864bd102e8531f. The algorithm prefix (sha256:) is not included.
Image Digest — registry, repository, and digest, including the algorithm prefix. For example: docker.io/library/centos@sha256:989b936d56b1ace20ddf855a301741e52abca38286382cba7f44443210e96d16. The tag is not used when referencing by digest.
For most use cases, reference the image by digest — an image name is ambiguous, since different images may be tagged with the same name over time.
If an image appears on both the allowed and denied lists, the denied entry takes precedence and the image is failed.
Manage Allowed and Denied Images in the Anchore Enterprise GUI
In a policy, open the Allowed / Denied Images tab. It is split into two sub-tabs:
Allowed Images — images that always pass policy evaluation, regardless of the policies mapped to them.
Denied Images — images that always fail policy evaluation, regardless of the policies mapped to them.
Add an Allowed or Denied Image
If the list is empty, click Let’s add one! to begin. The workflow is identical for allowed and denied images.
Choose how to reference the image — by Name, Image ID, or Image Digest (see the reference forms above) — and enter the required fields.
Click OK to add the entry to the policy.
The list view shows each entry with these fields:
Allowlist Name — a user-friendly label for the image(s).
Type — how the image is specified: Name, ID, or Digest.
Image — the specification used to define the image.
Actions — copy the image specification to the clipboard, edit the entry, or delete it.
Find an Image’s ID or Digest
In the Anchore Enterprise GUI, an image’s ID and digest are shown on its detail page in the Images view — open the image and copy the value directly.
You can also retrieve the value with AnchoreCTL.
Image ID with AnchoreCTL:
anchorectl image get library/debian:latest | grep ID
ID: 8626492fecd368469e92258dfcafe055f636cb9cbc321a5865a98a0a6c99b8dd
Image digest with AnchoreCTL:
anchorectl image get library/debian:latest | grep Digest
Digest: sha256:7df746b3af67bbe182a8082a230dbe1483ea1e005c24c19471a6c42a4af6fa82
Manage Allowed and Denied Images with AnchoreCTL
There is no dedicated AnchoreCTL command for allowed and denied images — they are part of the policy bundle. To manage them from the CLI, edit the allowlisted_images and denylisted_images arrays in the bundle JSON (shape below) and apply the bundle with anchorectl policy add or anchorectl policy update.
Within the bundle, each entry in the allowlisted_images or denylisted_images array is a JSON object of the following shape:
registry, repository — the image source to match; wildcards (*) are supported.
image — the reference to match. type is one of tag, digest, or id, and value is the matching string. Wildcards are supported in value.
Allowlist entries (allowlisted_images) always produce a pass for matching images; denylist entries (denylisted_images) always produce a fail. When an image matches both, the denylist wins.
Manage Allowed and Denied Images with the API
The allowed and denied lists are submitted as part of the policy bundle, not through a dedicated endpoint. Include the allowlisted_images and denylisted_images arrays (shapes above) in the bundle when you create or update a policy:
Method
Path
Purpose
POST
/policies
Create a policy whose bundle includes the allowed/denied lists
PUT
/policies/{policy_id}
Update an existing policy’s bundle, including its allowed/denied lists
The full request and response schemas are in the API browser; search for the Policies tag.
10.4 - Evaluate Policy Compliance
Anchore Enterprise evaluates policies against software artifacts to produce a Pass or Fail verdict. The same policy engine, the same rule sets, and the same exception mechanisms run against two distinct scopes — pick the one that matches how your team organizes software.
Two Evaluation Scopes
The two scopes differ only in what the policy is run against. The authoring side is identical.
A single analyzed container image, identified by digest
Pass / Fail for that one image, with per-trigger findings
Image-stage CI/CD gates, post-build pre-publish checks, ad-hoc checks against an image you already have on hand
The app-version-scoped surface is the v6-native evaluation path for teams that have adopted the apps, versions, and assets model. The image-scoped surface is the long-standing path and remains fully supported.
What’s Shared Between Scopes
Both scopes share the same authoring surface — there is no separate “image policy” and “app version policy” to maintain. Specifically:
The policy bundle is the same. The same bundle gates an image-scoped evaluation and an app-version-scoped evaluation. Within the bundle, image rule sets support the full gate library and SBOM rule sets support the Vulnerabilities gate only — so a check against a container image exercises more of the bundle than a check against an SBOM asset, while the bundle being applied is identical. See Policy Gates for the canonical list of all supported gates and their per-rule-set-type availability.
Mappings resolve identically. The image’s registry, repository, and tag (or the SBOM’s name and version) determine which rule sets and allowlists apply, regardless of whether the evaluation was triggered by an image-check or an app-version-status call.
Allowlists apply in both scopes — they attach to the policy and are referenced by both image and SBOM mappings. Allowed and denied image lists are the exception: they apply to image-scoped evaluation only.
The Pass / Fail / Warn verdict semantics are identical — STOP, WARN, and GO actions roll up to the same final verdict in both scopes.
The aggregation is what differs: an image-scoped evaluation returns one verdict for one image, while an app-version-scoped evaluation rolls up every asset in the version into a single per-version verdict and exposes the underlying findings through a query API that pivots across assets. Because the version may contain a mix of container-image and SBOM assets, the verdict aggregates evaluations against different rule sets within the same bundle — each asset matched by its mapping to the rule set appropriate for its type.
Tip: for the gate inventory as implemented by a specific running Anchore Enterprise instance — useful for tooling that validates policy bundles client-side before submission — call GET /system/policy-spec. The endpoint returns every gate, trigger, parameter, and value type the running instance supports.
For the underlying evaluation pipeline that both scopes run through — image override checks, mapping resolution, rule evaluation, allowlist application, and final action determination — see How It Works.
10.4.1 - Evaluate Policy Against an App Version
App-version-scoped policy evaluation runs a policy against every asset attached to an app version and aggregates the results into a single per-version verdict. Use this surface for release-stage CI/CD gates, version-acceptance checks once an app version has all its assets attached, and portfolio-level compliance reporting.
The policy applied is the per-app policy_id when one is set on the parent app, otherwise the account’s active policy. Every asset in the version — container images and SBOMs alike — is evaluated against all SBOM-type rule sets in the policy bundle; the bundle’s container-image mappings are not used in app-version evaluation, and rule sets are not selected by mapping. SBOM mappings are consulted only for their allowlists: every allowlist referenced by any SBOM mapping is applied to the findings, and the sbom_name and sbom_version selectors are completely ignored in v6.0. The per-asset findings are rolled up into the version-level status.
To apply different rule sets to different applications, set a specific policy on the app (its policy_id). SBOM mapping selectors are not used to differentiate assets during app-version evaluation. See Policy Mappings.
Evaluate an App Version in the Anchore Enterprise GUI
The Compliance tab on a version’s detail page is the home for app-version compliance results. The tab shows the aggregated Pass / Fail verdict at the top, with findings grouped by gate, trigger, and asset below. Each finding carries the action badge (STOP, WARN, GO), the rule that produced it, the asset on which it fired, and any allowlist item that matched.
Evaluate an App Version with AnchoreCTL
AnchoreCTL exposes two read commands plus an export. The pair of read commands covers the typical CI/CD pattern of “check the verdict, then drill into findings if it failed.”
Get the Version’s Pass / Fail Status
The status command returns the headline verdict for a version against the account’s active policy (or the app’s policy_id if one is set). It’s the right surface for CI/CD pipelines that need a quick pass/fail signal:
anchorectl app version policy status get 1.4.0 --app my-service
Use -o json for the structured response, which includes the verdict, the policy ID that was evaluated against, and the timestamp of the underlying evaluation.
List the Findings That Drove the Verdict
When a version fails, the findings list enumerates every rule that fired across every asset in the version, with the gate, trigger, action, asset attribution, and any allowlist match:
anchorectl app version policy findings list 1.4.0 --app my-service
Use -o json for the structured records that downstream tooling can consume.
Export the Compliance Report
To produce a downloadable CSV report of the version’s compliance findings — for an audit, a customer deliverable, or an offline review — use the export command:
The export runs as an asynchronous job; AnchoreCTL submits it, waits for completion, and writes the result to the file specified by --file (or stdout if omitted). CSV is the only export format supported today.
Evaluate an App Version with the API
App-version-scoped evaluation is exposed through several endpoints under /apps/{app_id}/versions/{version_id}/policy/:
GET .../policy/status — the headline Pass / Fail verdict for the version.
GET .../policy/findings/all — every finding from the most recent evaluation, with per-asset attribution.
GET .../policy/findings/vulnerabilities — vulnerability findings only, isolated from other gate types.
To re-run the evaluation against an existing version — for example after editing a policy or attaching new assets to a version — submit a job:
POST /apps/{app_id}/jobs/evaluate-policy — creates an evaluate-policy job; the response carries a job_id. Poll GET /apps/{app_id}/jobs/{job_id} until status reaches a terminal state.
The full request and response schemas, including the structure of findings and the evaluate-policy job spec, are in the API browser; search for the App Version Policy and App Jobs tags.
A few conventions worth knowing as you call these endpoints:
Re-evaluations are asynchronous. The standard job lifecycle (pending → processing → complete / failed / cancelled) applies; see How It Works for the underlying model.
Findings are first-class records — see Findings as First-Class Records for the data shape and the relationship to allowlists.
Cross-account requests follow the standard pattern — see Account Scoping.
10.4.2 - Evaluate Policy Against an Image
Image-scoped policy evaluation runs a policy against a single analyzed container image and returns a Pass or Fail verdict for that one image, plus the per-trigger findings that produced it. This is the long-standing evaluation surface and remains fully supported in v6 — use it for image-stage CI/CD gates, post-build pre-publish checks, and ad-hoc verification of an image already in the catalog.
The evaluation is computed against the image’s existing analysis and the policy that the artifact’s mapping selects. The active account policy is used by default; pass a specific policy ID to evaluate against a different bundle.
Evaluate an Image in the Anchore Enterprise GUI
Open an analyzed image’s detail page from the Images view. The Compliance tab shows the most recent evaluation result — the final Pass / Fail verdict at the top, with findings grouped by gate and trigger below. Each finding carries its action badge (STOP, WARN, GO), the rule that produced it, and any allowlist item that matched.
To evaluate the same image against a different policy, change the Policy selector at the top of the tab. The evaluation is recomputed and the result is displayed without changing the account’s active policy.
Evaluate an Image with AnchoreCTL
anchorectl image check fetches the policy evaluation for an image. The image argument accepts a registry/repo:tag reference, an image digest, or an image ID; for digest or ID, the -t flag specifies which tag’s evaluation to return.
A basic check returns the Pass / Fail verdict for the image against the account’s active policy:
anchorectl image check docker.io/my-org/api:1.4.0
To see the individual findings that drove the verdict — each rule that fired, the gate and trigger that produced it, the action, and the message — add --detail:
To evaluate the image against a specific policy rather than the account default, pass --policy with the policy name or ID. The account’s active policy is not affected:
The output format is controlled with -o. Beyond text, the json, json-raw, and csv formats are useful for piping into other tooling; html (combined with --detail) emits a formatted compliance report you can save as a build artifact:
Image-scoped evaluation is exposed through a single endpoint:
GET /images/{image_digest}/check — returns the most recent policy evaluation for the image. Accepts query parameters for policy_id, tag (required), detail, history, and base_digest.
The full request and response schemas, including the structure of findings inside the evaluation result, are in the API browser; search for the Images tag.
A few conventions worth knowing as you call this endpoint:
The tag query parameter is required even when the image is identified by digest — the evaluation result is per-tag, so the same image may have different verdicts under different tags.
base_digest=auto enables base-image inheritance in the evaluation result, marking which findings come from the image’s base rather than its own layers.
Cross-account requests follow the standard pattern — see Account Scoping.
10.5 - SBOM Drift
Software bill of materials (SBOM) drift is understanding how SBOMs change over time, and is a key part of managing your SBOMs. The nature of changes themselves may give early warning into unexpected behavior or intrusion into the build system that a review without context from previous builds would not easily be able to identify.
To do this, you set triggers for policy violations on changes in the SBOM between images with the same tag so that it can detect drift over time between builds of your images.
Drift detection runs through the tag_drift gate within the standard policy pipeline — not as a separate report.
The triggers are:
packages_added
packages_removed
packages_modified
The tag_drift gate compares the SBOMs from the image being evaluated as input, and the SBOM of the image that precedes the input image with the requested tag provided for policy evaluation. The triggers in this gate evaluate the result to determine if packages were added, removed, or modified.
Trigger: packages_added
This trigger warns if a package was added to the SBOM.
STIG (Security Technical Implementation Guide) evaluation extends compliance management to formal government security configuration requirements. The STIG engine runs independently of the standard policy pipeline.
In v6, STIG evaluation targets analyzed container images managed within Anchore Enterprise. See STIG for Container Images for the workflow.
STIG evaluation requires an additional license entitlement. Contact Anchore Customer Success for more information.
10.6.1 - STIG for Container Images
The Anchore Enterprise STIG capability requires an additional license entitlement. Please contact Anchore Customer Success for more information.
Introduction
The Anchore STIG for Container Images feature is intended to allow users to perform STIG evaluations against container images and then
manage them from within Anchore Enterprise. The STIG evaluation can be generated by using an AnchoreCTL workflow,
described below. AnchoreCTL will generate a STIG evaluation using the cinc-auditor tool and a specified STIG profile.
Performing STIG checks
STIG evaluations can be generated using an AnchoreCTL workflow.
Prerequisites of running STIG checks locally
AnchoreCTL STIG evaluations are performed locally and as such there are some dependencies that must be present.
Anchore Static STIG AddOn entitlement - This is a static entitlement that must be added to your Anchore Enterprise license and
enabled on your Anchore Enterprise deployment. Please contact your Anchore Customer Success Team to obtain your entitlement.
The AnchoreCTL instance must be running on a linux host or a linux container that has access to the docker socket.
STIG Profiles
Anchore provides a set of STIG profiles that can be used to perform STIG evaluations against container images.
Anchore provides the following OS STIG profiles:
ubi8
ubi9
ubuntu2204
ubuntu2404
chainguard
Apache Tomcat 9
Nginx
Before these profiles can be used, they need to be written to disk in an accessible location for subsequent AnchoreCTL
invocations to reach.
This could be a one time operation in some persistent storage for CI use. For an air-gapped deployment, this command must have connectivity with your Anchore Enterprise deployment. These profiles can be
written to disk on a ‘connected’ device and then transferred as needed.
Generating STIG Evaluations
There are two methods of generating a STIG evaluation.
Image Add Workflow
To perform a STIG evaluation as part of the image add command you must pass in the --stig flag as well as
--stig-profile with the path to the STIG profile you want to use.
Example:
Perform a STIG evaluation on an existing image that is already in the analyzed state. Use the
anchorectl stig docker image execute command. You must provide the fully qualified image reference when using the execute
command to ensure that the correct image is pulled locally to STIG.
Example:
AnchoreCTL provides commands to manage STIG evaluations that have been uploaded to your Anchore Enterprise deployment.
You can list, download, delete and add STIG evaluations for a specific image digest.
Uploading new STIG evaluations can be done using the anchorectl stig docker image add command. This command allows you
to upload a STIG evaluation for a specific image digest. If using the same profile, the new STIG evaluation will
overwrite the existing one when specifying the evaluation UUID of the existing evaluation. Example:
AnchoreCTL provides optional support for STIG Waiver files. A waiver file is a formal document granting an exception to a rule, requirement, or disqualification. When performing STIG evaluations using AnchoreCTL, you can provide one or more STIG waiver files using the --stig-waiver-file option.
An example waiver file (.yaml) for the tomcat stig would be:
SV-222930:justification:"Waived"run:false
When the stig result is viewed in Heimdall you should see that control marked as waived.
Example YAML file:
SV-260482:justification:> Vendor-managed Kubernetes does not support user namespace remapping.risk_statement:> Containers may run with elevated privileges relative to the host.compensating_controls:- Pod Security Standards enforced- Read-only root filesystem- Noprivileged containersexpiration_date:2025-06-30approved_by:name:Jane Smithrole:Authorizing Official
Example JSON file:
{
"SV-260482": {
"justification": "Vendor-managed Kubernetes does not support user namespace remapping.",
"risk_statement": "Containers may run with elevated privileges relative to the host.",
"compensating_controls": [
"Pod Security Standards enforced",
"Read-only root filesystem",
"No privileged containers" ],
"expiration_date": "2025-06-30",
"approved_by": {
"name": "Jane Smith",
"role": "Authorizing Official" }
}
}
STIG Compliance
Anchore Enterprise also provides STIG policy gate and triggers to ensure that your images are compliant. For more
information on how to use the STIG policy gate, please see the
STIG Policy Gate documentation.
STIG Metrics
For monitoring purposes, Anchore Enterprise has included a set of metrics that can be used to monitor STIG evaluations.
anchore_stig_image_counts - Number of images with STIG evaluations uploaded
anchore_stig_counts - Total number of STIG evaluations uploaded
This capability is deprecated in v6.x and is no longer available.
11 - Troubleshooting
This section contains general troubleshooting guidance for your Anchore Enterprise instance. If you are not sure where to start, the Quick Reference maps common observable symptoms to the most likely diagnostic path. Otherwise, the recommended general approach is to first verify all Anchore Enterprise services are up, use the event subsystem to narrow down particular issues, and then navigate to the logs for specific services to find out more information.
If you have worked through the relevant pages and still cannot isolate the cause, gather a Diagnostic Bundle before contacting Anchore Customer Success.
Throughout this section, AnchoreCTL commands are used to assist with troubleshooting. For more information on AnchoreCTL, see the AnchoreCTL section.
Use this page as a starting point. Match the symptom you are seeing to the most likely diagnostic path, then follow the linked page for detailed steps.
If your symptom is not represented here — or you have worked through the linked path without resolving the issue — gather a Diagnostic Bundle before contacting Anchore Customer Success.
Common Symptoms
Symptom
Likely cause
Start here
A service shows as down or unavailable in anchorectl system status.
The service process has crashed, the container has exited, or the readiness probe is failing.
Re-run anchorectl system status and confirm every service reports up and available.
Run anchorectl event list and look for recent error-level events tied to the affected resource.
Pull the relevant service log (see Viewing Logs) and grep for the resource identifier (image digest, image tag, or thread number).
If you still cannot isolate the cause, prepare a Diagnostic Bundle for Anchore Customer Success.
11.2 - Smoke Testing
This term typically refers to a testing methodology which validates critical or crucial functionality of software. Versions of AnchoreCTL post-5.6.0 include a smoke-tests option, which can be used to validate general functionality of your Anchore Enterprise.
We recommend using this mechanism to validate functionality after upgrades.
The test check-admin-credentials looks for an admin user in the admin account context as defined in your anchorectl.yaml.
anchorectl system smoke-tests run
...
✔ Ran smoke tests
┌───────────────────────────────────────┬─────────────────────────────────────────────────┬────────┬────────┐
│ NAME │ DESCRIPTION │ RESULT │ STDERR │
├───────────────────────────────────────┼─────────────────────────────────────────────────┼────────┼────────┤
│ wait-for-system │ Wait for the system to be ready │ pass │ │
│ check-admin-credentials │ Check anchorectl credentials to run smoke tests │ pass │ │
│ create-test-account │ Create a test account │ pass │ │
│ list-test-policies │ List the test policies │ pass │ │
│ get-test-policy │ Get the test policy │ pass │ │
│ activate-test-default-policy │ Activate the test default policy │ pass │ │
│ create-test-image │ Create a test image and wait for analysis │ pass │ │
│ get-test-image │ Get the test image │ pass │ │
│ activate-test-subscription │ Activate a test subscription │ pass │ │
│ get-test-subscription │ Get the test subscription │ pass │ │
│ deactivate-test-vuln-subscription │ Deactivate the vuln subscription │ pass │ │
│ deactivate-test-policy-subscription │ Deactivate the policy subscription │ pass │ │
│ deactivate-test-tag-subscription │ Deactivate the tag subscription │ pass │ │
│ deactivate-test-analysis-subscription │ Deactivate the analysis subscription │ pass │ │
│ check-test-image │ Check the test image │ pass │ │
│ get-test-image-vulnerabilities │ Get the test image vulnerabilities │ pass │ │
│ delete-test-image │ Delete the test image │ pass │ │
│ disable-test-account │ Disable the test account │ pass │ │
│ delete-test-account │ Delete the test account │ pass │ │
└───────────────────────────────────────┴─────────────────────────────────────────────────┴────────┴────────┘
Troubleshooting Failing Steps
wait-for-system
Polls the API until the vulnerability feed reports as ready (300s timeout).
Failure means: The data syncer cannot reach https://data.anchore-enterprise.com
or feeds have not completed their initial sync.
Verifies the policy engine is functional and default policies exist.
Failure means: Policy engine is unhealthy or feed data has not been loaded yet.
These steps commonly fail as a cascade when wait-for-system also fails.
Submits a test image for analysis and verifies the full analysis pipeline.
Failure means: The analyzer, catalog, or policy engine is not functioning correctly.
Note: all test resources (account, image) are cleaned up automatically at the end of the run.
11.3 - Viewing Logs
Anchore Enterprise services produce detailed logs that contain information about user interactions, internal processes, warnings and errors. The verbosity of the logs is controlled using the logging.log_level setting in config.yaml (for manual installations) or the corresponding ANCHORE_LOG_LEVEL environment variable (for docker compose or Helm installations) for each service.
The log levels are DEBUG, INFO, WARNING, ERROR, and CRITICAL, where the default is INFO. Most of the time, the default level is sufficient as the logs will contain WARNING, ERROR and CRITICAL messages as well. But for deep troubleshooting, it is always recommended to increase the log level to DEBUG in order to ensure the availability of the maximum amount of information.
Raising the log level to DEBUG significantly increases log output and adds load to the system. Use it while actively troubleshooting, and return the level to INFO once you have gathered what you need.
You can find further info on configuring logs in Configuration.
Anchore Enterprise logs can be accessed by inspecting the docker logs for any anchore service container using the regular docker logging mechanisms, which typically default to displaying to the stdout/stderr of the containers themselves - for example:
docker ps
CONTAINER ID IMAGE COMMAND CREATED STATUS PORTS NAMES
f7bd1bff4c90 anchore/anchore-ui:v6.0.0 "/docker-entrypoint.…" 12 minutes ago Up 11 minutes (healthy) 0.0.0.0:3000->3000/tcp, [::]:3000->3000/tcp anchore-6000-ui-1
37637df74cda anchore/enterprise-dev:v6.0.0 "/docker-entrypoint.…" 12 minutes ago Up 11 minutes (healthy) 8228/tcp anchore-6000-policy-engine-1
bf516667e360 anchore/enterprise-dev:v6.0.0 "/docker-entrypoint.…" 12 minutes ago Up 11 minutes (healthy) 0.0.0.0:8558->8228/tcp, [::]:8558->8228/tcp anchore-6000-reports-1
701dbb4a9ac4 anchore/enterprise-dev:v6.0.0 "/docker-entrypoint.…" 12 minutes ago Up 11 minutes (healthy) 8228/tcp anchore-6000-component-catalog-1
b64829f694ac anchore/enterprise-dev:v6.0.0 "/docker-entrypoint.…" 12 minutes ago Up 11 minutes (healthy) 8228/tcp anchore-6000-reports_worker-1
b1044667f188 anchore/enterprise-dev:v6.0.0 "/docker-entrypoint.…" 12 minutes ago Up 11 minutes (healthy) 0.0.0.0:8668->8228/tcp, [::]:8668->8228/tcp anchore-6000-notifications-1
00c47016e3d9 anchore/enterprise-dev:v6.0.0 "/docker-entrypoint.…" 12 minutes ago Up 11 minutes (healthy) 8228/tcp anchore-6000-analyzer-1
5bac7677d307 anchore/enterprise-dev:v6.0.0 "/docker-entrypoint.…" 12 minutes ago Up 11 minutes (healthy) 0.0.0.0:8228->8228/tcp, [::]:8228->8228/tcp anchore-6000-api-1
3107c52d182c anchore/enterprise-dev:v6.0.0 "/docker-entrypoint.…" 12 minutes ago Up 11 minutes (healthy) 0.0.0.0:8778->8228/tcp, [::]:8778->8228/tcp anchore-6000-data-syncer-1
aae305b431c7 anchore/enterprise-dev:v6.0.0 "/docker-entrypoint.…" 12 minutes ago Up 11 minutes (healthy) 8228/tcp anchore-6000-catalog-1
965a7c795d5c anchore/enterprise-dev:v6.0.0 "/docker-entrypoint.…" 12 minutes ago Up 11 minutes (healthy) 8228/tcp anchore-6000-queue-1
de7993ad0f8e redis:7.4.6 "docker-entrypoint.s…" 12 minutes ago Up 12 minutes (healthy) 6379/tcp anchore-6000-ui-redis-1
4ebc23aaf9ed anchore-6000-anchore-db "docker-entrypoint.s…" 12 minutes ago Up 12 minutes (healthy) 5432/tcp anchore-6000-anchore-db-1
docker logs anchore-6000-analyzer-1
[service:anchore-enterprise-analyzer-v6.0.0] [2025-10-02T09:57:44.646254+00:00] [MainProcess] [MainThread] [INFO] [anchore_enterprise.common.service/_register_instance_handlers():594] | Registering api handlers
[service:anchore-enterprise-analyzer-v6.0.0] [2025-10-02T09:57:44.646589+00:00] [MainProcess] [MainThread] [INFO] [anchore_enterprise.common.service/_process_stage_handlers():231] | Processing init handlers for bootstrap stage: pre_config
[service:anchore-enterprise-analyzer-v6.0.0] [2025-10-02T09:57:44.646758+00:00] [MainProcess] [MainThread] [INFO] [anchore_enterprise.common.service/_configure():293] | Loading and initializing global configuration
[service:anchore-enterprise-analyzer-v6.0.0] [2025-10-02T09:57:44.646901+00:00] [MainProcess] [MainThread] [INFO] [anchore_enterprise.common.services/_init_versions():105] | Initializing enterprise versions
[service:anchore-enterprise-analyzer-v6.0.0] [2025-10-02T09:57:44.647043+00:00] [MainProcess] [MainThread] [INFO] [anchore_enterprise.common.service/_configure():296] | Anchore version 6.0.0, DB Schema 6000
[service:anchore-enterprise-analyzer-v6.0.0] [2025-10-02T09:57:44.647247+00:00] [MainProcess] [MainThread] [INFO] [anchore_enterprise.common.service/_configure():320] | Configuration complete
...
...
If you are using Kubernetes to run Anchore Enterprise, you can retrieve the logs from the service pods directly using kubectl commands:
You can find the desired pod name with kubectl get pods.
If you want to trace an image’s journey through the analyzer to track whether it completes successfully, you can do this using the logged events and finding the Thread that the analysis is occurring on - in the below example, we noticed that the processes related to the node:latest image we submitted for analysis were occurring on Thread-5 when observing analyzer logs, so we were able to grep for this to see the entire process;
If you’ve successfully verified that all Anchore Enterprise services are up, but are still running into issues operating Anchore, a good place check is the event log.
The event log subsystem provides users with a mechanism to inspect asynchronous events occurring across various Anchore Enterprise services. Anchore events include periodically-triggered activities such as vulnerability data feed sync in the policy_engine service, image analysis failures originating from the analyzer service, and other informational or system fault events. The catalog service may also generate events for any repositories or image tags that are being watched when Anchore Enterprise encounters connectivity, authentication, authorization, or other errors in the process of checking for updates.
The event log is aimed at troubleshooting most common failure scenarios, especially those that happen during asynchronous operations, and to pinpoint the reasons for failures that can be used subsequently to help with corrective actions. Events can be cleared from Anchore Enterprise in bulk or individually.
Viewing Events
The recent events can be viewed inside the Anchore Enterprise GUI on the Events & Notifications tab:
If using AnchoreCTL, running the following command will give a list of recent Anchore Enterprise events: anchorectl event list
If you would like more information about a specific event, you can run the following command: anchorectl event get <event-id>
Details about a specific Anchore Enterprise event
anchorectl event get 1eb04509b2bc44208cdc7678eaf76fef
✔ Fetched event
UUID: 1eb04509b2bc44208cdc7678eaf76fef
Event:
Event Type: user.image.analysis.completed
Level: info
Message: Image analysis available
Resource:
Resource ID: docker.io/ubuntu:latest
Resource Type: image_tag
User Id: admin
Source:
Source Service: analyzer
Base Url: http://analyzer:8228
Source Host: anchore-quickstart
Request Id:
Timestamp: 2022-08-24T22:06:13.736004Z
Category:
Details:
Created At: 2022-08-24T22:06:13.832881Z
Depending on the output from the detailed events, looking into the logs for a particular servicename (example: policy_engine) is the next troubleshooting step.
11.5 - Data Syncer
Anchore Enterprise runs a hosted data service called the Anchore Data Service. This service publishes datasets from a number of provider sources.
The Data Syncer Service is a core component of Enterprise. Its job is to periodically query Anchore Data Service and download any new datasets available.
Performing a Basic Health Check
Run anchorectl feed list as admin and ensure that:
The last sync date shown is recent and that the feed has enabled set to true.
Run anchorectl feed sync as admin which will:
Queue an update to fetch the data from the data service and propagate feed data across internal services.
Otherwise, this runs on a regular schedule.
You can also visually check the health in the System section of the GUI when logged in as admin.
Configuration Checks
Check that the feed pod/container has enough disk space:
Storage
Ensure your data syncer pod has enough storage (around 2 GB of writable space) to cache the datasets to disk, this reduces database queries.
Memory
Ensure the data syncer pod has sufficient memory (around 2 GB), especially if you are running multiple analyzers
Network
Ensure your data-syncer pod / container has network connectivity to hosted feed service by exec’ing into the container and then:
If you have a network proxy deployed, you might need to configure your feed service to utilize it:
Ensure your policy pod / container has network connectivity to your local data-syncer pod / container
Run e.g. curl http://anchore-data-syncer:8228/v2/datasets/vulnerability_db/6/latest returns success to confirm connectivity.
Operational Checks and Verification
Feed list show up empty: Check if your feed syncs are happening, there should be data_syncer events in the event log. You should see successful events in the event log. In case there are failures click on the event log and see the cause for failure.
Data-syncer is reporting errors fetching new datasets: Check the Anchore Data Service Status Page. If the service is reporting up and running then check your firewall settings. If the service is reporting any failures please wait for the service to recover.
I see a lot of 404’s in the data-syncer and policy engine logs as soon as the services start: This is normal, the data-syncer takes a few minutes after startup to successfully sync down the configured datasets from the Anchore Data Service. The Policy Engine Service starts asking for the latest vulnerability dataset as soon as it starts up, it takes a few minutes for the system to reconcile. (This is only true for new greenfield deployments)
My first analyzer scan takes longer than the rest: First analyzer scan can take up to 5 minutes, this is just due to the analyzer waiting for the data-syncer to sync down a ClamAV database. Subsequent scans will not incur this penalty.
11.6 - Verifying Service Health
You can verify which services have registered themselves successfully, along with their status, by running: anchorectl system status
anchorectl system status
✔ Status system
┌───────────────────┬────────────────────┬───────────────────────────────┬──────┬────────────────┬────────────┬──────────────┐
│ SERVICE │ HOST ID │ URL │ UP │ STATUS MESSAGE │ DB VERSION │ CODE VERSION │
├───────────────────┼────────────────────┼───────────────────────────────┼──────┼────────────────┼────────────┼──────────────┤
│ simplequeue │ anchore-quickstart │ http://queue:8228 │ true │ available │ 6000 │ 6.0.0 │
│ component_catalog │ anchore-quickstart │ http://component-catalog:8228 │ true │ available │ 6000 │ 6.0.0 │
│ notifications │ anchore-quickstart │ http://notifications:8228 │ true │ available │ 6000 │ 6.0.0 │
│ reports_worker │ anchore-quickstart │ http://reports_worker:8228 │ true │ available │ 6000 │ 6.0.0 │
│ data_syncer │ anchore-quickstart │ http://data-syncer:8228 │ true │ available │ 6000 │ 6.0.0 │
│ reports │ anchore-quickstart │ http://reports:8228 │ true │ available │ 6000 │ 6.0.0 │
│ analyzer │ anchore-quickstart │ http://analyzer:8228 │ true │ available │ 6000 │ 6.0.0 │
│ apiext │ anchore-quickstart │ http://api:8228 │ true │ available │ 6000 │ 6.0.0 │
│ catalog │ anchore-quickstart │ http://catalog:8228 │ true │ available │ 6000 │ 6.0.0 │
│ policy_engine │ anchore-quickstart │ http://policy-engine:8228 │ true │ available │ 6000 │ 6.0.0 │
└───────────────────┴────────────────────┴───────────────────────────────┴──────┴────────────────┴────────────┴──────────────┘
This can also be found in the GUI under the System tab, where each service will be laid out with information on its name, status, and other related information:
If specific services are down, you can investigate the logs for the services. For more information, see Viewing Logs.
The -vvvv and -o json Options
Passing a high-verbosity flag (-vvvv) to AnchoreCTL can often help narrow down particular issues by displaying the client configuration and client functions as they are running:
Passing the -o json option to AnchoreCTL commands will output the API response data in JSON, which often contains much more information than what the CLI outputs by default for both regular successful operations, and for operations that are resulting in an error:
anchorectl -o json system status
✔ Status system
{
"serviceStates": [
{
"baseUrl": "http://reports_worker:8228",
"hostid": "anchore-quickstart",
"serviceDetail": {
...
...
11.7 - Diagnostic Bundle
When you raise a support issue, Anchore Customer Success may need logs, configuration, and other diagnostic information from your deployment to investigate. Anchore Enterprise provides a way to collect this material into a single diagnostic bundle directly from your own systems, so you can gather everything in one step and share it with Customer Success.
Reach out to Anchore Customer Success for the support bundle utility, maydayctl.
12 - API
APIs Overview
Anchore Enterprise is an API-first system. All functions available in the UI and AnchoreCTL are constructed from the same
APIs directly available to users. The APIs are a combination of a OpenAPI-specified REST-like API and a reporting-specific GraphQL API.
REST API
The REST API is the primary API for interacting with Anchore Enterprise and has the most functionality. The Anchore Enterprise V2 API is viewable in the following ways:
Retrieve your local spec with curl http://<servername:port>/v2/openapi.json
GraphQL API
The GraphQL API is intended for reporting functions and aggregating data from all resources in an Anchore Enterprise account and does not provide the same functionality as the REST API. The data
that the GraphQL API operates on is updated differently than the data in the REST API and thus may have an update lag between
when changes are visible via the REST API and when that data flows into functionality covered by the GraphQL API.
Both the REST and GraphQL APIs are exposed on a network and should be protected at the channel level using TLS. Regardless of the authentication scheme,
transport security ensures resistance to replay attacks and other forms of request and credential abuse and should always be used.
See Configuring TLS for setting up TLS in Anchore Enterprise services directly, or use TLS
termination via load balancers or service meshes such as Istio and LinkerD. The
right choice for your deployment will depend on your specific environment and requirements.
Anchore Enterprise APIs support three authentication methods:
HTTP Basic
Use HTTP ‘Authorization’ header: Authorization: Basic <base64_encode(<username> + ':' + <password>)> along with your native account credentials
Both the REST and GraphQL APIs implement authorization with Role-Based Access Control (RBAC). The APIs also supports Cross-Account access.
In this example, we can query for images in an account named ‘product1’ instead of the account that my user resides in.
curl -X GET -u <username:password> -H "x-anchore-account: product1" "http://<servername:port>/v2/images"
12.1 - REST Anchore API
Reference for the Anchore API V2
12.2 - GraphQL Reports API Access
Anchore Enterprise Reports provides a GraphQL API for direct interaction with the service.
GraphQL is a query language for APIs and a runtime for fulfilling those queries.
The main Anchore Enterprise REST API includes operations for retrieving scheduled report results as static sets to make retrieval
of saved results simpler. It is available in the V2 API. The GraphQL schema and types are documented at https://graphql.org/learn/schema/.
Get started
There are different ways of interacting with the Anchore Enterprise Reports GraphQL API. The following sections highlight
two different options for exploring the Anchore Enterprise Reports GraphQL schema with a few examples.
The endpoint you use for interacting with the GraphQL API is the same host and port as the main V2 API. The path is:
/v2/reports/.
Graphical User Interface
One of the ways of exploring and testing a GraphQL schema is by using a web based interface - GraphiQL.
GraphiQL is built-in to the API service and enabled by default in Anchore Enterprise.
To access it in a running Anchore Enterprise deployment, open one of the following urls in a browser:
You will be prompted to enter your Anchore Enterprise credentials.
Working with queries in GraphiQL
Click the show Documentation Explorer button (book icon) in the top left of the GraphiQL window to view the self-describing schema. There are only two root types exposed currently, Query and Mutation.
Query type can be used to obtain image vulnerability data on request.
Mutation type can be used to create new as well as execute and manage existing scheduled queries.
Expand the Query type by clicking on the hyperlink to expose all sub-types. Notice the schema example for runtimeInventoryImagesByVulnerability in the schema docs:
The documentation snippet above comprises of (1) a query type name then (2) arguments for the maximum number of responses to be returned within each page, and/or (3) the nextToken supplied from a previous response if this number is exceeded. See the pagination section below for more information. Additionally (4) the filter which must be correctly defined for the query to be successful. Some basic arguments may be omitted for simple test queries, however the root query type structure shown in the documentation itself must always be surrounded by curly braces {..} when used in the editor.
When a query structure is formatted correctly it will be colourised to indicate that it matches the schema. Ensure that limit example is defined as an integer number if used, omit nextToken string if not required. Check the right hand panel for any syntax errors.
Now click on the hyperlink in the schema docs for the filter RuntimeInventoryImagesByVulnerabilityFilter. This filter schema defines three additional filters which can each be used individually within the previous structure.
The above example shows one RuntimeInventoryImagesByVulnerabilityFilter artifact filter field called ’name’ which searches for any artifacts with ‘gzip’. More than one field can be used in each filter, and more than one filter field can be defined in multiple filters.
After closing the parentheses (which hold the query type arguments) a response section is added within curly braces to define the results which will be returned. This approach allows different response results to be freely defined according to the query response schema linked to from the top level schema doc RuntimeInventoryImagesByVulnerabilityResponse:
Notice that the query response structure also allows both ‘images’ and ‘artifacts’ fields to be defined using their own individual arguments, click on the named hyperlinks to traverse the structure for examples. When combined together the type definition for both the query and response types create a full query.
In summary the GraphiQL GUI interface is handy for exploring and constructing queries supported by the backing API. On the left you can explore the API query docs specific to Anchore, in the middle you can construct and execute your query and on the right side you can see your query results.
Happy querying!
Command-Line Interface
You can also use curl to send HTTP requests to Anchore Enterprise Reports API. To view the schema
$ curl -u <username:password> -X POST "http://<servername:port>/v2/reports/graphql?query=%7B__schema%7BqueryType%7Bname%20description%20fields%7Bname%20description%20args%7Bname%20description%20type%7Bname%20kind%7D%7D%7D%7D%7D%7D%0A"
You can use the API programmatically within the command line and other custom scripts/programs.
Query Options
API Key
If you are interacting directly with the API, either via a command line tool, custom scripts/programs or the GraphiQL GUI interface;
You can generate and utilize API keys to avoid using private credentials. See Generating API keys for details.
API keys, work the same way as your regular credentials for both command line and GUI queries. The username for API keys is static as _api_key and the password is the value of the generated key string.
Visit your GraphiQL endpoint in your web browser. Use ‘_api_key’ and ‘’ when prompted for a username and password.
Pagination
Depending on the size of the data set (i.e. number of tags, images etc in the system) the results of a query could be very
large. The reports service implements pagination for all queries to better handle the volume of the results.
All response types contain a metadata object called pageInfo. It is optional, but recommended to add to all
queries:
A non-null nextToken indicates that results are paginated. To get the next page of results, fire the same query along
with the nextToken from the last response as a query parameter:
List vulnerabilities of a specific severity. And include all the images, currently or historically mapped to a tag,
affected by each vulnerability
Use the query’s filter argument for specifying the conditionality. Reports service defaults to the “current”
image-tag mapping for computing results. To compute results across all image-tag mappings - current and historic, set the tag filter’s currentOnly attribute to false. Query for vulnerabilities of Critical severity:
To get more details such as tag mappings for the image, add the relevant attributes from the schema to the body of the query.
List vulnerabilities detected in the last x hours. And include all the images, currently or historically mapped to a tag, affected by each vulnerability
Use vulnerability filter’s after and before attributes for specifying a time window using UTC timestamps. Query for vulnerabilities detected after/since August 1st 2019:
Given a vulnerability ID, list all the artifacts affected by that vulnerability. And include all the images, currently or historically mapped to a tag, containing the said artifact
Use vulnerability filter’s id attribute for specifying a vulnerability identifier. Query for vulnerability ID CVE-2019-15213:
Scheduled reports can be created via the Anchore Enterprise reporting Web UI or using the GraphQL API and mutation type.
Once you have created a scheduled report, the following example below will run you through how you can retrieve and use this report data.
Please note:
Large queries will run MUCH faster when created as a scheduled report and run. vs manually paginating through the API.
When creating a scheduled report directly via the GraphQL API it will NOT show up in the UI.
To retrieve reports with global scope you will need to use /v2/reports/global/graphql route mentioned above.
Retrieve a list of UUIDs for all scheduled report executions. Use the selected UUIDs to retrieve the report content from the API:
13.1.1 - Anchore Enterprise Release Notes - Version 6.0.0
Anchore Enterprise v6.0.0
Enterprise Service
Anchore Enterprise v6.0.0 introduces the new SBOM Management platform, organized around Apps, App
Versions, and Assets. Assets are container images or imported SBOMs. Assets are grouped under App Versions, providing
aggregated SBOM content, vulnerability findings, policy compliance results, and document exports. The platform is
powered by a new asynchronous Jobs framework for analysis, import, and export operations.
Anchore Enterprise v6.0.0 supports new (greenfield) deployments only. Upgrades from v5.x deployments are blocked, and an existing deployment that attempts to roll out v6.0.0 will not start. Upgrade support for existing deployments will arrive in an upcoming release.
Requirements
Anchore Enterprise v6.0.0 requires PostgreSQL 17 or greater with the pg_cron extension installed and accessible
by Anchore Enterprise. Pre-flight checks verify at startup that the database version and required extensions are working
correctly, and the deployment will fail to start if these requirements are not met.
SBOM ingestion in v6.0 drives larger parallel query plans against PostgreSQL, which use dynamic shared memory
(/dev/shm on Linux). Docker’s default tmpfs of 64 MiB is insufficient for typical SBOM workloads. Operators running
PostgreSQL on Kubernetes or self-managed hosts should size /dev/shm to at least 1 GiB -
see Shared Memory for full guidance. Managed databases
(Amazon RDS, Aurora) are unaffected.
Announcements
Behavior changes
Default CPE matching configuration - New installs now default to a CPE matching configuration aligned with native Grype behavior. CPE-based matching is disabled for ecosystems with strong GitHub Security Advisory coverage (Java, Python, JavaScript, Ruby, .NET, and Go, with the Go standard library excepted) to reduce false positives. A curated mapping of known CPEs to Grype package specifiers, delivered through vulnerability database updates, preserves matching for well-known packages that are not distributed through public ecosystems.
Hashed passwords and OAuth always enabled - Hashed password storage and OAuth for internal service communication are now always enabled and are no longer configurable. The related configuration options and the anchore-enterprise-manager utility for converting plaintext passwords have been removed.
[UI] Usage page terminology - On the System › Usage page, imported SBOM analyses are now tracked under SBOM artifact creation, and Stateless Evaluations has been renamed to One-Time Evaluations.
New Features
Apps
Apps are a new way to organize the software you monitor with Anchore Enterprise. An App represents one
of your software projects or products. Each App has Versions, and each Version holds the Assets — the container
images and SBOMs — that make up that release. Anchore Enterprise rolls up the SBOM content, vulnerability findings,
and policy compliance results from all of a Version’s Assets, so you can answer questions about an entire release
instead of piecing together results one artifact at a time. Please see Apps
for the full model and how to work with Apps, Versions, and Assets.
You can manage Apps, Versions, and Assets through the Anchore Enterprise UI, the new public APIs, or with AnchoreCTL. Everything you’d expect
comes along with the new model: new RBAC roles (application-editor, application-delete) for managing Apps, Versions, and Assets, events are generated as
Apps, Versions, and Assets are added or deleted, and usage metrics count Apps, Versions, Assets, and unique artifacts. The new APIs also
share a standardized error model — structured error codes with consistent JSON responses, a lookup API for code details,
and documented remediation guidance for each code.
Assets
There are several ways to get Assets into an App Version:
Container images — let Anchore Enterprise pull and analyze the image for you (centralized analysis), or analyze it locally with AnchoreCTL and upload the result (distributed analysis).
Filesystems — analyze a directory tree locally with AnchoreCTL (e.g. a source repo, build artifact dir, or mounted VM) and upload the resulting SBOM. See Filesystem Assets.
SBOMs you already have — import Syft, CycloneDX, or SPDX documents directly. Anchore Enterprise breaks them down
into package contents that feed the Version’s aggregated views, vulnerability scans, and policy evaluations. Please Note: SPDX 3.x
documents can be uploaded and downloaded today, but content and vulnerability analysis against them is not yet functional.
Container-image assets and SBOM imports can be added directly from the Add Asset dialog in the Anchore Enterprise UI, as well as through the APIs and AnchoreCTL; filesystem assets are added with AnchoreCTL.
You can download an Asset’s SBOM at any time — you get back the original document for imported SBOMs, or the generated SBOM for container images.
Aggregated SBOM Content
Every App Version gives you a single, deduplicated view of the packages across all of its Assets. You can search packages,
see a summary of unique packages by type, and ask which Assets contain a particular package.
Aggregated Vulnerability Results
Vulnerability findings are rolled up across all of a Version’s Assets and kept current as the vulnerability database
updates. Scanning reports vulnerabilities even for packages of unknown type, and automatically enriches SBOMs with
CPEs when none are present, so imported SBOMs get full match coverage. You can list and search findings, view a summary
broken down by severity, fix availability, KEV listing, and EPSS coverage, and look up which packages a given
vulnerability affects. To help you decide what to tackle first, each finding carries an Anchore Score (0-100) that
blends CVSS, severity, EPSS, and KEV signals, shows where each CVSS score came from (NVD, CISA, GitHub, or Other), and
links back to the upstream data sources. And when a vulnerability database update brings new findings for an App, you’ll get an event listing the affected Versions.
You can also record VEX annotations on an App to capture your assessment of a finding. Annotations apply to a
specific vulnerability and package pair — so marking one package as not affected won’t hide other packages hit by the same
CVE — and that state shows up everywhere: in listings, search, and summaries.
Aggregated Policy Compliance
Each App Version’s compliance status stays continuously up to date against your active policy — when Assets change,
the policy changes, or the vulnerability database updates, Anchore Enterprise re-evaluates automatically. You can
retrieve the overall pass/fail status with summary statistics, or dig into paginated, searchable policy findings.
Exports
When you need to hand results to another team or tool, you can export an App Version’s aggregated data as downloadable documents:
SBOM in SPDX or CycloneDX format
VDR (Vulnerability Disclosure Report) in CycloneDX JSON, VEX-aware with an optional flag for narrative annotation detail
VEX document in CycloneDX format
Vulnerabilities, package contents, and policy compliance documents in CSV format
Jobs
Asset analysis, SBOM import, and exports all run as asynchronous jobs, so long-running work doesn’t block you. Jobs
are visible within an App Version and provide a view of the ongoing and completed work the system is doing. This view
also provides a place to download any exported documents.
Fixes
Fixes an issue where an invalid regular expression in a Dockerfile gate instruction trigger was accepted but caused policy evaluations to fail; regular expression values are now validated when the policy is submitted.
Fixes an issue where the Dockerfile gate produced a misleading remediation suggestion when evaluating an SBOM that contained no Dockerfile.
Fixes an issue where the image digest was reported inconsistently across event details; image-related events now expose the digest through a single, consistent field.
Fixes an issue where Java package hints only applied the minimum fields (name, version, and type) and dropped additional properties such as location, origin, and implementation, Maven, and specification versions.
Fixes an issue where some CPEs in the vulnerability database were transformed into invalid representations, causing affected-package fields to be missing or empty in vulnerability query results.
Fixes an issue where analyzing an image containing hints-synthesized Java packages with a null virtual path caused policy engine ingestion to fail, leaving the image stuck in an analyzing state.
Fixes an issue where retrieving license overrides failed with a 400 error when the package URL contained an @ in a namespaced package scope (for example, npm scoped packages such as @babel/code-frame).
Fixes an issue where a transient database error during configuration refresh could cause the configuration watcher to crash repeatedly until the service was restarted.
Fixes an issue where malware scanning failed when ClamAV output contained non-UTF-8 characters, causing image analysis to fail.
Fixes an issue where image analysis failed during document view generation if the database was restarted without also restarting the Catalog service.
Fixes an issue where the source content APIs returned legacy content types (docker_history, dockerfile, and manifest) that are not applicable to sources.
[UI] Fixes an issue where a custom login message containing HTML-significant sequences (for example, </script>) prevented the login page from loading. The message content was already sanitized against XSS; this addressed a separate client bootstrap issue.
[UI] Fixes an issue where application tour popups briefly flickered in the wrong position before settling when first opened.
[UI] Fixes an issue where the Show Details button overlapped the error message on narrow screens.
[UI] Updates supporting libraries for security and performance, removes deprecation warnings, and removes redundant libraries to reduce startup time and bundle size.
Deprecations
The legacy Application APIs are deprecated in favor of the new Apps and App Versions APIs.
GET /v2/applications
POST /v2/applications
GET /v2/applications/{application_id}
PUT /v2/applications/{application_id}
DELETE /v2/applications/{application_id}
GET /v2/applications/{application_id}/versions
POST /v2/applications/{application_id}/versions
GET /v2/applications/{application_id}/versions/{application_version_id}
PUT /v2/applications/{application_id}/versions/{application_version_id}
The legacy webhooks subsystem, including the webhook configuration in the configuration file, has been removed. Use the Notifications system to deliver events to webhook endpoints.
The OpenStack Swift object store driver has been removed. Please see Object Storage for the list of supported object stores.
The deprecated feed- and dataset-sync event types (system.feeds.sync.* and system.dataset.sync.*) have been removed.
The legacy Kubernetes and ECS runtime vulnerability report tables have been removed and are dropped from the database.
The deprecated policy feed sync configuration options have been removed.
The enable_owned_package_filtering configuration option has been removed. Legacy image, App Version, and Grype vulnerability scans now return consistent results, and the content APIs may now return overlapping (owned child) packages that were previously filtered out.
The stale_feed_data policy trigger has been removed for SBOM policies and is no longer included in the default policy.
The experimental Imported SBOM APIs (/exp/sboms and /exp/sbom-groups) have been removed. Import SBOMs as Assets in an App Version instead.
The Artifact Lifecycle Policy (ALP) rules for imported SBOMs have been removed.
[UI] The standalone Imported SBOMs view has been removed from the UI. Import SBOMs as Assets within an App Version instead. Bookmarked legacy URLs (/sboms, /sboms/groups/{id}, and /sboms/{id}/..., including account-scoped variants) now 301-redirect to /applications, so saved links do not return a 404.
[UI] The legacy 5.x Applications view has been removed from the UI and is fully replaced by the new Applications experience built on Apps, Versions, and Assets.
[UI] The Sources analysis views have been removed from the UI, in line with the deprecation of the Source APIs.
13.1.2 - Anchore Enterprise Release Notes - Version 5.27.1
Anchore Enterprise v5.27.1
Enterprise Service
Future v6 Release
Anchore Enterprise v6 will require Postgres 17 or greater and the pg_cron extension to be installed and accessible by Anchore Enterprise. Please plan your database upgrades accordingly.
If upgrading from a release in the range of v5.0.0 - v5.26.x
The upgrade will result in an automatic schema change that will require database downtime. Below are the estimated downtime durations for version that require significant downtime:
The v5.3.0 schema change may take more than an hour to complete depending on the amount of data in your reporting system.
The v5.6.0 schema change may take 2 hours or more depending on the amount of data in your system.
The v5.11.x schema change will take approximately 1-2 minutes to complete for every 1 million vulnerable artifacts in your reporting system.
If your Anchore Enterprise deployment is on FIPS enabled hosts and your database is being hosted on Amazon RDS, an upgrade to Postgres 16 or greater is required. For more information please see the FIPS section in Requirements.
Minimum recommended memory for the Analyzer and Policy Engine services has been increased from 8GB to 16GB to better support the performance improvements in the new image analysis system. See the Deployment Requirements Documentation for more information.
Security
Various supporting libraries and dependencies have been updated to address security advisories.
Deprecations
Support for OpenStack Swift, which is an open-source object storage system, has been deprecated. Please see Object Storage for a list of supported Object Stores.
The enterprise-gitlab-scan plugin is being deprecated in favor of using AnchoreCTL directly in your pipelines. Please see GitLab for more information on integrating Anchore Enterprise with GitLab.
The webhook system managed in the configuration file is being deprecated in favor of the more advanced notification system which can be configured to send notifications to webhook endpoints. Please see Notifications for more information on configuring notifications.
Images analyzed prior to Anchore Enterprise v4.0.0 will be updated to indicate that their analysis has failed, as Anchore Enterprise no longer supports the analysis artifacts produced prior to v4.0.0. Please ensure that any required images are re-analyzed after upgrading to v5.25.0.
Images archived prior to Anchore Enterprise v4.0.0 can no longer be restored into the active dataset. Please ensure that any required archived images are restored prior to upgrading to v5.25.0.
13.1.3 - Anchore Enterprise Release Notes - Version 5.27.0
Anchore Enterprise v5.27.0
Enterprise Service
Future v6 Release
Anchore Enterprise v6 will require Postgres 17 or greater and the pg_cron extension to be installed and accessible by Anchore Enterprise. Please plan your database upgrades accordingly.
If upgrading from a release in the range of v5.0.0 - v5.26.x
The upgrade will result in an automatic schema change that will require database downtime. Below are the estimated downtime durations for version that require significant downtime:
The v5.3.0 schema change may take more than an hour to complete depending on the amount of data in your reporting system.
The v5.6.0 schema change may take 2 hours or more depending on the amount of data in your system.
The v5.11.x schema change will take approximately 1-2 minutes to complete for every 1 million vulnerable artifacts in your reporting system.
If your Anchore Enterprise deployment is on FIPS enabled hosts and your database is being hosted on Amazon RDS, an upgrade to Postgres 16 or greater is required. For more information please see the FIPS section in Requirements.
Minimum recommended memory for the Analyzer and Policy Engine services has been increased from 8GB to 16GB to better support the performance improvements in the new image analysis system. See the Deployment Requirements Documentation for more information.
Fixes
Fixes an issue where downloading or generating an SBOM from an analyzed image produced an incorrect source.name, displaying the internal analysis scratch path instead of the actual image reference.
Fixes an issue where the Artifact Location column in Runtime/Inventory reports incorrectly displayed the artifact PURL instead of the actual artifact location path.
Fixes an issue where empty SAML attributes in an IdP assertion caused SSO login failures with a ValueError, preventing users from authenticating.
Fixes an issue where image analysis could become stuck in a failing state with the error “Image is not in base state” when the analyzer was unable to fetch the image record from the catalog.
Fixes an issue where image analysis failed with analysis_failed status for accounts that had corrections configured with origin, licenses, or cpes as the match field, caused by an error during SBOM content generation.
Fixes an issue where generated SBOMs for images analyzed via distributed analysis were missing os and architecture details in the source metadata.
Deprecations
Support for OpenStack Swift, which is an open-source object storage system, has been deprecated. Please see Object Storage for a list of supported Object Stores.
The enterprise-gitlab-scan plugin is being deprecated in favor of using AnchoreCTL directly in your pipelines. Please see GitLab for more information on integrating Anchore Enterprise with GitLab.
The webhook system managed in the configuration file is being deprecated in favor of the more advanced notification system which can be configured to send notifications to webhook endpoints. Please see Notifications for more information on configuring notifications.
Images analyzed prior to Anchore Enterprise v4.0.0 will be updated to indicate that their analysis has failed, as Anchore Enterprise no longer supports the analysis artifacts produced prior to v4.0.0. Please ensure that any required images are re-analyzed after upgrading to v5.25.0.
Images archived prior to Anchore Enterprise v4.0.0 can no longer be restored into the active dataset. Please ensure that any required archived images are restored prior to upgrading to v5.25.0.
UI Updates
Fixes
Fixed an issue where viewing the Events & Notifications page for an account context with a large number of events could cause the UI pod to crash due to excessive memory usage.
Fixed an unlikely issue where upon failure to retrieve Image Compliance list data, the page would continue to show as loading instead of presenting an error.
Fixed an unlikely issue where the Image Metadata tab could crash due to an unhandled error response from a data dependency.
Various supporting libraries have been updated in order to improve security, performance, and also to remove deprecation warnings from browser and server output logs. Redundant libraries have been removed to reduce the app startup time and overall size.
If upgrading from a release in the range of v5.0.0 - v5.25.x
The upgrade will result in an automatic schema change that will require database downtime. Below are the estimated downtime durations for version that require significant downtime:
The v5.3.0 schema change may take more than an hour to complete depending on the amount of data in your reporting system.
The v5.6.0 schema change may take 2 hours or more depending on the amount of data in your system.
The v5.11.x schema change will take approximately 1-2 minutes to complete for every 1 million vulnerable artifacts in your reporting system.
If your Anchore Enterprise deployment is on FIPS enabled hosts and your database is being hosted
on Amazon RDS, an upgrade to Postgres 16 or greater is required. For more information please see the FIPS
section in Requirements.
Minimum recommended memory for the Analyzer and Policy Engine services has been increased from 8GB to 16GB to better
support the performance improvements in the new image analysis system. See the
Deployment Requirements Documentation for more information.
Archived Images
Images archived prior to Anchore Enterprise v4.0.0 can no longer be restored into the active dataset. Please ensure that any required archived images are restored prior to upgrading to v5.25.0.
New Features
Vulnerability Data Sources
Adds vulnerability data source support for VMware PhotonOS, enabling vulnerability monitoring for images based on PhotonOS.
Adds vulnerability data source support for Fedora, including EPEL packages sourced from the Bodhi update system.
Adds vulnerability matching and policy evaluation support for SecureOS and Arch Linux.
CPE Matching Configuration
CPE matching for GitHub-covered ecosystems is now disabled by default for new deployments. Existing deployments that
upgrade to v5.26.0 will see no change. This setting is configurable via the API,
allowing administrators to customize CPE matching behavior per ecosystem. See
Vulnerability Scanning for more information.
Improvements
Updates the embedded Grype vulnerability scanner to handle version string prefix changes for improved compatibility.
The policy engine now correctly handles hints-synthesized Java packages with null virtualPath metadata, preventing potential crashes during analysis.
Fixes
Fixes an issue where configuration patches of array string values are not applied correctly.
Fixes an issue where notification exceptions are not properly hidden in the logs.
Fixes an issue where the GET /v2/images/{image_digest}/metadata/{metadata_type} API returns a 500 error instead of 404 when the given image digest is not found.
Fixes an issue where listing policies with detail fails if the policy is not accessible from the object store.
Fixes an issue where not all image analysis events include the full image pullstring.
Fixes an issue with the IDP authentication workflow related to the request.data deprecation.
Fixes an issue where image content search regex values are double base64 encoded.
Fixes a SQL injection vulnerability in the /reports/graphql endpoint nextToken parameter.
Fixes an issue where /query/vulnerabilities endpoint responses are missing some fields on certain NVD records.
Fixes an issue where binary hints are being dropped when there is a duplicated location.
Fixes an issue where Java hints are not being applied correctly.
Fixes an issue where image analysis fails when using license hints.
Fixes an issue where the catalog service fails to parse valid OCI image manifests.
Fixes an issue where the Windows analyzer is using the wrong package type for Grype.
Deprecations
Support for OpenStack Swift, which is an open-source object storage system, has been deprecated. Please see Object Storage for a list of supported Object Stores.
The enterprise-gitlab-scan plugin is being deprecated in favor of using AnchoreCTL directly in your pipelines. Please see GitLab for more information on integrating Anchore Enterprise with GitLab.
The webhook system managed in the configuration file is being deprecated in favor of the more advanced notification system which can be configured to send notifications to webhook endpoints. Please see Notifications for more information on configuring notifications.
Images analyzed prior to Anchore Enterprise v4.0.0 will be updated to indicate that their analysis has failed, as Anchore Enterprise no longer supports the analysis artifacts produced prior to v4.0.0. Please ensure that any required images are re-analyzed after upgrading to v5.25.0.
Images archived prior to Anchore Enterprise v4.0.0 can no longer be restored into the active dataset. Please ensure that any required archived images are restored prior to upgrading to v5.25.0.
UI Updates
Improvements
Within Image Analysis:
When viewing the Vulnerabilities tab, the filter previously labeled Vendor Packages has been renamed to Disputed by Vendor to better describe its purpose: filtering vulnerabilities where the distribution vendor’s assessment differs from NVD and no fix is planned.
Within Imported SBOMs:
SBOM lists can now be filtered by their Annotation entries. The control supports a compound filter criteria of up to five key-value pairs to find matching SBOMs.
In the Compliance tab, the Recommendation filter has been replaced by a boolean Has Recommendation filter, which makes it easy to display only findings that either have or do not have a recommendation, rather than filtering by the contents of the recommendation.
Within System:
A new user-viewer role can now be assigned to user groups or directly to users. A user with this role can use AnchoreCTL or the API to view all the users of the system across all accounts.
Fixes
Fixed an issue where missing or unavailable content data for a predecessor image could prevent the Vulnerabilities, Contents, and Changelog pages from loading for the current image.
Addressed a contrast issue with the selected auth type on the Login screen, which was particularly hard to see in light mode. The active auth type is now outlined.
When using the Evaluation Preview option in the Policy Editor, the Inherited from Base and Allowlisted columns always displayed No, even when they should have had a value. That issue has been addressed.
Fixed an issue where the search input and pagination controls would disappear when result filters produced zero results, but remained visible when the table search produced zero results. The controls now persist consistently as long as the artifact has vulnerabilities, allowing users to adjust their filters regardless of how results were narrowed.
The list of mappings used by a specific allowlist did not account for SBOM or Source Repository mappings, and listed only Container Image mappings. That issue has now been addressed.
Fixed an issue where persistence of URL query params for selected SBOM Groups was lost. The view now correctly retains the selection across page reloads and filters the list of SBOMs as expected.
Fixed an issue where the policy compliance table in the Artifact Analysis view would revert to the default sort order (Gate Action) after adding an entry to an allowlist. The table now preserves the user’s selected sort order when compliance data is refreshed after this change.
Various supporting libraries have been updated in order to improve security, performance, and also to remove deprecation warnings from browser and server output logs. Redundant libraries have been removed to reduce the app startup time and overall size.
If upgrading from a release in the range of v5.0.0 - v5.24.x
The upgrade will result in an automatic schema change that will require database downtime. Below are the estimated downtime durations for version that require significant downtime:
The v5.3.0 schema change may take more than an hour to complete depending on the amount of data in your reporting system.
The v5.6.0 schema change may take 2 hours or more depending on the amount of data in your system.
The v5.11.x schema change will take approximately 1-2 minutes to complete for every 1 million vulnerable artifacts in your reporting system.
If your Anchore Enterprise deployment is on FIPS enabled hosts and your database is being hosted on Amazon RDS, an upgrade to Postgres 16 or greater is required. For more information please see the FIPS section in Requirements.
Minimum recommended memory for the Analyzer and Policy Engine services has been increased from 8GB to 16GB to better support the performance improvements in the new image analysis system. See the Deployment Requirements Documentation for more information.
Archived Images
Images archived prior to Anchore Enterprise v4.0.0 can no longer be restored into the active dataset. Please ensure that any required archived images are restored prior to upgrading to v5.25.0.
Fixes
Windows image analysis is working correctly in 5.25.x. However, to prepare for future release of v6.0.0 and improvements
in vulnerability scanning, we have made a small metadata change to properly capture the windows analysis output in the format
that will be expected. This change includes using the correct package type name of “msrc-kb” which is stored internally.
Fixes an issue where the catalog service fails to parse valid OCI image manifests that contained annotation fields on layers.
This causes a validation error (value is not a valid list) when the annotations field on manifest layers was a map (as per the OCI spec)
rather than a list. Images affected by this bug would repeatedly fail to be fetched during repository watches, producing a cannot
fetch image digest/manifest from registry error with HTTP 400. This fix ensures that valid image manifests with layer annotations are correctly parsed and processed.
Deprecations
Support for OpenStack Swift, which is an open-source object storage system, has been deprecated. Please see Object Storage for a list of supported Object Stores.
The enterprise-gitlab-scan plugin is being deprecated in favor of using AnchoreCTL directly in your pipelines. Please see GitLab for more information on integrating Anchore Enterprise with GitLab.
The webhook system managed in the configuration file is being deprecated in favor of the more advanced notification system which can be configured to send notifications to webhook endpoints. Please see Notifications for more information on configuring notifications.
Images analyzed prior to Anchore Enterprise v4.0.0 will be updated to indicate that their analysis has failed, as Anchore Enterprise no longer supports the analysis artifacts produced prior to v4.0.0. Please ensure that any required images are re-analyzed after upgrading to v5.25.0.
Images archived prior to Anchore Enterprise v4.0.0 can no longer be restored into the active dataset. Please ensure that any required archived images are restored prior to upgrading to v5.25.0.
If upgrading from a release in the range of v5.0.0 - v5.24.x
The upgrade will result in an automatic schema change that will require database downtime. Below are the estimated downtime durations for version that require significant downtime:
The v5.3.0 schema change may take more than an hour to complete depending on the amount of data in your reporting system.
The v5.6.0 schema change may take 2 hours or more depending on the amount of data in your system.
The v5.11.x schema change will take approximately 1-2 minutes to complete for every 1 million vulnerable artifacts in your reporting system.
If your Anchore Enterprise deployment is on FIPS enabled hosts and your database is being hosted on Amazon RDS, an upgrade to Postgres 16 or greater is required. For more information please see the FIPS section in Requirements.
Minimum recommended memory for the Analyzer and Policy Engine services has been increased from 8GB to 16GB to better support the performance improvements in the new image analysis system. See the Deployment Requirements Documentation for more information.
Archived Images
Images archived prior to Anchore Enterprise v4.0.0 can no longer be restored into the active dataset. Please ensure that any required archived images are restored prior to upgrading to v5.25.0.
Fixes
Security Fix
Fixes an authenticated SQL injection vulnerability in the GraphQL Reports API CVE-2026-25076.
Anchore thanks Andrew Van Fleteren for reporting this issue.
Fixes an issue where binary hints with duplicate locations were incorrectly dropped during image analysis. A binary can
contain multiple packages at the same location, but the deduplication logic was treating these as duplicates and discarding
them.
Fixes an issue where provided Jave hints were only partially applied in the java content output. If the hint included
the origin or location fields, those were not being applied to the java content output.
Fixes an issue where policy evaluation could fail on certain images when the suid_or_guid_set trigger in the files
gate encountered a file entry with a missing file mode value, resulting in a TriggerEvaluationError.
Deprecations
Support for OpenStack Swift, which is an open-source object storage system, has been deprecated. Please see Object Storage for a list of supported Object Stores.
The enterprise-gitlab-scan plugin is being deprecated in favor of using AnchoreCTL directly in your pipelines. Please see GitLab for more information on integrating Anchore Enterprise with GitLab.
The webhook system managed in the configuration file is being deprecated in favor of the more advanced notification system which can be configured to send notifications to webhook endpoints. Please see Notifications for more information on configuring notifications.
Images analyzed prior to Anchore Enterprise v4.0.0 will be updated to indicate that their analysis has failed, as Anchore Enterprise no longer supports the analysis artifacts produced prior to v4.0.0. Please ensure that any required images are re-analyzed after upgrading to v5.25.0.
Images archived prior to Anchore Enterprise v4.0.0 can no longer be restored into the active dataset. Please ensure that any required archived images are restored prior to upgrading to v5.25.0.
If upgrading from a release in the range of v5.0.0 - v5.24.x
The upgrade will result in an automatic schema change that will require database downtime. Below are the estimated downtime durations for version that require significant downtime:
The v5.3.0 schema change may take more than an hour to complete depending on the amount of data in your reporting system.
The v5.6.0 schema change may take 2 hours or more depending on the amount of data in your system.
The v5.11.x schema change will take approximately 1-2 minutes to complete for every 1 million vulnerable artifacts in your reporting system.
If your Anchore Enterprise deployment is on FIPS enabled hosts and your database is being hosted on Amazon RDS, an upgrade to Postgres 16 or greater is required. For more information please see the FIPS section in Requirements.
Minimum recommended memory for the Analyzer and Policy Engine services has been increased from 8GB to 16GB to better support the performance improvements in the new image analysis system. See the Deployment Requirements Documentation for more information.
Archived Images
Images archived prior to Anchore Enterprise v4.0.0 can no longer be restored into the active dataset. Please ensure that any required archived images are restored prior to upgrading to v5.25.0.
New Features
Artifact Lifecycle Policy
Support for Imported SBOMs has been added to the Artifact Lifecycle Policy feature, enabling the automatic deletion of Imported SBOMs based on user-defined criteria. See Artifact Lifecycle Policies for more information.
RBAC
A new RBAC role called user-viewer has been added in the system domain. This role provides read-only access to user-related information without the ability to modify user data. This role can be assigned to users who need to view user information but should not have permissions to create, update, or delete users. See the RBAC documentation for more information.
API
Added a username query parameter to the GET /v2/accounts/users endpoint to allow filtering the user list by username.
Added a type query parameter to the GET /exp/sboms endpoint to allow filtering Imported SBOMs based on the type of SBOM. See the Anchore SBOM API Reference for more information.
Added an annotations query parameter to the GET /exp/sboms endpoint to allow filtering Imported SBOMs based on user-defined annotations. See the Anchore SBOM API Reference for more information.
Improvements
Image Analysis
Anchore Enterprise’s image analysis and vulnerability scanning engine has been updated to more directly
align with the native behaviour of Syft and Grype. This results in improved performance, accuracy, and consistency when
analyzing images, scanning for vulnerabilities, and evaluating policies. As such, you may observe differences in SBOM content
and vulnerability results when comparing images analyzed prior to v5.25 against the same image analyzed with v5.25.
Notable improvements include:
Performance during image analysis has been significantly improved. A reduction in analysis time can be seen for most images.
Data artifacts generated during image analysis have been reduced in size, resulting in object storage savings per image.
SBOMs generated via AnchoreCTL and Anchore Enterprise’s image analysis system are now more consistent with each
other, as both now use the same underlying analysis library for SBOM generation. This results in improved consistency
and accuracy of SBOM content across different workflows.
SBOMs generated from centralized analysis will now produce the full container file listing. This behavior is now
consistent with distributed analysis.
Note: The inclusion of the full container file listing will cause the size of the image SBOMs downloaded from Anchore
Enterprise to be approximately 2-3x larger.
Changing the value of the services.analyzer.enable_owned_package_filtering configuration option will now take
effect immediately for images analyzed in v5.25 and later. Previously, this setting only took effect after re-analysis of an image.
The new image analysis system is designed to be fully backward compatible with existing images. This means that:
All existing images will continue to function as normal, with no re-analysis required. An image re-analysis
is only required if you want to take advantage of the improved analysis and scanning capabilities for existing images.
Newly analyzed images will automatically benefit from the improved analysis and scanning capabilities.
Metrics
Several new prometheus metrics have been added to provide visibility into the performance of the new image analysis system. See the Prometheus Documentation for more information on using prometheus with Anchore Enterprise.
Updated the descriptions of the vendor_only and will_not_fix query parameters in the reporting and policy APIs to better clarify their behavior. See the Anchore Enterprise API Reference for more information.
Fixes
Fixed an issue where updates to Kubernetes inventory cluster names were not being captured correctly.
Fixed an issue where some Debian based images were not being correctly identified during image analysis.
Fixed an issue where deleting a base image could cause errors when retrieving policy evaluation results for child images.
Fixed an issue where some Red Hat Universal Base Image (UBI) based images were not being correctly identified during image analysis.
Fixed an issue where the epss_score filter was not applied correctly when retrieving a vulnerability CSV file for an Imported SBOM or SBOM Group.
Fixed an issue when updating license overrides via the PUT /exp/system/package-overrides/licenses API where not all fields would be updated correctly.
Improved error handling when attempting to create an Account with a conflicting name, returning a 409 Conflict response code instead of a 400 Bad Request.
Fixed an issue where the matched_on_cpes value returned by the Image Vulnerabilities API could be "None" instead of an empty list when no CPEs were matched.
Deprecations
Support for OpenStack Swift, which is an open-source object storage system, has been deprecated. Please see Object Storage for a list of supported Object Stores.
The enterprise-gitlab-scan plugin is being deprecated in favor of using AnchoreCTL directly in your pipelines. Please see GitLab for more information on integrating Anchore Enterprise with GitLab.
The webhook system managed in the configuration file is being deprecated in favor of the more advanced notification system which can be configured to send notifications to webhook endpoints. Please see Notifications for more information on configuring notifications.
Images analyzed prior to Anchore Enterprise v4.0.0 will be updated to indicate that their analysis has failed, as Anchore Enterprise no longer supports the analysis artifacts produced prior to v4.0.0. Please ensure that any required images are re-analyzed after upgrading to v5.25.0.
Images archived prior to Anchore Enterprise v4.0.0 can no longer be restored into the active dataset. Please ensure that any required archived images are restored prior to upgrading to v5.25.0.
UI Updates
Improvements
Within Imported SBOMs:
When viewing vulnerabilities associated with an Imported SBOM or SBOM Group, the following new filter options are now available:
The previous Minimum Severity filter has been replaced with a Severity filter that supports selecting one or more severities
A Minimum EPSS Score filter
A KEV status filter to find vulnerabilities that either are or are not on the KEV list
When uploading an SBOM, users can now select the Type of SBOM in question, in order to provide more clarity as to what the SBOM represents
SBOM lists now offer more flexible filter options, including filtering by SBOM Name, Version, and Type. The previous table search, which would filter by SBOM Name, has been removed in favor of these new controls
SBOM lists now include an Annotations column, displaying a truncated list of annotations for each SBOM (if defined). The cell shows as many annotations as can fit onto one line, with the remainder shown in a popup on hover.
Within System:
The Custom Message configuration setting has now been enabled for editing in the UI. Message content can be defined using markdown to allow for custom formatting, but it is sanitized to prevent any malicious HTML content from being injected.
Fixes
Fixed an issue where exporting SBOM Compliance data could possibly include stale Evaluation Problems data after switching Policy
When switching Policy Preview in SBOM Compliance, any previously applied filters are now reset. This ensures that the full evaluation data is presented, avoiding possible confusion from filters that are no longer relevant in the context of the applied Policy.
Fixed an issue where partial configuration values from multiple sources (environment variables and config file) were not being properly merged for configs that support this capability. For example, setting ANCHORE_AUTHENTICATION_LOCK_COUNT via environment variable and expires via config-ui.yaml now correctly produces a merged configuration. The UI also now displays improved messaging when configurations come from mixed sources or when incomplete configurations are detected.
Fixed an issue where checkboxes for nullable configuration fields did not accurately reflect the active state when a default value was being applied. Additionally, toggling a checkbox off and back on now preserves the user-entered value instead of reverting to the default.
Fixed an issue where UI database migrations could fail unexpectedly. We believe this has only affected our internal testing environments. However, if you have noticed migration errors in your logs during application startup, it should now be resolved. Please reach out to Anchore Support if you continue to experience issues.
Fixed an issue where the OS Packages filter for the vulnerability results in Artifact Analysis table did not correctly include Windows KB vulnerabilities. The filter now properly includes all OS package types (Windows KB, Nix, and ALPM) alongside the previously supported types (Debian, Alpine, and RPM).
Various supporting libraries have been updated in order to improve security, performance, and also to remove deprecation warnings from browser and server output logs. Redundant libraries have been removed to reduce the app startup time and overall size.
If upgrading from a release in the range of v5.0.0 - v5.23.x
The upgrade will result in an automatic schema change that will require database downtime. Below are the estimated downtime durations for version that require significant downtime:
The v5.3.0 schema change may take more than an hour to complete depending on the amount of data in your reporting system.
The v5.6.0 schema change may take 2 hours or more depending on the amount of data in your system.
The v5.11.x schema change will take approximately 1-2 minutes to complete for every 1 million vulnerable artifacts in your reporting system.
If your Anchore Enterprise deployment is on FIPS enabled hosts and your database is being hosted on Amazon RDS, an upgrade to Postgres 16 or greater is required. For more information please see the FIPS section in Requirements.
Fixes
Fixed an issue where the Artifact Location column in Runtime/Inventory reports incorrectly displayed the Artifact PURL
value instead of the actual artifact location path.
Deprecations
Support for OpenStack Swift, which is an open-source object storage system, has been deprecated. Please see Object Storage for a list of supported Object Stores.
The enterprise-gitlab-scan plugin is being deprecated in favor of using AnchoreCTL directly in your pipelines. Please see GitLab for more information on integrating Anchore Enterprise with GitLab.
The webhook system managed in the configuration file is being deprecated in favor of the more advanced notification system which can be configured to send notifications to webhook endpoints. Please see Notifications for more information on configuring notifications.
If upgrading from a release in the range of v5.0.0 - v5.23.x
The upgrade will result in an automatic schema change that will require database downtime. Below are the estimated downtime durations for version that require significant downtime:
The v5.3.0 schema change may take more than an hour to complete depending on the amount of data in your reporting system.
The v5.6.0 schema change may take 2 hours or more depending on the amount of data in your system.
The v5.11.x schema change will take approximately 1-2 minutes to complete for every 1 million vulnerable artifacts in your reporting system.
If your Anchore Enterprise deployment is on FIPS enabled hosts and your database is being hosted on Amazon RDS, an upgrade to Postgres 16 or greater is required. For more information please see the FIPS section in Requirements.
Fixes
Fixed an issue where policy evaluations on child images would fail with a 404 error when the base (parent) image data
was deleted from the policy engine but the ancestry linkage remained in the catalog. The policy engine now gracefully
handles missing base image data during policy evaluation. Child images can be evaluated successfully even when the base
image data is unavailable in the policy engine, maintaining the expected policy evaluation workflow.
Deprecations
Support for OpenStack Swift, which is an open-source object storage system, has been deprecated. Please see Object Storage for a list of supported Object Stores.
The enterprise-gitlab-scan plugin is being deprecated in favor of using AnchoreCTL directly in your pipelines. Please see GitLab for more information on integrating Anchore Enterprise with GitLab.
The webhook system managed in the configuration file is being deprecated in favor of the more advanced notification system which can be configured to send notifications to webhook endpoints. Please see Notifications for more information on configuring notifications.
If upgrading from a release in the range of v5.0.0 - v5.23.x
The upgrade will result in an automatic schema change that will require database downtime. Below are the estimated downtime durations for version that require significant downtime:
The v5.3.0 schema change may take more than an hour to complete depending on the amount of data in your reporting system.
The v5.6.0 schema change may take 2 hours or more depending on the amount of data in your system.
The v5.11.x schema change will take approximately 1-2 minutes to complete for every 1 million vulnerable artifacts in your reporting system.
If your Anchore Enterprise deployment is on FIPS enabled hosts and your database is being hosted on Amazon RDS, an upgrade to Postgres 16 or greater is required. For more information please see the FIPS section in Requirements.
Fixes
Addresses an issue with the event type filter in the /v2/events endpoint not working as expected. It will now correctly filter events for system.dataset.
Deprecations
Support for OpenStack Swift, which is an open-source object storage system, has been deprecated. Please see Object Storage for a list of supported Object Stores.
The enterprise-gitlab-scan plugin is being deprecated in favor of using AnchoreCTL directly in your pipelines. Please see GitLab for more information on integrating Anchore Enterprise with GitLab.
The webhook system managed in the configuration file is being deprecated in favor of the more advanced notification system which can be configured to send notifications to webhook endpoints. Please see Notifications for more information on configuring notifications.
If upgrading from a release in the range of v5.0.0 - v5.23.x
The upgrade will result in an automatic schema change that will require database downtime. Below are the estimated downtime durations for version that require significant downtime:
The v5.3.0 schema change may take more than an hour to complete depending on the amount of data in your reporting system.
The v5.6.0 schema change may take 2 hours or more depending on the amount of data in your system.
The v5.11.x schema change will take approximately 1-2 minutes to complete for every 1 million vulnerable artifacts in your reporting system.
If your Anchore Enterprise deployment is on FIPS enabled hosts and your database is being hosted on Amazon RDS, an upgrade to Postgres 16 or greater is required. For more information please see the FIPS section in Requirements.
New Features
Chainguard Library Support
Anchore Enterprise provides the functionality to exclude vulnerabilities against components that have been marked as unaffected by their provider.
Imported SBOM Policy Evaluation
Policy now supports a new artifact type of sbom for evaluating imported SBOMs against policies. This allows users
to create policies that specifically target SBOM imports and evaluate them based on vulnerability criteria.
Vulnerability gate supports package, denylist, and stale feed data triggers for SBOM artifacts.
New endpoint GET /exp/sboms/{sbom_uuid}/check has been added to allow users to check the policy evaluation status of an imported SBOM.
CIS 1.8 Policy
A new Anchore CIS Docker Benchmark V1.8.0 Policy has been included in this release. Any new accounts created after
the release of v5.24.0 will automatically have this policy applied. Existing accounts can manually add this policy via
the UI or API. Please see CIS Docker Benchmark Policy
for more information on this policy pack.
Matched CPEs in Vulnerability Findings
Vulnerability findings returned from the GET /v2/images/{image_id}/vuln, GET /v2/vulnerability-scan, and
GET /v2/scan (used as part of anchorectl image one-time-scan command) endpoints now include a matched_on_cpes field.
This field contains a list of CPEs that were matched for the vulnerable package, providing more context around how
the vulnerability was identified.
Improvements
A new System Statistic image_reanalysis is being tracked. This is available via the GET /v2/system/statistics endpoint and in the UI System Statistics page. This statistic tracks the number of images that have been reanalyzed.
Imported SBOM type field will default to unknown when the user does not provide a type during the import process.
The GET /v2/stig-profiles endpoint is no longer restricted to users with full-control or system-admin RBAC
roles. The endpoint continues to require a proper license entitlement.
Fixes
Provides a clear error messages when trying to add an image with an unsupported media type. (i.e. application/vnd.docker.ai.model.config.v0.1+json, or application/vnd.in-toto+json)
AWS SOCI images are properly rejected by Anchore Enterprise as they are not truly images.
Addresses an issue where the internal service SSL verify_cert value was not being respected for the API to Report Service communication.
Improved handling of PURLs that contain qualifiers to ensure proper parsing and processing.
Audit log entry now correctly captures POST /v2/oauth/token requests.
The Policy vulnerability gate package trigger with known exploited vulnerability parameter set to False will
correctly produce policy findings for vulnerabilities that are NOT on the KEV list.
Deprecations
Support for OpenStack Swift, which is an open-source object storage system, has been deprecated. Please see Object Storage for a list of supported Object Stores.
The enterprise-gitlab-scan plugin is being deprecated in favor of using AnchoreCTL directly in your pipelines. Please see GitLab for more information on integrating Anchore Enterprise with GitLab.
The webhook system managed in the configuration file is being deprecated in favor of the more advanced notification system which can be configured to send notifications to webhook endpoints. Please see Notifications for more information on configuring notifications.
UI Updates
Improvements
Within Imported SBOMs:
When viewing vulnerabilities associated with an SBOM or SBOM Group, the Last Found filter now supports two new preset options of 270 and 365 days, alongside a custom date range.
Individual SBOMs can be evaluated against policies containing SBOM-specific rule sets and mappings, with results displayed in a similar manner to image policy evaluations under the Compliance tab.
Within Policies:
The annotation_status policy parameter now displays as a multi-select dropdown in the Policy Editor, allowing users to select multiple VEX annotations statuses (affected, fixed, not_affected, under_investigation) when configuring policy rules,
Policies can now be formulated to apply to Imported SBOMs. To do so, simply create an SBOM-specific rule set and add mappings to match the rule set to the SBOMs you want to evaluated, by specifying the SBOM name and version (with wildcard pattern support).
Within System:
The System > Configuration view now provides comprehensive viewing and editing of UI-specific configuration items. Administrators can now set optional UI configurations directly through the web interface when not already defined via config-ui.yaml or environment variables, eliminating the need to modify deployment configurations for runtime adjustments.
Each setting displays helpful metadata including the config-ui.yaml key and environment variable name, providing clear guidance on all available configuration methods.
This enhancement brings parity to configuration management across both UI and Platform service settings.
Administrators can now configure the session timeout duration ot align with their organization’s security policies. The new session_timeout setting (configurable via config-ui.yaml, ANCHORE_SESSION_TIMEOUT environment variable, or System > Configuration) specifies the maximum idle time in seconds before automatic session termination.
The timeout implements rolling session behavior, meaning any user activity - including page refreshes, API calls, or navigation - resets the countdown timer.
The minimum configurable value is 60 seconds to prevent accidental account lockout, with no maximum limit.
When not configured, the default remains 14 days (1,209,600 seconds) for backward compatibility.
Note that configuration changes only affect new client sessions created after a change is made; existing active sessions retain their original timeout value until the user re-authenticates.
The System > Usage view now displays an image_reanalysis metric in the Total SBOMs card. It is also available for download alongside other usage metrics. This allows for separate tracking of initial image scans vs. forced reanalyses of existing images.
Fixes
If the reports_uri setting is removed from config-ui.yaml or the ANCHORE_REPORTS_URI environment variable is unset ,the Reports feature (and any reports-related UI components) should become inaccessible in the UI. A regression in a previous release caused these components to remain accessible even when this configuration was removed. Now fixed.
Note that this configuration is deprecated and will be replaced with a boolean setting in a future major release.
A quick-paced user could sometimes open the Annotation Status form before the status had been set via the table dropdown, leading to an error when trying to save the details. The button is now disabled until the update is complete.
Application startup no longer fails when the configured log directory is unavailable or has incorrect permissions. The application now starts successfully in console-only logging mode and automatically enables file logging when the directory becomes accessible.
Optional health monitoring (configured via log_dir_retry_interval) provides bidirectional protection - detecting both when unavailable directories become accessible and when previously accessible directories become unavailable - ensuring continuous logging without manual intervention or application restarts.
After failing to create an SBOM Group (for example, because of a duplicate name), the error was incorrectly retained and displayed again the next time another SBOM Group was created. It is now cleared upon closing the form.
Various supporting libraries have been updated in order to improve security, performance, and also to remove deprecation warnings from browser and server output logs. Redundant libraries have been removed to reduce the app startup time and overall size.
If upgrading from a release in the range of v5.0.0 - v5.22.x
The upgrade will result in an automatic schema change that will require database downtime. Below are the estimated downtime durations for version that require significant downtime:
The v5.3.0 schema change may take more than an hour to complete depending on the amount of data in your reporting system.
The v5.6.0 schema change may take 2 hours or more depending on the amount of data in your system.
The v5.11.x schema change will take approximately 1-2 minutes to complete for every 1 million vulnerable artifacts in your reporting system.
If your Anchore Enterprise deployment is on FIPS enabled hosts and your database is being hosted on Amazon RDS, an upgrade to Postgres 16 or greater is required. For more information please see the FIPS section in Requirements.
GET /v2/images/{image_digest}/vuln/{vuln_type}/cyclonedx-json
GET /v2/images/{image_digest}/vuln/{vuln_type}/cyclonedx-xml
The resulting document contains the set of vulnerabilities satisfying the given request parameters and the set of components (packages) affected by those vulnerabilities.
Enforce Gates are now available via the One Time scan feature
This includes the following gates, as before these gates are configured the same as other image gates in your policy, and existing policies with these gates will now start evaluating them for One Time scans.
GET /v2/sources{source_id}/sbom/native-json endpoint will now also return the file data on newly imported sources.
GET /exp/sboms/{sbom_uuid}/packages response object now provides the PURL field.
VEX now provides generated documents in the CycloneDX formats
GET /v2/images/{image_digest}/vex/cyclonedx-json
GET /v2/images/{image_digest}/vex/cyclonedx-xml
Fix Observed at Date
This date previously indicated when the deployment first observed that a fix for a vulnerability was available.
This date is now provided by our vulnerability_db which is received from the Anchore Data Service. It is no longer
calculated within your deployment.
The change provides a single source of truth across all deployments.
On upgrade, the system will remove policy_engine_vulnerabilities_metadata and policy_engine_vulnerabilities_package_fix_metadata
tables from your database as this data will no longer be utilized.
GET /v2/images/{image_digest}/vuln/all response now includes suggested_fix_version which will help inform which
fix version was used to determine the fix_observed_at date.
STIG Profiles
The STIG Profiles are now available from the Anchore Data Service. The change allows Anchore to update them as the need arises instead
of waiting for the next release cycle.
You will see a new dataset called stig_profiles_db after updating your deployment.
The STIG Profiles will be retrieved from your enterprise deployment by AnchoreCTL using the same commands.
The GET /v2/stig-profiles API endpoint was added in support of this workflow.
Please see AnchoreCTL Release Notes for more information.
Access to the Anchore supported STIG Profiles requires an entitlement. If you are interested in learning more about Anchore STIG support, please contact Anchore Customer Success.
Prometheus Metrics
Adds Prometheus metrics that track the number and size of objects by type stored in the Object Store.
anchore_object_store_bucket_object_count
anchore_object_store_total_bucket_size
Fixes
When setting the configuration option of services.policy_engine.vulnerabilities.nvd_fallback_to_secondary_cvss to true,
the GET /v2/query/vulnerabilities endpoint returns the correct value for is_kev.
Fixes a typo in the Anchore NIST 800-190 v20250101 policy pack name.
The system.analyzer.clamav_sync.completed event is sent only when a new clamav_db has been synced with the analyzer. Previously it was occurring every minute.
Fixes an issue where GET /v2/images/{image_digest}/sboms endpoint failed to retrieve the sbom when provided with the parent digest.
Addresses an issue where the removal of a VEX annotation did not immediately get reflected in the image vulnerability data.
Deprecations
Support for OpenStack Swift, which is an open-source object storage system, has been deprecated. Please see Object Storage for a list of supported Object Stores.
The enterprise-gitlab-scan plugin is being deprecated in favor of using AnchoreCTL directly in your pipelines. Please see GitLab for more information on integrating Anchore Enterprise with GitLab.
The webhook system managed in the configuration file is being deprecated in favor of the more advanced notification system which can be configured to send notifications to webhook endpoints. Please see Notifications for more information on configuring notifications.
UI Updates
Improvements
Within Imported SBOMs, a new Package URL (PURL) column has been added to the Contents table, positioned after the Version column. This provides identifiers for better package identification and traceability across different ecosystems.
Within Image Analysis > Vulnerabilities:
The pie chart breakdown by vulnerability severity has been replaced by simpler linear metrics for faster insights at-a-glance. They display four key dimensions: severity distribution, EPSS Score ranges, KEV status, and fix availability.
A new Filters button has been introduced which offers more options and a more intuitive and controlled way to filter the vulnerability data in the table.
Vulnerability data can now be exported in VDR and VEX formats. These new options are available alongside the existing data export within a new dialog launched via the Export button above the table.
Vulnerability annotators are now provided with additional detail in the tooltip shown in the Annotation Status column header, guiding them toward recommended completion of the annotation form.
Within Reports, various vulnerability-related report templates now include EPSS Score, KEV, PURL, and Annotation Status fields and filters for assessing risk.
We’ve also enhanced session management to improve automatic logout on session expiry.
Fixes
Fixed an issue with SSO redirect error pages returning unstyled.
Fixed validation to allow relative paths (e.g., /swagger/, /grafana/) alongside absolute URLs in Custom Links configuration.
Various supporting libraries have been updated in order to improve security, performance, and also to remove deprecation warnings from browser and server output logs. Redundant libraries have been removed to reduce the app startup time and overall size.
13.1.13 - Anchore Enterprise Release Notes - Version 5.22.0
Anchore Enterprise v5.22.0
v5.22.x Compatibility for Air-gapped Users
Air-gapped users of Anchore Enterprise 5.22.x need to ensure that they are using the same/supported version of AnchoreCTL with Anchore Enterprise for all airgap workflows, this is due to a new dataset format for ClamAV. It is important to immediately upload the new dataset upon upgrade.
If upgrading from a release in the range of v5.0.0 - v5.21.x
The upgrade will result in an automatic schema change that will require database downtime. Below are the estimated downtime durations for version that require significant downtime:
The v5.3.0 schema change may take more than an hour to complete depending on the amount of data in your reporting system.
The v5.6.0 schema change may take 2 hours or more depending on the amount of data in your system.
The v5.11.x schema change will take approximately 1-2 minutes to complete for every 1 million vulnerable artifacts in your reporting system.
If your Anchore Enterprise deployment is on FIPS enabled hosts and your database is being hosted on Amazon RDS, an upgrade to Postgres 16 or greater is required. For more information please see the FIPS section in Requirements.
New Features
Vulnerability Annotation and Vulnerability Exploitability eXchange (VEX)
Vulnerability Annotation support has been added for image vulnerabilities. This provides the user the ability to annotate a
vulnerability with the result of their assessment, including comments, capturing notes, remediation guidance, or a hyperlink
to an external system record (e.g., a Jira issue), in order to facilitate remediation work.
A Vulnerability Exploitability eXchange (VEX) document can be generated per image via the API endpoint GET /v2/images/{image_digest}/vex/openvex.
Policyvulnerability Gate’s package Trigger now has new options for missing annotation and/or annotation status.
Vulnerability annotations are viewable by any user with the ability to listImages such as RBAC Role read-only. The ability to
create, modify and delete vulnerability annotations are restricted to users with a new RBAC Role called vuln-annotator-editor.
ClamAV will EOL versions 1.0.x on November 28, 2025.
Anchore Enterprise v5.22.0 has upgraded to ClamAV version 1.4.x. In doing so, Anchore Data Service is now providing a new ClamAV Database (v2).
ClamAV has stated that their previous database will no longer be updated with new virus signatures. Therefore, it is
critical that you update to Anchore Enterprise v5.22.0 if you are using our malware detection feature.
If your deployment is using the data-syncer service with internet connectivity, you need only to update to Anchore Enterprise v5.22.0. The new
ClamAV database will automatically be synced with your deployment.
If your deployment is using the data-syncer service in Air Gap Mode, it is critical that you run the Air Gap workflow as soon as your
deployment has completed upgrade. Please note: you must use the AnchoreCTL versioned v5.22.0 to ensure you get the correct datasets.
Reports
Now contain an indication that the Vulnerability is on the KEV List.
Policy
The vulnerability gate’s package trigger now has an known exploited vulnerability option. This option allows a trigger to fire
only when the vulnerability is found on the CISA KEV List.
The prior vulnerability gate’s kev list trigger has been deprecated.
The vulnerability gate vulnerability data unavailable trigger has improved messaging when handling a distroless image.
API
The following endpoint’s vulnerability response object will now include the PURL
GET /v2/images/{image_digest}/vuln/{vuln_type}
GET /v2/sources/{source_id}/vuln/{vuln_type}
POST /v2/vulnerability-scan
POST /v2/scan
Within the experimental API endpoints, the PURL is now returned
GET /exp/sboms/{sbom_uuid}/vulnerabilities/detail-cvs
GET /exp/sbom-groups/{group_uuid}/vulnerabilities/detail-cvs
RHEL EUS support indication is now available for the one-time-scan commands.
POST /v2/vulnerability-scan
POST /v2/scan
Additional metadata is now available in the analysis_status_detail, including the analysis_engine and enterprise_version.
GET /v2/images/{image_digest
Object Store Access
The deployment can now be configured to allow all services to directly access the object store. The previous and current default behavior is to
route all object store access via the Catalog service. To change your deployment so that services have direct access, please update the
configuration setting object_store.direct_access in your helm values file. After enabling this setting and restarting your cluster, you can verify that the configuration
change was successful by observing the following messages at startup
MS Teams will be EOL the entire O365 Connectors service in Teams by the end of 2025. Anchore Enterprise is now ready
to handle the new workflow. For more information on this change, please visit MSFT Teams Connector.
Fixes
Dataset upload events are now generated when in air gap mode and using AnchoreCTL to upload the datasets.
Improvements when comparing patch versions of the form 4.2.8p14 during stateless vulnerability scans.
Removes confusing error logs seen while running an object store migration.
When deleting a scheduled report execution either individually or as part of the entire scheduled report, the objects
are now correctly removed from the object store.
Fixes an issue for some RPM packages where the Fix Observed at Date could not be consistently identified due to a naming normalization oversight.
Handles an Ubuntu format change which caused a Fix Observed at Date inconsistency to be seen as the analysis time. The Ubuntu format changed from 24.04 to 24.4.
Fixes the example descriptions for the vulnerability Gate package Trigger for epss score and epss percentile optional parameters.
Fixes the response data of GET /v2/query/vulnerabilities when the namespace of NVD is specified.
Deprecations
Support for OpenStack Swift, which is an open-source object storage system, has been deprecated. Please see Object Storage for a list of supported Object Stores.
The enterprise-gitlab-scan plugin is being deprecated in favor of using AnchoreCTL directly in your pipelines. Please see GitLab for more information on integrating Anchore Enterprise with GitLab.
The webhook system managed in the configuration file is being deprecated in favor of the more advanced notification system which can be configured to send notifications to webhook endpoints. Please see Notifications for more information on configuring notifications.
UI Updates
Improvements
Within Artifact Analysis > Vulnerabilities, the Vulnerability Report (both CSV and JSON) that can be downloaded now includes the EPSS score and percentile, as well as the KEV flag.
Images analyzed with Red Hat Enterprise Linux (RHEL) Extended Update Support now display clear visual indicators in the Artifact Analysis header. The EUS label shows whether extended support was detected in the image and if it was used during vulnerability scanning. Multiple states are supported including annotation-based overrides, with detailed tooltips explaining the impact on vulnerability results. This helps users understand when EUS affects their security assessments.
Added comprehensive VEX (Vulnerability Exploitability eXchange) support through a new vulnerability annotation form in the Artifact Analysis > Vulnerabilities tab. Users can now create and edit vulnerability annotations directly from the image analysis view, set annotation statuses, and add optional details such as action statements and justifications. The form includes proper permission handling with read-only tooltips for users without annotation permissions and full editing capabilities for authorized users.
The View Incomplete Analyses modal now includes clickable hyperlinks on Full Tag values that navigate directly to the corresponding images section.
The Artifact Analysis > SBOM tab has been renamed to Contents.
Package URLs (PURL) are now supported through Artifact Analysis. PURLs are now displayed in the Package Detail popover within the Vulnerabilities table, and a dedicated PURL column has been added to the Contents table for improved package identification and traceability across different ecosystems.
SBOM Groups can now be edited after creation. Users can modify the group name, version, and description through selecting Edit Group in the Actions dropdown.
By default, Artifact Lifecycle Policies (ALP) or retention policies apply only to images that were successfully analyzed. A new option now allows users to specify that a retention policy should also include images that failed analysis.
A new Associated Accounts column has been added to the Users list to display at a glance all the accounts each user has access to and, on hover over an account name, the user’s roles within that account.
The System Status indicator shown alongside the System item in the side navigation now has a tooltip describing the current status for improved clarity. A loading icon is also shown while the status is still resolving.
Fixes
Fixes a styling issue with table column headers that made the border between them invisible.
When accounts are disabled or users deleted, active sessions are now instantly logged out. This eliminates confusing ‘unauthorized’ errors that previously appeared if they continued to navigate the application.
Various supporting libraries have been updated in order to improve security, performance, and also to remove deprecation warnings from browser and server output logs. Redundant libraries have been removed to reduce the app startup time and overall size.
If upgrading from a release in the range of v5.0.0 - v5.20.x
The upgrade will result in an automatic schema change that will require database downtime. Below are the estimated downtime durations for version that require significant downtime:
The v5.3.0 schema change may take more than an hour to complete depending on the amount of data in your reporting system.
The v5.6.0 schema change may take 2 hours or more depending on the amount of data in your system.
The v5.11.x schema change will take approximately 1-2 minutes to complete for every 1 million vulnerable artifacts in your reporting system.
If your Anchore Enterprise deployment is on FIPS enabled hosts and your database is being hosted on Amazon RDS, an upgrade to Postgres 16 or greater is required. For more information please see the FIPS section in Requirements.
New Features
Redhat Enterprise Linux (RHEL) Extended Update Support (EUS)
Anchore Enterprise now supports the use of RHEL EUS data when scanning relevant container images for vulnerabilities.
CISA Known Exploitable Vulnerabilities (KEV) Database and Exploit Prediction Scoring System (EPSS) Database
are no longer downloaded by the data-syncer service. These datasets continue to be required:
Vulnerability Database
Vulnerability Match Exclusions Database
ClamAV malware Database
The KEV and EPSS data are now sourced directly from the Vulnerability Database provided by the Anchore Data Service.
As this change eliminates additional database queries, some users may see an improvement in the performance of vulnerability scans.
KEV and EPSS data
Now available in the response to the following endpoints:
GET /v2/images/{image_digest}/vuln
GET /v2/sources/{source_id}/vuln
The Policy Trigger kev list data missing has been deprecated
Artifact Lifecycle Policies
Adds support for selecting images that are in a failed analysis state for deletion.
Improves text formatting of notifications related to Anchore SBOM.
SBOMs added to your system via Anchore SBOM will now be counted towards your Total SBOM Usage shown in the Enterprise UI.
Policy
Concurrency of Policy Engine workers has been improved to better handle large volumes of simultaneous vulnerability scans.
Improves the /v2/sources/{source_id}/check API error response when called with an invalid Policy ID.
API
The description of expected status codes for all endpoints in the API documentation has been updated and improved.
Fixes
Resolves an issue where recursive Nix package dependencies could cause image analysis to fail.
Resolves an issue where signed images added to Anchore Enterprise from a Harbor registry could fail to analyze.
Resolves an erroneous STOP warning when evaluating Busybox images against the DISA policy pack.
Resolves an issue Azul JDK packages could be misidentified as Oracle JDK packages during image analysis.
Resolves an issue where passwd_file gates could fail to be evaluated for some images.
Resolves an issue where exposed_ports triggers could fail to identify exposed ports listed in the Docker History.
Resolves an issue where large datasets from the Anchore Data Service could fail to be added to the Enterprise database.
Resolves a STIG evaluation issue for the UBI 8 profile.
Resolves an issue with the db_echo database configuration option not being applied correctly.
Resolves an issue with Events relating to Policy Evaluation updates not being recorded correctly.
Resolves an issue when archiving images with policy evaluation records.
Deprecations
Support for OpenStack Swift, which is an open-source object storage system, has been deprecated. Please see Object Storage for a list of supported Object Stores.
The enterprise-gitlab-scan plugin is being deprecated in favor of using AnchoreCTL directly in your pipelines. Please see GitLab for more information on integrating Anchore Enterprise with GitLab.
The webhook system managed in the configuration file is being deprecated in favor of the more advanced notification system which can be configured to send notifications to webhook endpoints. Please see Notifications for more information on configuring notifications.
UI Updates
Improvements
Vulnerabilities that are on the CISA Known Exploited Vulnerabilities (KEV) catalog are now clearly marked with a red warning indicator within both the Artifact Analysis > Vulnerabilities and the Imported SBOMs > Vulnerabilities tabs.
The Exploit Prediction Scoring System (EPSS) score and percentile are now displayed for each detected vulnerability within both the Artifact Analysis > Vulnerabilities and the Imported SBOMs > Vulnerabilities tabs.
The CVSS Score filter within the Imported SBOMs > Vulnerabilities tabs now includes a number input field alongside the existing slider. Users can now set precise minimum CVSS scores by typing exact values (e.g., “7.5”) in addition to using the visual slider control.
Fixes
The System > Accounts view for administrators has been fixed to reduce resource usage at scale.
Deleting an account via the API did not remove its associated LDAP mapping, which caused an error that prevented the System > LDAP page from loading correctly. This has been fixed.
Fixed an issue for the account-user-admin role where the Account view attempted to access User Groups data, to which they do not have the required permissions.
Sometimes, while loading the contents of large SBOMs, an empty list of packages would be displayed for a short time, until loading was completed. We now correctly display a progress loader instead.
Fixed an issue where navigating to invalid SBOM sub-tab URLs would display a blank page. Invalid tabs now automatically redirect to the summary tab.
When displaying a list of images that spans several pages, deleting the last image of a page caused the list of images to be empty until the page was fully refreshed. We now switch to the previous page instead.
Attempting to remove several account roles from a user group at one time failed to remove them all. That is now fixed.
The name of a user group was previously limited to 50 characters, which was too restrictive for some use cases. We have lifted the limit to 128 characters.
New validation has been added to user groups to prevent the creation of groups that lack both system-wide and account-specific roles, or that specify an account without assigning any roles to it.
In multi-page tables, the selected page now consistently resets to the first page when sorting is changed. This behavior was already present in some tables, but it’s now applied uniformly across the app.
Fixed an issue where switching account context from the Policy Compliance view in Artifact Analysis would cause an error and crash the page.
Fixed an issue where the Image Ancestry popup in the Artifact Analysis > Image Metadata view would not display data correctly when the image had multiple ancestors.
Fixed an issue where the “Fix Observed At” column in the vulnerability table was not sorting correctly. The column now sorts dates in descending chronological order (newest to oldest) with proper handling of null values.
Fixed an issue where the Compliance column in the Kubernetes > Images table was not correctly mapping to the reason value.
Fixed an issue where the Watch Toggle in the Kubernetes > Clusters view would toggle multiple times when clicking it to disable watching a cluster. The toggle now correctly disables watching with a single click.
Fixed a race condition where toast notifications for the same type of action could cause it to be dismissed instead of replaced.
Various supporting libraries have been updated in order to improve security, performance, and also to remove deprecation warnings from browser and server output logs. Redundant libraries have been removed to reduce the app startup time and overall size.
13.1.15 - Anchore Enterprise Release Notes - Version 5.20.2
Anchore Enterprise v5.20.2
v5.20.x Compatibility for Air-gapped Users
Air-gapped users of Anchore Enterprise 5.20.x need to ensure that they are using the same/supported version of AnchoreCTL with Anchore Enterprise for all airgap workflows, this is due to a new dataset format for vulnerability data (GrypeDB v6). It is important to immediately upload the new dataset upon upgrade.
If upgrading from a release in the range of v5.0.0 - v5.19.x
The upgrade will result in an automatic schema change that will require database downtime. Below are the estimated downtime durations for version that require significant downtime:
The v5.3.0 schema change may take more than an hour to complete depending on the amount of data in your reporting system.
The v5.6.0 schema change may take 2 hours or more depending on the amount of data in your system.
The v5.11.x schema change will take approximately 1-2 minutes to complete for every 1 million vulnerable artifacts in your reporting system.
If your Anchore Enterprise deployment is on FIPS enabled hosts and your database is being hosted on Amazon RDS, an upgrade to Postgres 16 or greater is required. For more information please see the FIPS section in Requirements.
Fixes
Enables the Data Syncer Service to handle Anchore datasets without size limitations, ensuring reliable storage and retrieval.
Deprecations
Support for OpenStack Swift, which is an open-source object storage system, has been deprecated. Please see Object Storage for a list of supported Object Stores.
The enterprise-gitlab-scan plugin is being deprecated in favor of using AnchoreCTL directly in your pipelines. Please see GitLab for more information on integrating Anchore Enterprise with GitLab.
The webhook system managed in the configuration file is being deprecated in favor of the more advanced notification system which can be configured to send notifications to webhook endpoints. Please see Notifications for more information on configuring notifications.
13.1.16 - Anchore Enterprise Release Notes - Version 5.20.1
Anchore Enterprise v5.20.1
v5.20.x Compatibility for Air-gapped Users
Air-gapped users of Anchore Enterprise 5.20.x need to ensure that they are using the same/supported version of AnchoreCTL with Anchore Enterprise for all airgap workflows, this is due to a new dataset format for vulnerability data (GrypeDB v6). It is important to immediately upload the new dataset upon upgrade.
If upgrading from a release in the range of v5.0.0 - v5.19.x
The upgrade will result in an automatic schema change that will require database downtime. Below are the estimated downtime durations for version that require significant downtime:
The v5.3.0 schema change may take more than an hour to complete depending on the amount of data in your reporting system.
The v5.6.0 schema change may take 2 hours or more depending on the amount of data in your system.
The v5.11.x schema change will take approximately 1-2 minutes to complete for every 1 million vulnerable artifacts in your reporting system.
If your Anchore Enterprise deployment is on FIPS enabled hosts and your database is being hosted on Amazon RDS, an upgrade to Postgres 16 or greater is required. For more information please see the FIPS section in Requirements.
Fixes
Addresses a small Data Syncer Service timing issue found in the v5.20.0 release. When this occurred, the Data Syncer Service
would be unable to complete processing of the new vulnerability dataset which prevented vulnerability scans from succeeding.
Deprecations
Support for OpenStack Swift, which is an open-source object storage system, has been deprecated. Please see Object Storage for a list of supported Object Stores.
The enterprise-gitlab-scan plugin is being deprecated in favor of using AnchoreCTL directly in your pipelines. Please see GitLab for more information on integrating Anchore Enterprise with GitLab.
The webhook system managed in the configuration file is being deprecated in favor of the more advanced notification system which can be configured to send notifications to webhook endpoints. Please see Notifications for more information on configuring notifications.
13.1.17 - Anchore Enterprise Release Notes - Version 5.20.0
Anchore Enterprise v5.20.0
v5.20.0 Release
During the release testing of Anchore Enterprise v5.20.0, a timing issue was discovered that could result in the Data Syncer Service failing to correctly download the datasets. This issue would be visible via the UI’s system tab showing less than 5 datasets (feeds) present after the upgrade. This issue has been resolved and a patch release of v5.20.1 will be available shortly.
v5.20.x Compatibility for Air-gapped Users
Air-gapped users of Anchore Enterprise 5.20.x need to ensure that they are using the same/supported version of AnchoreCTL with Anchore Enterprise for all airgap workflows, this is due to a new dataset format for vulnerability data (GrypeDB v6). It is important to immediately upload the new dataset upon upgrade.
If upgrading from a release in the range of v5.0.0 - v5.19.x
The upgrade will result in an automatic schema change that will require database downtime. Below are the estimated downtime durations for version that require significant downtime:
The v5.3.0 schema change may take more than an hour to complete depending on the amount of data in your reporting system.
The v5.6.0 schema change may take 2 hours or more depending on the amount of data in your system.
The v5.11.x schema change will take approximately 1-2 minutes to complete for every 1 million vulnerable artifacts in your reporting system.
If your Anchore Enterprise deployment is on FIPS enabled hosts and your database is being hosted on Amazon RDS, an upgrade to Postgres 16 or greater is required. For more information please see the FIPS section in Requirements.
Improvements
Anchore STIG for Container Images
Anchore Enterprise now provides two new Graphql queries to help identify container images that have one or more
STIG evaluations uploaded to them.
imagesWithStig
runtimeImagesWithStig
Prometheus Metrics
The existing anchore_queue_length metric now has a new label priority which will indicate how many items have been queued with the priority bit set.
Improved logging when authentication fails due to external timestamp drift.
The Vulnerability Database (grypedb) is now using the latest schema version which will provide additional metadata for
vulnerabilities. This will allow for better filtering and searching of vulnerabilities. This schema has already been in use
by Grype for several months now.
CVSS
Anchore can now be configured to show the highest secondary CVSS score if the Primary NVD score has not been provided for a CVE.
If you wish to opt in to the new behavior, you can change the configuration setting of
services.policy_engine.vulnerabilities.nvd_fallback_to_secondary_cvss via the API or UI.
SBOM Management
Now provides system events that help track the creation and deletion of SBOMs and SBOM Groups.
Now has the ability to update the details of a specific SBOM Group with the new PUT /exp/sbom-groups/{group_uuid}
endpoint.
Provides limited support of a valid SPDX 3.0 SBOM. Note well: This version of SPDX is not fully supported by
Anchore Enterprise. Although you can upload and download SPDX 3.0 SBOMs, the content and vulnerability analysis
of the SBOM contents will not be functional.
SBOM scans that identify a distro without any version information, will now return results for all versions of that distro.
Performance improvement when processing stateless vulnerability scans at high loads.
Various supporting libraries have been updated in order to improve security.
Fixes
GET /v2/polices/{policy_id} endpoint will return the complete policy document unless the detail query parameter is set to false.
The ephemeral storage, within the Policy Engine service, is no longer used to store the vulnerability database.
Addresses an issue where an image can fail analysis when it contains a recursive Nix package dependency.
Deprecations
Support for OpenStack Swift, which is an open-source object storage system, has been deprecated. Please see Object Storage for a list of supported Object Stores.
The enterprise-gitlab-scan plugin is being deprecated in favor of using AnchoreCTL directly in your pipelines. Please see GitLab for more information on integrating Anchore Enterprise with GitLab.
The webhook system managed in the configuration file is being deprecated in favor of the more advanced notification system which can be configured to send notifications to webhook endpoints. Please see Notifications for more information on configuring notifications.
UI Updates
Improvements
New report types are now available for Images and Runtime Inventory Images with STIG evaluations if your system is entitled
Following on from 5.19, new report templates now automatically lowercase the default Artifact Type filter value to ensure compatibility with backend requirements
The Events & Notifications view now automatically fetches the latest event types for the custom selector, ensuring the options stay up to date without requiring manual edits
Fixes
Fixed an issue where long license text that was truncated in the SBOM table would display in a popup that could overflow the screen. The popup has been adjusted to accommodate larger bodies of text.
Fixed an issue in the SBOM import dialog where users could not re-select the same file after clearing it
Fixed an issue where rapidly clicking the Upload & Save button during SBOM uploads could result in multiple submissions being processed
Fixed an issue where the SBOM Vulnerabilities tab would not display an error message due to server-side errors or network issues
Fixed an issue where editing multiple LDAP mappings in a row could briefly show data from the previously viewed mapping before the correct data loaded
Fixed an issue in the Artifact Analysis > Policy Compliance view. When users opened the Add / Remove Allowlist Item modal and tried to scroll within its dropdown menu, the view would refresh and close the dropdown, which prevented selection.
Various supporting libraries have been updated in order to improve security, performance, and also to remove deprecation warnings from browser and server output logs. Redundant libraries have been removed to reduce the app startup time and overall size.
If upgrading from a release in the range of v5.0.0 - v5.18.x
The upgrade will result in an automatic schema change that will require database downtime. Below are the estimated downtime durations for version that require significant downtime:
The v5.3.0 schema change may take more than an hour to complete depending on the amount of data in your reporting system.
The v5.6.0 schema change may take 2 hours or more depending on the amount of data in your system.
The v5.11.x schema change will take approximately 1-2 minutes to complete for every 1 million vulnerable artifacts in your reporting system.
If your Anchore Enterprise deployment is on FIPS enabled hosts and your database is being hosted on Amazon RDS, an upgrade to Postgres 16 or greater is required. For more information please see the FIPS section in Requirements.
Fixes
Resolves a critical vulnerability in the deepdiff package
Deprecations
Support for OpenStack Swift, which is an open-source object storage system, has been deprecated. Please see Object Storage for a list of supported Object Stores.
The enterprise-gitlab-scan plugin is being deprecated in favor of using AnchoreCTL directly in your pipelines. Please see GitLab for more information on integrating Anchore Enterprise with GitLab.
The webhook system managed in the configuration file is being deprecated in favor of the more advanced notification system which can be configured to send notifications to webhook endpoints. Please see Notifications for more information on configuring notifications.
If upgrading from a release in the range of v5.0.0 - v5.18.x
The upgrade will result in an automatic schema change that will require database downtime. Below are the estimated downtime durations for version that require significant downtime:
The v5.3.0 schema change may take more than an hour to complete depending on the amount of data in your reporting system.
The v5.6.0 schema change may take 2 hours or more depending on the amount of data in your system.
The v5.11.x schema change will take approximately 1-2 minutes to complete for every 1 million vulnerable artifacts in your reporting system.
If your Anchore Enterprise deployment is on FIPS enabled hosts and your database is being hosted on Amazon RDS, an upgrade to Postgres 16 or greater is required. For more information please see the FIPS section in Requirements.
Fixes
Enables the Data Syncer Service to handle Anchore datasets without size limitations, ensuring reliable storage and retrieval.
Deprecations
Support for OpenStack Swift, which is an open-source object storage system, has been deprecated. Please see Object Storage for a list of supported Object Stores.
The enterprise-gitlab-scan plugin is being deprecated in favor of using AnchoreCTL directly in your pipelines. Please see GitLab for more information on integrating Anchore Enterprise with GitLab.
The webhook system managed in the configuration file is being deprecated in favor of the more advanced notification system which can be configured to send notifications to webhook endpoints. Please see Notifications for more information on configuring notifications.
If upgrading from a release in the range of v5.0.0 - v5.18.x
The upgrade will result in an automatic schema change that will require database downtime. Below are the estimated downtime durations for version that require significant downtime:
The v5.3.0 schema change may take more than an hour to complete depending on the amount of data in your reporting system.
The v5.6.0 schema change may take 2 hours or more depending on the amount of data in your system.
The v5.11.x schema change will take approximately 1-2 minutes to complete for every 1 million vulnerable artifacts in your reporting system.
If your Anchore Enterprise deployment is on FIPS enabled hosts and your database is being hosted on Amazon RDS, an upgrade to Postgres 16 or greater is required. For more information please see the FIPS section in Requirements.
Fixes
Fixes an issue where a child image would fail a policy check if the parent image’s analysis state was not in the analyzed state.
Deprecations
Support for OpenStack Swift, which is an open-source object storage system, has been deprecated. Please see Object Storage for a list of supported Object Stores.
The enterprise-gitlab-scan plugin is being deprecated in favor of using AnchoreCTL directly in your pipelines. Please see GitLab for more information on integrating Anchore Enterprise with GitLab.
The webhook system managed in the configuration file is being deprecated in favor of the more advanced notification system which can be configured to send notifications to webhook endpoints. Please see Notifications for more information on configuring notifications.
If upgrading from a release in the range of v5.0.0 - v5.18.x
The upgrade will result in an automatic schema change that will require database downtime. Below are the estimated downtime durations for version that require significant downtime:
The v5.3.0 schema change may take more than an hour to complete depending on the amount of data in your reporting system.
The v5.6.0 schema change may take 2 hours or more depending on the amount of data in your system.
The v5.11.x schema change will take approximately 1-2 minutes to complete for every 1 million vulnerable artifacts in your reporting system.
If your Anchore Enterprise deployment is on FIPS enabled hosts and your database is being hosted on Amazon RDS, an upgrade to Postgres 16 or greater is required. For more information please see the FIPS section in Requirements.
Fixes
Security update - ClamAV upgraded to version 1.0.9
Deprecations
Support for OpenStack Swift, which is an open-source object storage system, has been deprecated. Please see Object Storage for a list of supported Object Stores.
The enterprise-gitlab-scan plugin is being deprecated in favor of using AnchoreCTL directly in your pipelines. Please see GitLab for more information on integrating Anchore Enterprise with GitLab.
The webhook system managed in the configuration file is being deprecated in favor of the more advanced notification system which can be configured to send notifications to webhook endpoints. Please see Notifications for more information on configuring notifications.
UI Updates
Fixes
Fixed an issue in the Artifact Analysis > Policy Compliance view. When users opened the Add / Remove Allowlist Item modal and tried to scroll within its dropdown menu, the view would refresh and close the dropdown which prevented selection.
Various supporting libraries have been updated in order to improve security, performance, and also to remove deprecation warnings from browser and server output logs. Redundant libraries have been removed to reduce the app startup time and overall size.
If upgrading from a release in the range of v5.0.0 - v5.18.x
The upgrade will result in an automatic schema change that will require database downtime. Below are the estimated downtime durations for version that require significant downtime:
The v5.3.0 schema change may take more than an hour to complete depending on the amount of data in your reporting system.
The v5.6.0 schema change may take 2 hours or more depending on the amount of data in your system.
The v5.11.x schema change will take approximately 1-2 minutes to complete for every 1 million vulnerable artifacts in your reporting system.
If your Anchore Enterprise deployment is on FIPS enabled hosts and your database is being hosted on Amazon RDS, an upgrade to Postgres 16 or greater is required. For more information please see the FIPS section in Requirements.
Improvements
Anchore STIG for Container Images
Anchore now has support for running STIG evaluations against container images. This feature is available through a new entitlement called Static STIG AddOn.
New API endpoints have been added to support the STIG workflow:
GET /v2/images/{image_digest}/stig allows users to list the current STIG evaluations for the specified image digest.
POST /v2/images/{image_digest}/stig allows users to upload a STIG evaluation for the specified image digest.
GET /v2/images/{image_digest}/stig/{evaluation_uuid}/file allows users to download a STIG evaluation for the specified image digest and STIG evaluation UUID.
DELETE /v2/images/{image_digest}/stig/{evaluation_uuid} allows users to delete a STIG evaluation for the specified image digest and STIG evaluation UUID.
PUT /v2/images/{image_digest}/stig/{evaluation_uuid} allows users to update a STIG evaluation for the specified image digest.
Policy Gate stig is now available to ensure that images have STIG evaluations associated with them.
A new system statistic called stig_evaluation_inventory has been added to track the number of STIG evaluations in the system.
Deployment metrics were added for our users who monitor their deployments with Prometheus.
Please see the Anchore STIG documentation for more information.
Anchore One Time Scan - A stateless scan feature that allows users to scan images without persisting the data in the Anchore Enterprise deployment.
This feature is designed for users who want a light weight vuln and policy scan of an image.
API endpoint POST /v2/scan allows users to submit an image for a one time scan.
The policy evaluation will be performed against the active policy bundle in the account provided with the Secure
Module gates of vulnerabilities and
secret_scans.
A new system statistic called stateless_sbom_evaluation has been added to track the number of stateless scans performed.
An AnchoreCTL command has been added to support this feature: anchorectl image one-time-scan <pull string>. Please see the AnchoreCTL Release Notes for more information.
Priority Analysis Queue
New priority analysis queue feature allows users to prioritize image and source analysis jobs that are received via the API.
This allows user requested analysis jobs to be processed before background jobs that are generated by various subscription watchers.
Configuration is accessible via the UI or Helm chart value of services.catalog.analysis_queue_priority.
Please Note: that changes to the priority will not effect any jobs that are already in the queue.
Identification of old analysis data
In a future release of Anchore Enterprise, analysis data generated prior to the v4.0 release will no longer be supported. If these images are still
important to your organization, we highly recommend that you force reanalyze them to ensure that you have the most current analysis data for them.
Many improvements have been made to our scanning and analysis capabilities including improvements to package and vulnerability detection, license identification, and more.
To assist in identifying older artifacts in your system, a warning message for each artifact analyzed before the v4.0 release will be printed
during the upgrade job. It will include the account name, image pull string and image digest. This will allow you to identify which images need to be force reanalyzed.
SBOM Management Vulnerabilities listing has been updated with a small performance improvement.
Improved a few API endpoints to more quickly close database transactions. This will result in fewer idle in transaction states in Postgres.
Improved the consistency of the Fix Observed At date across the deployment.
Improved the performance of events being added to the event queue when you have large number of events being generated.
Various supporting libraries have been updated in order to improve security.
Fixes
Resolves an exception within Policy Engine which caused a 404 error back to the user during a policy evaluation.
Reduces the amount of debug logging that is generated by each service.
Addresses a corner case where concurrent policy evaluations could result in a errors back to the user.
Fixes an issue where a scheduled report executions would occasionally create two reports.
Fixes an issue where the SBOM Group Vulnerability view could return duplicate vulnerabilities in the report.
Provides better error messages when an unsupported SBOM is uploaded to the system.
In deployments with large numbers of analyzers (40+), the reports worker service could overload the system with calls to gather image data. This has been fixed to ensure that the worker service does not overload the system with requests.
Addresses an issue in policy-engine where an exception would be thrown and the user would receive a 404 error instead. The exception reason will not be returned with a 500 error.
Addressed a timing issue found in the reports worker service that resulted in a stack trace. No other adverse effect were found.
Fixes an issue that prevented an image SBOM added from distributed analysis (AnchoreCTL) from being downloaded as a CycloneDX SBOM.
Corrects when the Prometheus metric anchore_analyzer_status is set processing to accurately reflect the state of the analyzer.
Deprecations
Support for OpenStack Swift, which is an open-source object storage system, has been deprecated. Please see Object Storage for a list of supported Object Stores.
The enterprise-gitlab-scan plugin is being deprecated in favor of using AnchoreCTL directly in your pipelines. Please see GitLab for more information on integrating Anchore Enterprise with GitLab.
The webhook system managed in the configuration file is being deprecated in favor of the more advanced notification system which can be configured to send notifications to webhook endpoints. Please see Notifications for more information on configuring notifications.
UI Updates
Improvements
You can now add custom banners to share helpful or important info with your users. Banners can appear at the top or bottom of the app and be shown either on all pages or just the login screen. You can set everything up through the UI deployment configuration, making it easy to tailor to your needs.
Security Technical Implementation Guide (STIG) evaluation management for container artifacts is now supported. Users can view, download, and delete STIG compliance evaluations associated with images directly from the Artifact Analysis view.
The Artifact Analysis view now loads immediately, with data displayed progressively as it becomes available. If any tab (such as policy compliance or vulnerabilities) fails to load, only the affected sections will show an error message — the rest remain fully accessible.
The Artifact Analysis view no longer requires the getActions permission to be present in order to display the page. Instead, users without this permissions will be blocked from accessing the Action Workbench and adding compliance items to an action plan.
When previewing a New Report, the Artifact Type filter in various reports is now enforced to be lowercased to match backend expectations
Added support for LDAP authentication with posixGroup object classes. Users can now authenticate with both groupOfUniqueNames (via uniqueMember attribute) and posixGroup (via memberUid attribute) LDAP configurations.
The stateless_sbom_evaluation metric is now available in the System > Usage charts and for download alongside other usage metrics
The User Groups column within the System > Accounts > Users view has been expanded to now display all groups that a user is a member of. For account user admins, the current behavior of only showing groups with roles assigned to their primary account has not changed.
Social links have found a new home in the About dialog
Fixes
The Artifact Analysis > SBOM view now displays a more accurate message when malware scanning is not enabled due to deployment configuration
In previous versions, bulk deletion of events in the Events view could sporadically trigger a UI exception. This issue has now been resolved.
Added a custom websocket heartbeat mechanism to improve connection reliability and automatically recover from network interruptions, reducing sporadic timeout issues that previously required manual page refreshes
Prior to this release, the spinner displayed during long SBOM content loading operations would persist in the view, even after navigating elsewhere within the SBOM feature. Now fixed.
Fixed an issue in Imported SBOMs where error messages from failed group assignment updates would incorrectly persist when reopening the modal for different SBOMs
Resolved an issue where error notifications about invalid context switches would incorrectly appear under certain conditions
The sidebar navigation now correctly displays the Kubernetes tab as disabled when the user does not have the ability to view it. Previously, it would appear enabled and provide a 403 Forbidden error when clicked.
The sidebar navigation now correctly displays enabled options on initial load, rather than showing a select couple as disabled and then enabling them after a brief delay
Fixed an issue where tooltips in the sidebar navigation could shift position after several seconds of hovering. Tooltip positioning is now stable and accurate.
Fixed an issue where the dimmer would persist after navigating to the Events view from the Incomplete Analyses modal, causing the background to remain dimmed. The dimmer now correctly disappears when the modal is closed.
Fixed an issue where the Compliance Alert Summary header would disappear after collapsing and expanding the widget. The header now remains visible as expected.
Health check requests from monitoring tools and load balancers are now intelligently redirected to a dedicated health service endpoint, reducing unnecessary server-side rendering overhead. This optimization improves response times for health checks and reduces resource usage on the main application server
The system automatically detects common health check user agents from Kubernetes, cloud providers, and monitoring services. Note that this redirection only takes place for agent requests that carry no authentication headers.
Various supporting libraries have been updated in order to improve security, performance, and also to remove deprecation warnings from browser and server output logs. Redundant libraries have been removed to reduce the app startup time and overall size.
If upgrading from a release in the range of v5.0.0 - v5.17.x
The upgrade will result in an automatic schema change that will require database downtime. Below are the estimated downtime durations for version that require significant downtime:
The v5.3.0 schema change may take more than an hour to complete depending on the amount of data in your reporting system.
The v5.6.0 schema change may take 2 hours or more depending on the amount of data in your system.
The v5.11.x schema change will take approximately 1-2 minutes to complete for every 1 million vulnerable artifacts in your reporting system.
If your Anchore Enterprise deployment is on FIPS enabled hosts and your database is being hosted on Amazon RDS, an upgrade to Postgres 16 or greater is required. For more information please see the FIPS section in Requirements.
Fixes
Enables the Data Syncer Service to handle Anchore datasets without size limitations, ensuring reliable storage and retrieval.
Deprecations
Support for OpenStack Swift, which is an open-source object storage system, has been deprecated. Please see Object Storage for a list of supported Object Stores.
The enterprise-gitlab-scan plugin is being deprecated in favor of using AnchoreCTL directly in your pipelines. Please see GitLab for more information on integrating Anchore Enterprise with GitLab.
The webhook system managed in the configuration file is being deprecated in favor of the more advanced notification system which can be configured to send notifications to webhook endpoints. Please see Notifications for more information on configuring notifications.
If upgrading from a release in the range of v5.0.0 - v5.17.x
The upgrade will result in an automatic schema change that will require database downtime. Below are the estimated downtime durations for version that require significant downtime:
The v5.3.0 schema change may take more than an hour to complete depending on the amount of data in your reporting system.
The v5.6.0 schema change may take 2 hours or more depending on the amount of data in your system.
The v5.11.x schema change will take approximately 1-2 minutes to complete for every 1 million vulnerable artifacts in your reporting system.
If your Anchore Enterprise deployment is on FIPS enabled hosts and your database is being hosted on Amazon RDS, an upgrade to Postgres 16 or greater is required. For more information please see the FIPS section in Requirements.
Improvements
Anchore SBOM - SBOM Management
Anchore Enterprise now provides the ability to upload and manage your company’s SBOMs.
The feature provides the ability to view package contents and vulnerabilities found in the SBOMs uploaded to Anchore Enterprise.
New Prometheus metrics are available to monitor the SBOM Management feature.
The Imported SBOM count is included in your Total SBOM Usage available in the UI.
For more detail on this feature, please see the SBOM Management documentation.
Adds a new database index for reports_tags table to improve performance of queries that filter by account name and image digest.
Adds support to detect chrome binaries.
Improved the performance of the Tag Drift Policy Gate.
Exposes the max_scan_time configuration option in the API to allow users to change the value within the UI.
This value is the maximum time in milliseconds that a ClamAV Malware Scan is allowed to run.
License
When license content is found but the license id can not be determined, the license value will be listed as
other-indeterminate and the license content will be included in the license data returned in /v2/images/{image_digest}/content/licenses.
Identification of old analysis data
In a future release of Anchore Enterprise, analysis data generated prior to the 4.0 release will no longer be supported. If these images are still
important to your organization, we highly recommend that you force reanalyze them to ensure that you have the most current analysis data for them.
Many improvements have been made to our scanning and analysis capabilities including improvements to package and vulnerability detection, license identification, and more.
To assist in identifying older artifacts in your system, a warning message for each artifact analyzed before the 4.0 release will be printed
during the upgrade job. It will include the account name, image pull string and image digest. This will allow you to identify which images need to be force reanalyzed.
Various supporting libraries have been updated in order to improve security.
Fixes
Resolves an issue where an image that has a change in parent digest was not correctly reflected in reports.
Addresses an issue in Syft which resulted in our inability to determine a dpkg license with the data provided during analysis.
Addresses an issue in Syft which resulted in the license content showing up in the licenses field instead of just the license id.
Addresses an issue in Syft where the Dotnet deps cataloger would hang while resolving dependencies.
Fixes an issue seen when you have linux-kernel entries in your image and Enterprise was surfacing these entries as packages in
the os type as well as linus-kernel type. The result caused any vulnerability matches to be duplicated for that image.
Fixes an issue where the Dotnet cataloger within Syft could result in different number of packages when run on the same image multiple times.
Fixes a failure with Strict Configuration Validation when enabling OSAA Migration.
Resolved an issue where a warning message regarding unused environment variables was being printed 3 times during startup.
Deprecations
Support for OpenStack Swift, which is an open-source object storage system, has been deprecated. Please see Object Storage for a list of supported Object Stores.
The enterprise-gitlab-scan plugin is being deprecated in favor of using AnchoreCTL directly in your pipelines. Please see GitLab for more information on integrating Anchore Enterprise with GitLab.
The webhook system managed in the configuration file is being deprecated in favor of the more advanced notification system which can be configured to send notifications to webhook endpoints. Please see Notifications for more information on configuring notifications.
UI Updates
Improvements
SBOM Management
Import and process SBOMs generated by any tool adhering to the SPDX or CycloneDX standards via the new Imported SBOMs tab. Establish a comprehensive inventory of software components and dependencies, regardless of origin.
View packages within uploaded SBOMs, including their associated licenses.
Automatically identify and report vulnerabilities within uploaded SBOMs, and export detailed vulnerability data in CSV format. Use the new Anchore Score - a composite metric combining CVSS score and severity, EPSS percentage, and CISA KEV data - to prioritize and triage vulnerabilities effectively, significantly reducing noise and accelerating triage time.
Our table columns now clearly indicate whether they’re sortable, and when sorting is applied, they show the direction - ascending or descending - at a glance.
For account administrators, a new ‘Groups’ column has been added within System > Accounts > Users which lists all use groups with roles for the user’s primary account.
A new Show OS CVEs filter has been added to Artifact Analysis > Vulnerabilities. Combined with the existing Show Non-OS CVEs toggle, this new filter allows users to either exclusively display OS CVEs, hide them, or show everything.
Page headers across the application have been refreshed for consistency and our lovely robots have been relocated to the sidebar. Primary actions are also highlighted in the top-right of the page header.
The Add / Edit User Group modal under System > User Groups now allows you to associate system-wide roles with a group.
For clarity, the Email field for an Account has been updated to be Contact Email instead.
Fixes
When setting a system limit via deployment configuration, reaching the limit had the UI incorrectly stating that the limit was being approached instead. This has been fixed.
Previously, it was possible to add invalid regular expressions as rule parameters for rules that required them (such as the filename regex field under the secret scans gate). Validation is now enforced, and invalid expressions can no longer be added through the UI.
Previously, a user had to click the table column header text to sort the column. Now, a user can click anywhere within the table column header cell to trigger a sort.
In previous versions, attempting to analyze a repository that already exists via the Analyze a Repository modal in the Image Selection view could cause a page exception after entering the repository details. This issue has now been resolved.
If upgrading from a release in the range of v5.0.0 - v5.16.x
The upgrade will result in an automatic schema change that will require database downtime. Below are the estimated downtime durations for version that require significant downtime:
The v5.3.0 schema change may take more than an hour to complete depending on the amount of data in your reporting system.
The v5.6.0 schema change may take 2 hours or more depending on the amount of data in your system.
The v5.11.x schema change will take approximately 1-2 minutes to complete for every 1 million vulnerable artifacts in your reporting system.
If your Anchore Enterprise deployment is on FIPS enabled hosts and your database is being hosted on Amazon RDS, an upgrade to Postgres 16 or greater is required. For more information please see the FIPS section in Requirements.
Fixes
Enables the Data Syncer Service to handle Anchore datasets without size limitations, ensuring reliable storage and retrieval.
Deprecations
Support for OpenStack Swift, which is an open-source object storage system, has been deprecated. Please see Object Storage for a list of supported Object Stores.
The enterprise-gitlab-scan plugin is being deprecated in favor of using AnchoreCTL directly in your pipelines. Please see GitLab for more information on integrating Anchore Enterprise with GitLab.
The webhook system managed in the configuration file is being deprecated in favor of the more advanced notification system which can be configured to send notifications to webhook endpoints. Please see Notifications for more information on configuring notifications.
If upgrading from a release in the range of v5.0.0 - v5.16.x
The upgrade will result in an automatic schema change that will require database downtime. Below are the estimated downtime durations for version that require significant downtime:
The v5.3.0 schema change may take more than an hour to complete depending on the amount of data in your reporting system.
The v5.6.0 schema change may take 2 hours or more depending on the amount of data in your system.
The v5.11.x schema change will take approximately 1-2 minutes to complete for every 1 million vulnerable artifacts in your reporting system.
If your Anchore Enterprise deployment is on FIPS enabled hosts and your database is being hosted on Amazon RDS, an upgrade to Postgres 16 or greater is required. For more information please see the FIPS section in Requirements.
Fixes
Resolves an issue in the object store driver migration code path that prevented data from being successfully transferred from the old data store to the new one.
Deprecations
Support for OpenStack Swift, which is an open-source object storage system, has been deprecated. Please see Object Storage for a list of supported Object Stores.
The enterprise-gitlab-scan plugin is being deprecated in favor of using AnchoreCTL directly in your pipelines. Please see GitLab for more information on integrating Anchore Enterprise with GitLab.
The webhook system managed in the configuration file is being deprecated in favor of the more advanced notification system which can be configured to send notifications to webhook endpoints. Please see Notifications for more information on configuring notifications.
If upgrading from a release in the range of v5.0.0 - v5.16.x
The upgrade will result in an automatic schema change that will require database downtime. Below are the estimated downtime durations for version that require significant downtime:
The v5.3.0 schema change may take more than an hour to complete depending on the amount of data in your reporting system.
The v5.6.0 schema change may take 2 hours or more depending on the amount of data in your system.
The v5.11.x schema change will take approximately 1-2 minutes to complete for every 1 million vulnerable artifacts in your reporting system.
If your Anchore Enterprise deployment is on FIPS enabled hosts and your database is being hosted on Amazon RDS, an upgrade to Postgres 16 or greater is required. For more information please see the FIPS section in Requirements.
Improvements
Memory Usage Improvements
We’ve made targeted improvements to the memory usage profile of various services that reduces the amount of memory
the services use in most circumstances.
Image Analysis
When adding an image to Anchore Enterprise from a multi-platform manifest list, the Linux operating system digest
will be preferred over a Windows digest. This change ensures that the most commonly used platform is prioritized for analysis and scanning.
Prometheus Metrics
Now available on a per-account basis. This allows for more granular monitoring and alerting based on account-specific metrics.
Per-account metrics are enabled in the helm chart by setting services.catalog.account_prometheus_metrics to true.
License
A new endpoint that provides detailed information about the software licenses for each package contained within an image.
GET /v2/images/{image_digest}/content/licenses
Feeds
GET /v2/system/feeds endpoint has been updated to include two new timestamps that should improve the clarity of when
vulnerability data was downloaded and built in the Anchore Data Service data_service_built_at and when it was
received by your enterprise deployment enterprise_received_at. All other timestamps returned by that endpoint
continue to be updated but have been marked deprecated.
Corrections
Now have templating support for the package URL (PURL) field.
Logging
Anchore Enterprise will print a warning level log message when any ANCHORE_* Environment Variables that are detected
without a reference in the config file. This is an indication of a potential misconfiguration. The log message will start with the words Detected Anchore environment variables which are not referenced in the configuration file: {'ANCHORE_....
Fixes
Fixes an issue where the Vulnerability Fix Observed At Date was not being captured.
When the root owning package node is a nix package, any owned packages are no longer filtered. This is due to the fact that there is
currently no distro-level vulnerability data ingested for nix. The only method of getting a possible vulnerability match will be via the
descendant packages (python, npm, go, etc).
When first configuring SSO on your Anchore Enterprise deployment, if you allowed the default account to be automatically
created when the first user logged in, the account would not have received the default policy. This has been fixed.
Fixes an exception seen when requesting a forced feed sync via POST /v2/system/feeds?force_sync=true.
Fixes the error message returned if the user provided an invalid policy gates.
When the image is “force reanalyzed”, the analysis will re-evaluate the parent digest.
Fixes an issue where the license policy gate was not working properly for non-os packages.
Deprecations
Support for OpenStack Swift, which is an open-source object storage system, has been deprecated. Please see Object Storage for a list of supported Object Stores.
The enterprise-gitlab-scan plugin is being deprecated in favor of using AnchoreCTL directly in your pipelines. Please see GitLab for more information on integrating Anchore Enterprise with GitLab.
The webhook system managed in the configuration file is being deprecated in favor of the more advanced notification system which can be configured to send notifications to webhook endpoints. Please see Notifications for more information on configuring notifications.
UI Updates
Improvements
Sticky headers are now enabled on select tables, so you can keep
column names in view while scrolling. Try it out in the Images,
Events, and System > Accounts views.
The sidebar navigation menu now includes tooltips when collapsed to
help identify the icons and their associated views.
The Redis connection string now supports the rediss:// protocol,
allowing TLS connections to resources that use a certificate authority.
The SBOM > Malware tab in Artifact Analysis will now show whether
Malware Scanning is active on your Anchore instance or if there are
no findings from the scan. It has also been pinned in the top list.
Loading the list of LDAP mappings on the System page has been optimized
to improve performance.
The generic error message displayed when an artifact analysis fails
has been replaced in favor of more informative service-level messaging
to aid in troubleshooting.
Various supporting libraries have been updated in order to improve
security, performance, and also to remove deprecation warnings from
browser and server output logs. Redundant libraries have been
removed to reduce the app startup time and overall size.
Fixes
In previous versions, the tour step information associated with
adding a repository and adding a tag was inverted. Now fixed.
Previously, nix and alpm packages were not displaying correctly
within the Artifact Analysis > Vulnerabilities view. This has
been fixed.
In the Dashboard detail view, the labels at the top-right of the
page could be occluded by the robot image. Now fixed.
Fixed an issue where new users were shown the welcome banner on both
their first and second logins.
13.1.28 - Anchore Enterprise Release Notes - Version 5.16.0
Anchore Enterprise v5.16.0
Warning if using Vulnerability Gate with Max Days Since Fixed Trigger
If you are using the Vulnerabilities policy gate, package with a Max Days Since Fix trigger, we strongly recommend upgrading directly to v5.17.x or greater to avoid a regression with the handling of the Vulnerability Fix Observed At Date.
If upgrading from a release in the range of v5.0.0 - v5.15.x
The upgrade will result in an automatic schema change that will require database downtime. Below are the estimated downtime durations for version that require significant downtime:
The v5.3.0 schema change may take more than an hour to complete depending on the amount of data in your reporting system.
The v5.6.0 schema change may take 2 hours or more depending on the amount of data in your system.
The v5.11.x schema change will take approximately 1-2 minutes to complete for every 1 million vulnerable artifacts in your reporting system.
If your Anchore Enterprise deployment is on FIPS enabled hosts and your database is being hosted on Amazon RDS, an upgrade to Postgres 16 or greater is required. For more information please see the FIPS section in Requirements.
Improvements
Policy
The files Gate with suid or guid set Trigger now provides a new parameter ignore dir to allow users to indicate if directories should be ignored when checking for setuid/setgid. This parameter is optional and defaults to false.
The package Gate with denylist Trigger now provides a new parameter that allow version comparison operations. The default behavior is still an exact match.
Package License Names
For newly analyzed images, the license names are now normalized to the SPDX License List. This will help with
consistency in the UI and API responses. When an exact match is not found, we will continue to use the value found
within the image and extracted by Syft. For more information on normalized license names, please
review SPDX License List.
Please Note: if you are currently using the license field in your policy gates, you may need to update
your policy to reflect the new normalized license names. For example, if you are using GPL-2.0 in your policy,
you will need to update it to GPL-2.0-only to match the SPDX License List.
Image Hints
When using image hints, the result application of the hints will be visible in a downloaded SBOM in Syft Native, SPDX, and CycloneDX formats. This will allow users to see the hints that were applied to the image.
This will apply to only newly analyzed images. If you would like to see hints applied to an existing image, you will need to reanalyze the image.
Fixes
Fixes a URL encoding issue found in some notifications when the account name has a space in it.
Centralized Analysis now supports images that have been compressed using zstd compression.
RBAC Roles are now correctly reflecting the allowed permissions. During a review, it was found
that the read-only, read-write, and image-developer roles had included listFeeds, updateFeeds,
listServices and getService permissions that were not correct. These permissions were only allowed to users
with system-admin role. This is documentation only, no change in user behavior is expected.
Provides a better error message when creating a new user and the name conflicts with an existing User Group name.
Prevents race conditions that could occur when adding the same image multiple times and also when deleting the same image. This could result in the image analysis failing.
Improves the analyzer queue by implementing a Round Robin algorithm to ensure that each account is serviced equally.
Deprecations
Support for OpenStack Swift, which is an open-source object storage system, has been deprecated. Please see Object Storage for a list of supported Object Stores.
The enterprise-gitlab-scan plugin is being deprecated in favor of using AnchoreCTL directly in your pipelines. Please see GitLab for more information on integrating Anchore Enterprise with GitLab.
The webhook system managed in the configuration file is being deprecated in favor of the more advanced notification system which can be configured to send notifications to webhook endpoints. Please see Notifications for more information on configuring notifications.
UI Updates
Improvements
All links to documentation within the application have been updated to use the version your system is using for accuracy, not just the latest version.
Administrators can now configure a custom message on the login screen with a character limit of 10,0000 characters. The title also now supports a limit of 250 characters.
The About modal now includes the commit SHA and build timestamp of the Enterprise Client and Service. This information is useful for troubleshooting and support purposes.
Various supporting libraries have been updated in order to improve security, performance, and also to remove deprecation warnings from browser and server output logs. Redundant libraries have been removed to reduce the app startup time and overall size.
Fixes
When a small screen height was used, the login content could display over the top navigation bar. This has been fixed.
13.1.29 - Anchore Enterprise Release Notes - Version 5.15.1
Anchore Enterprise v5.15.1
Warning if using Vulnerability Gate with Max Days Since Fixed Trigger
If you are using the Vulnerabilities policy gate, package with a Max Days Since Fix trigger, we strongly recommend upgrading directly to v5.17.x or greater to avoid a regression with the handling of the Vulnerability Fix Observed At Date.
If upgrading from a release in the range of v5.0.0 - v5.14.x
The upgrade will result in an automatic schema change that will require database downtime. Below are the estimated downtime durations for version that require significant downtime:
The v5.3.0 schema change may take more than an hour to complete depending on the amount of data in your reporting system.
The v5.6.0 schema change may take 2 hours or more depending on the amount of data in your system.
The v5.11.x schema change will take approximately 1-2 minutes to complete for every 1 million vulnerable artifacts in your reporting system.
If your Anchore Enterprise deployment is on FIPS enabled hosts and your database is being hosted on Amazon RDS, an upgrade to Postgres 16 or greater is required. For more information please see the FIPS section in Requirements.
Fixes
Update Anchore Enterprise with the latest version of AnchoreCTL v5.15.1
Deprecations
Support for OpenStack Swift, which is an open-source object storage system, has been deprecated. Please see Object Storage for a list of supported Object Stores.
The enterprise-gitlab-scan plugin is being deprecated in favor of using AnchoreCTL directly in your pipelines. Please see GitLab for more information on integrating Anchore Enterprise with GitLab.
The webhook system managed in the configuration file is being deprecated in favor of the more advanced notification system which can be configured to send notifications to webhook endpoints. Please see Notifications for more information on configuring notifications.
13.1.30 - Anchore Enterprise Release Notes - Version 5.15.0
Anchore Enterprise v5.15.0
Warning if using Vulnerability Gate with Max Days Since Fixed Trigger
If you are using the Vulnerabilities policy gate, package with a Max Days Since Fix trigger, we strongly recommend upgrading directly to v5.17.x or greater to avoid a regression with the handling of the Vulnerability Fix Observed At Date.
If upgrading from a release in the range of v5.0.0 - v5.14.x
The upgrade will result in an automatic schema change that will require database downtime. Below are the estimated downtime durations for version that require significant downtime:
The v5.3.0 schema change may take more than an hour to complete depending on the amount of data in your reporting system.
The v5.6.0 schema change may take 2 hours or more depending on the amount of data in your system.
The v5.11.x schema change will take approximately 1-2 minutes to complete for every 1 million vulnerable artifacts in your reporting system.
If your Anchore Enterprise deployment is on FIPS enabled hosts and your database is being hosted on Amazon RDS, an upgrade to Postgres 16 or greater is required. For more information please see the FIPS section in Requirements.
Improvements
API
Improved the ImageContent Object description.
GET /v2/version now provides the commit SHA and the build datetime for the Enterprise Image.
Various package updates to improve security and performance.
Fixes
Fixes an issue determining if a policy_eval event should be issued because the policy eval result has changed. For customers who have alerts enabled, this may have resulted in multiple events being generated in error.
Fixes an issue during analysis which causes a cache miss to occur in the image layer cache. The cache miss would result in reduced performance. Resolving this issue will result in improve analysis performance.
Resolves an issue parsing environment variables with unexpected newline characters. This issue prevents services from starting.
Deprecations
Support for OpenStack Swift, which is an open-source object storage system, has been deprecated. Please see Object Storage for a list of supported Object Stores.
The enterprise-gitlab-scan plugin is being deprecated in favor of using AnchoreCTL directly in your pipelines. Please see GitLab for more information on integrating Anchore Enterprise with GitLab.
The webhook system managed in the configuration file is being deprecated in favor of the more advanced notification system which can be configured to send notifications to webhook endpoints. Please see Notifications for more information on configuring notifications.
UI Updates
Fixes
When a trailing slash was manually included in the URL for the Images tab, an issue was observed. This has been fixed.
Column headers within our tables now have a dividing line between them for better visibility and to help resizing.
When an error occurred while generating a report due to exceeding a configured limit, the message returned was generic and not helpful. Additional detail has now been added.
When a SAML user has groups conferred by an IDP, those groups show within the Edit User modal and appear to be removable. As the group will continue to persist even after removal as the IDP asserts it, the user experience has been improved to prevent removal with an explanation as to why.
The graphs within the Artifact Analysis view now correctly repaint on changing the theme from dark to light mode or vice versa.
When navigating directly to a tab url as a user who does not have permission to view it, the tab tour would still get triggered. This is no longer the case.
When the window height is made very small, the Log Out button was overlapping with the navigation tabs. This has been fixed.
The dark/light mode preference is now preserved across browser tabs. This means that if you switch to dark mode in one browser tab, that change is immediately reflected in any other open browser tab (within the same browser).
Various supporting libraries have been updated in order to improve security, performance, and also to remove deprecation warnings from browser and server output logs. Redundant libraries have been removed to reduce the app startup time and overall size.
13.1.31 - Anchore Enterprise Release Notes - Version 5.14.1
Anchore Enterprise v5.14.1
Warning if using Vulnerability Gate with Max Days Since Fixed Trigger
If you are using the Vulnerabilities policy gate, package with a Max Days Since Fix trigger, we strongly recommend upgrading directly to v5.17.x or greater to avoid a regression with the handling of the Vulnerability Fix Observed At Date.
If upgrading from a release in the range of v5.0.0 - v5.13.x
The upgrade will result in an automatic schema change that will require database downtime. Below are the estimated downtime durations for version that require significant downtime:
The v5.3.0 schema change may take more than an hour to complete depending on the amount of data in your reporting system.
The v5.6.0 schema change may take 2 hours or more depending on the amount of data in your system.
The v5.11.x schema change will take approximately 1-2 minutes to complete for every 1 million vulnerable artifacts in your reporting system.
If your Anchore Enterprise deployment is on FIPS enabled hosts and your database is being hosted on Amazon RDS, an upgrade to Postgres 16 or greater is required. For more information please see the FIPS section in Requirements.
Fixes
Fixes an issue during analysis which causes a cache miss to occur in the image layer cache. The cache miss would result in reduced performance. Resolving this issue will result in improve analysis performance.
Resolve an issue parsing environment variables with unexpected newline characters that would prevent services from starting.
Deprecations
Support for OpenStack Swift, which is an open-source object storage system, has been deprecated. Please see Object Storage for a list of supported Object Stores.
The enterprise-gitlab-scan plugin is being deprecated in favor of using AnchoreCTL directly in your pipelines. Please see GitLab for more information on integrating Anchore Enterprise with GitLab.
13.1.32 - Anchore Enterprise Release Notes - Version 5.14.0
Anchore Enterprise v5.14.0
Warning if using Vulnerability Gate with Max Days Since Fixed Trigger
If you are using the Vulnerabilities policy gate, package with a Max Days Since Fix trigger, we strongly recommend upgrading directly to v5.17.x or greater to avoid a regression with the handling of the Vulnerability Fix Observed At Date.
If upgrading from a release in the range of v5.0.0 - v5.13.x
The upgrade will result in an automatic schema change that will require database downtime. Below are the estimated downtime durations for version that require significant downtime:
The v5.3.0 schema change may take more than an hour to complete depending on the amount of data in your reporting system.
The v5.6.0 schema change may take 2 hours or more depending on the amount of data in your system.
The v5.11.x schema change will take approximately 1-2 minutes to complete for every 1 million vulnerable artifacts in your reporting system.
If your Anchore Enterprise deployment is on FIPS enabled hosts and your database is being hosted on Amazon RDS, an upgrade to Postgres 16 or greater is required. For more information please see the FIPS section in Requirements.
Improvements
System Configuration
The Anchore Enterprise API has new endpoints to view system configuration and dynamically change a few configuration values.
GET /v2/system/configurations
PATCH /v2/system/configurations
GET /v2/system/configurations/{config_key}
PUT /v2/system/configurations/{config_key}
DELETE /v2/system/configurations/{config_key}
Restores the configuration value to the default value.
The following system configuration values are now configurable via the API:
When using the max_days_since_fix within the VulnerabilityGate and PackageTrigger, the findings will now provide the following data:
fixed in - the version which the fix was applied.
max_days_since_creation - the number of days since the finding was created.
vuln_detected - the date the vulnerability was detected.
fix_released - the date the fix was released.
max_days_since_fix - the number of days since the fix was applied per your policy trigger.
Reports
The following reports now include the field Artifact Vulnerable From which is the date when Anchore’s Reporting Service first detected the vulnerability on the artifact:
Runtime Inventory Images by Vulnerability
Tags by Vulnerability
Artificts by Vulnerability
Logging
Structured log output now provides the service name and service version.
Memory Usage
If your deployment is configured to use the Object Store Database Driver, the memory usage profile of the Catalog Service will be reduced.
Fixes
Policy-engine service gracefully handles errors when the catalog service no longer can access images referenced by ancestors.
Policy Gate packages with Trigger required_package now correctly allows the version match type to detect a minimum package version.
Policy Gate packages with Trigger required_package now correctly handles some java packages that do not have a proper version string. When the version comparison fails, the policy will now trigger a finding.
The Data-syncer Service now correctly removes older versions of GrypeDB from the Object Store.
Deprecations
Support for OpenStack Swift, which is an open-source object storage system, has been deprecated. Please see Object Storage for a list of supported Object Stores.
The enterprise-gitlab-scan plugin is being deprecated in favor of using AnchoreCTL directly in your pipelines. Please see GitLab for more information on integrating Anchore Enterprise with GitLab.
UI Updates
Improvements
Admins can now verify and manage system settings with our new Configuration view within the System tab. Editable configuration options are displayed by default and read-only items are searchable and accessible for viewing via a toggle. The options currently available for editing include global / service-level log levels and enabling the ClamAV Malware Scanner.
The following report templates now include the Artifact Vulnerable From field by default which is the date when Anchore’s Reporting Service first detected the vulnerability on the artifact:
Runtime Inventory Images by Vulnerability
Tags by Vulnerability
Artifacts by Vulnerability
Fixes
Within the Kubernetes tab, search text could sometimes lag behind what a user was typing as the table updated dynamically. Now, searching is seamless during updates and intermediate network requests are canceled.
Previously, when an admin wanted to update their LDAP configuration, the password field was required even if the password was not being updated. This is no longer the case.
Feed errors within the System > Health view are now handled gracefully and displayed within their section rather than obfuscating the entire page.
When a user logged into an account context containing special characters after a system restart, the user would be automatically redirected to their default account. This has been fixed.
Various supporting libraries have been updated in order to improve security, performance, and also to remove deprecation warnings from browser and server output logs. Redundant libraries have been removed to reduce the app startup time and overall size.
13.1.33 - Anchore Enterprise Release Notes - Version 5.13.1
Anchore Enterprise v5.13.1
Warning if using Vulnerability Gate with Max Days Since Fixed Trigger
If you are using the Vulnerabilities policy gate, package with a Max Days Since Fix trigger, we strongly recommend upgrading directly to v5.17.x or greater to avoid a regression with the handling of the Vulnerability Fix Observed At Date.
If upgrading from a release in the range of v5.0.0 - v5.12.x
The upgrade will result in an automatic schema change that will require database downtime. Below are the estimated downtime durations for version that require significant downtime:
The v5.3.0 schema change may take more than an hour to complete depending on the amount of data in your reporting system.
The v5.6.0 schema change may take 2 hours or more depending on the amount of data in your system.
The v5.11.x schema change will take approximately 1-2 minutes to complete for every 1 million vulnerable artifacts in your reporting system.
If your Anchore Enterprise deployment is on FIPS enabled hosts and your database is being hosted on Amazon RDS, an upgrade to Postgres 16 or greater is required. For more information please see the FIPS section in Requirements.
Fixes
Fixes a potential deadlock that was seen when large deployments (32 services or more) booted up. This manifested as the services being unable to log messages and would not fully come to an active state.
Deprecations
Support for OpenStack Swift, which is an open-source object storage system, has been deprecated. Please see Object Storage for a list of supported Object Stores.
The enterprise-gitlab-scan plugin is being deprecated in favor of using AnchoreCTL directly in your pipelines. Please see GitLab for more information on integrating Anchore Enterprise with GitLab.
13.1.34 - Anchore Enterprise Release Notes - Version 5.13.0
Anchore Enterprise v5.13.0
Warning for Large Deployments
This release contains a potential deadlock seen when booting the services on initial install or after an upgrade. Customers with large deployments (32 or more services) should consider upgrading directly to v5.13.1 to avoid any possible issues.
Warning if using Vulnerability Gate with Max Days Since Fixed Trigger
If you are using the Vulnerabilities policy gate, package with a Max Days Since Fix trigger, we strongly recommend upgrading directly to v5.17.x or greater to avoid a regression with the handling of the Vulnerability Fix Observed At Date.
If upgrading from a release in the range of v5.0.0 - v5.12.x
The upgrade will result in an automatic schema change that will require database downtime. Below are the estimated downtime durations for version that require significant downtime:
The v5.3.0 schema change may take more than an hour to complete depending on the amount of data in your reporting system.
The v5.6.0 schema change may take 2 hours or more depending on the amount of data in your system.
The v5.11.x schema change will take approximately 1-2 minutes to complete for every 1 million vulnerable artifacts in your reporting system.
If your Anchore Enterprise deployment is on FIPS enabled hosts and your database is being hosted on Amazon RDS, an upgrade to Postgres 16 or greater is required. For more information please see the FIPS section in Requirements.
Improvements
Malware Scanning is now available on images larger than 4 GB.
For images larger than 4 GB, Enterprise will split images into individual files of 2 GB or smaller.
Any files within the image that are greater than 2 GB will be skipped during analysis. Any skipped file will be identified with a Malware Signature as ANCHORE.FILE_SKIPPED.MAX_FILE_SIZE_EXCEEDED.
When performing Malware Scanning on these larger images, please expect an increase in your analysis time.
A new configuration option malware.clamav.max_scan_time has been added to the analyzer_config.yaml. This will allow for the configuration of the maximum time allowed for a single scan. The default value is 30 minutes.
The Malware Policy Gate with the Scan Findings Trigger will ignore the new ANCHORE.FILE.SKIPPED.SIZE_EXCEEDED findings as they do not represent positively identified malware. Instead, these findings can be identified using the Scan Not Run trigger by enabling the fire_on_skipped_files parameter.
Fixes
The data-syncer service now correctly frees memory and disk space after processing each dataset.
Addresses an issue where Vulnerability Fix field’s value can change when a RHEL image that contains perl is re-analyzed.
Fixes an error that occurs when an analyzer service fails to parse the clamav db metadata.
Corrects two issues with the config parsing, which is completed at startup, causing an error seen in the catalog or policy-engine Service.
The first issue was when the root level webhooks was not present.
The second issue was when the services.policy_engine.vulnerabilities.matching.exclude was not present.
Fixes an analysis race condition that could cause two analyzer services to attempt to analyze the same image at the same time. This would lead to the image analysis failing and would require a manual request for a force reanalysis.
Images that are imported from AnchoreCTL now correctly benefit from the complete list of supported package types.
Fixes a condition where a large number of system events could cause the notification service to fail to forward the notifications.
Deprecations
Support for OpenStack Swift, which is an open-source object storage system, has been deprecated. Please see Object Storage for a list of supported Object Stores.
The enterprise-gitlab-scan plugin is being deprecated in favor of using AnchoreCTL directly in your pipelines. Please see GitLab for more information on integrating Anchore Enterprise with GitLab.
UI Updates
Improvements
The status of Kubernetes inventory agents are now displayed within the System > Health view. This allows administrators to quickly identify that all agents are reporting in as expected.
The Image Selection view now includes the ability to remove repositories without any images from the system.
Fixes
A regression was introduced in the previous release where the route was preserved upon logout. This has now been fixed.
The name field in the Add a New Registry Credential became required because of a code regression. It is now optional again.
Fix for a scenario whereby a user without any pre-existing tour-state properties would not have them assigned on login. Now addressed.
Various supporting libraries have been updated in order to improve security, performance, and also to remove deprecation warnings from browser and server output logs. Redundant libraries have been removed to reduce the app startup time and overall size.
13.1.35 - Anchore Enterprise Release Notes - Version 5.12.0
Anchore Enterprise v5.12.0
Warning for Large Deployments
This release introduced a potential deadlock seen when booting the services on initial install or after an upgrade. Customers with large deployments (32 or more services) should consider upgrading directly to v5.13.1 to avoid any possible issues.
Warning if using Vulnerability Gate with Max Days Since Fixed Trigger
If you are using the Vulnerabilities policy gate, package with a Max Days Since Fix trigger, we strongly recommend upgrading directly to v5.17.x or greater to avoid a regression with the handling of the Vulnerability Fix Observed At Date.
If upgrading from a release in the range of v5.0.0 - v5.11.x
The upgrade will result in an automatic schema change that will require database downtime. Below are the estimated downtime durations for version that require significant downtime:
The v5.3.0 schema change may take more than an hour to complete depending on the amount of data in your reporting system.
The v5.6.0 schema change may take 2 hours or more depending on the amount of data in your system.
The v5.11.x schema change will take approximately 1-2 minutes to complete for every 1 million vulnerable artifacts in your reporting system.
If your Anchore Enterprise deployment is on FIPS enabled hosts and your database is being hosted on Amazon RDS, an upgrade to Postgres 16 or greater is required. For more information please see the FIPS section in Requirements.
Improvements
The Exploit Prediction Scoring System (EPSS) is now included as an additional dataset from the Anchore Data Service. It is automatically
downloaded by the Data-Syncer Service.
This dataset is used in the Vulnerabilities Policy Gate and Package Trigger with optional parameters:
EPSS Score Comparison
EPSS Score
EPSS Percentile Comparison
EPSS Percentile
RBAC
New RBAC role called image-delete has been added. This role allows users to delete images, sources and archives from the system.
Removed additional authorization checks for adding the special annotation anchore.user/marked_base_image to an image.
API
New endpoint which returns the currently enabled resource-limits (if any) and the current usage of those limits. GET /v2/system/resource-limits
Metric
New metrics have been added to provide more data around the database pool
anchore_db_pool_size - Max Number of connections in the pool
anchore_db_pool_available - Number of connections available for use in the pool
anchore_db_pool_in_use - Number of connections currently in use
SBOM
Enterprise will no longer surface packages with unknown versions. This will reduce the number of false positives seen during analysis.
Logging
When structured logging is enabled, the output on disk will include the json output as well as the normal text format which is easier to read.
Fixes
Improves error handling during image analysis that could have caused unnecessary analysis failures.
Fixes the permission when deleting a source artifact from the system. Only users with system-admin, full-control, read-write, or image-delete roles can delete sources.
Improves handling of alpine patch versions during vulnerability matching. For more information please see issue.
Fixes an upgrade failure, seen during an upgrading to a v5.11.x release, when parent_digest is Null within the reports_images database table.
Fixes a policy eval failure that is seen when multiple evaluations on the same image are running concurrently.
Deprecations
Support for OpenStack Swift, which is an open-source object storage system, has been deprecated. Please see Object Storage for a list of supported Object Stores.
The enterprise-gitlab-scan plugin is being deprecated in favor of using AnchoreCTL directly in your pipelines. Please see GitLab for more information on integrating Anchore Enterprise with GitLab.
UI Updates
Improvements
The authenticated interface has been updated with a new vertical
navigation bar that offers quick access to various views within the
application. The navigation bar is collapsible and responsive,
enhancing the user experience by providing a streamlined interface.
Additionally, the open or collapsed state of the navigation bar is
now persisted across sessions. This new navigation bar lays the
groundwork for future global controls and usability enhancements.
The application now uses the full width of the screen, offering more
space for content. The font size and visual elements dynamically
adjust to the viewport size, ensuring a consistent user experience
across various screen widths and resolutions.
The image-delete role has been added to the RBAC system. This role allows
users to delete images, sources, and archives from the system and is now
provided amongst the other RBAC settings in the user and group management
controls under System.
The EPSS service is now available as a datasource for use by policy gates and
triggers in the Policy Manager. This service provides a score and
percentile for each vulnerability based on the likelihood of exploitation. The
EPSS score and percentile can be used as parameters in the Vulnerabilities
policy gate, and Package trigger. The availability and health of this
service is displayed alongside the other service details in the
System > Health view.
Fixes
The API Keys breadcrumb no longer includes the account name and now
displays only the username. Since API keys are not tied to a
specific account and user permissions may allow switching between
accounts, this change helps eliminate ambiguity.
The page displayed when a license has expired or is invalid now
contains links to the Anchore Support
page instead of an email address.
Various supporting libraries have been updated in order to improve
security, performance, and also to remove deprecation warnings from
browser and server output logs. Redundant libraries have been
removed to reduce the app startup time and overall size.
13.1.36 - Anchore Enterprise Release Notes - Version 5.11.1
Anchore Enterprise v5.11.1
Note
Two customers experienced an upgrade failure to the v5.11.x release. The failure occurred when a parent_digest field is set to Null within the reports_images database table. This condition has been properly handled in the v5.12.0 database schema changes. Please consider upgrading directly to v5.12.0 to avoid any possible issues.
If upgrading from a release in the range of v5.0.0 - v5.10.0
The upgrade will result in an automatic schema change that will require database downtime.
The v5.3.0 schema change may take more than an hour to complete depending on the amount of data in your reporting system.
The v5.6.0 schema change may take 2 hours or more depending on the amount of data in your system.
The v5.11.1 schema change will take approximately 1-2 minutes to complete for every 1 million vulnerable artifacts in your reporting system.
If your Anchore Enterprise deployment is on FIPS enabled hosts and your database is being hosted on Amazon RDS, an upgrade to Postgres 16 or greater is required. For more information please see the FIPS section in Requirements.
Fixes
Addresses a communication failure between the Anchore Enterprise services seen only when your deployment is configured to use internal SSL.
internalServicesSSL.enable: true
Deprecations
Support for OpenStack Swift, which is an open-source object storage system, has been deprecated. Please see Object Storage for a list of supported Object Stores.
Package Feeds and Policy Gates for Ruby Gems and NPMs, are now EOL. Please contact Anchore Support for more information.
The enterprise-gitlab-scan plugin is being deprecated in favor of using AnchoreCTL directly in your pipelines. Please see GitLab for more information on integrating Anchore Enterprise with GitLab.
Feed Service: The Feed Service has been deprecated and replaced by the Data Syncer service. The Feed Service is no longer supported in Enterprise installations.
Package Feeds: The Ruby Gems and NPMs package feeds and policy gates have been declared End Of life and are no longer supported.
13.1.37 - Anchore Enterprise Release Notes - Version 5.11.0
Anchore Enterprise v5.11.0
Note
Two customers experienced an upgrade failure to the v5.11.x release. The failure occurred when a parent_digest field is set to Null within the reports_images database table. This condition has been properly handled in the v5.12.0 database schema changes. Please consider upgrading directly to v5.12.0 to avoid any possible issues.
If upgrading from a release in the range of v5.0.0 - v5.10.0
The upgrade will result in an automatic schema change that will require database downtime.
The v5.3.0 schema change may take more than an hour to complete depending on the amount of data in your reporting system.
The v5.6.0 schema change may take 2 hours or more depending on the amount of data in your system.
The v5.11.0 schema change will take approximately 1-2 minutes to complete for every 1 million vulnerable artifacts in your reporting system.
If your Anchore Enterprise deployment is on FIPS enabled hosts and your database is being hosted on Amazon RDS, an upgrade to Postgres 16 or greater is required. For more information please see the FIPS section in Requirements.
Improvements
RBAC
New ability to assign administrative privileges to users who are not members of the admin account. This role may be granted either directly be another admin user or via a User Group membership.
RBAC Role name: system-admin
RBAC Domain Name: *
API
New endpoint GET /v2/accounts/users returns a list of all users in the system, including their roles and the accounts to which they belong. This is only available to admin users.
New endpoint GET /v2/accounts/{account_name}/users-with-roles returns a list of users that have been granted roles in the specified account.
The following endpoints have improved data associated with Users and RBAC Roles. Each user object includes a list of roles that have been granted to the user and an indication of how the role has been granted.
GET /v2/user
GET /v2/accounts/users
GET /v2/accounts/{account_name}/users
GET /v2/accounts/{account_name}/users-with-roles
Improved the response time of endpoints that return a list of users.
Improved the response time of GET /v2/system/user-groups
The endpoint GET /v2/system/statistics now includes the following new metrics:
report_creation - The number of reports that have been created.
report_inventory - The number of generated reports currently in the system.
Configuration
Added log messages which warn the user when an incorrect configuration value is detected.
Integration Health Status
When using the k8s-inventory agent release v1.7.0, the agent will automatically register itself with the Anchore Enterprise. It will then send periodic health status updates so you can validate the health of your k8s-inventory agents directly from Enterprise.
The API has new endpoints to view the health status of the k8s-inventory agent.
GET /v2/integrations/k8s-inventory/health
GET /v2/integrations/k8s-inventory/health/{agent_id}
New AnchoreCTL commands are available to view integration health.
Improves database space usage for the following reports by reorganizing the data into new tables:
Vulnerabilities by ECS Container
Vulnerabilities by Kubernetes Container
Vulnerabilities by Kubernetes Namespace
Once the upgrade is complete and you are comfortable with the resulting reports, you may wish to truncate the legacy tables and reduce database space usage.
Policy
Add support for the value parameter when the check parameter is exists or not exists. Previously the value parameter would be ignored for these check types.
SBOM Improvements
Utilizes a new JVM cataloger which improves the identification of java installs which occur outside of an OS package manager. This also normalizes version comparison logic for earlier java versions which did not use semantic versioning which should lead to more accurate vulnerability matching.
Adds vulnerability matching support for Azure Linux 3
Adds support for identifying OCaml packages
Adds binary classifiers for the following:
curl
dart
haskell
ghttp
proftpd
zstd
xz
gzip
jq
sqlcipher
Fixes
Fixes an issue where some java-archive artifact had a blank Name or Version field within the Syft SBOM.
Fixes an issue where GET /v2/accounts/{account_name}/users/{username} endpoint failed to return all the user’s roles when some had been granted via a User Group membership.
Returns a more specify error code and response to GET /v2/images/{image_digest}/check when specifying an invalid policy_id.
Policy Creation Metric now correctly increments when a policy is created via the API. This policy_creation metric can be seen in the GET /v2/system/statistice endpoint.
Minor fixes to the debug level logging within the API Service.
The Ancestry Policy Gate with allowed base image tags Trigger now allows wildcard matching for base image tags.
Fixes a missing event when a report in the pending state has been cancelled.
Improves error handling for GET /v2/images/{image_digest}/check when specifying base_digest=auto.
Fixes an issue with the Dockerfile Policy Gate where we failed to handle multi-line directives.
Using the POST /v2/policies API with an existing policy ID will now fail with a 409 response instead of incorrectly updating the existing policy. Please use PUT /v2/policies/{policy_id} to update policies.
Fixes an issue in the response code of POST /v2/vulnerability-scan.
Deprecations
Support for OpenStack Swift, which is an open-source object storage system, has been deprecated. Please see Object Storage for a list of supported Object Stores.
Package Feeds and Policy Gates for Ruby Gems and NPMs, are now EOL. Please contact Anchore Support for more information.
The enterprise-gitlab-scan plugin is being deprecated in favor of using AnchoreCTL directly in your pipelines. Please see GitLab for more information on integrating Anchore Enterprise with GitLab.
Feed Service: The Feed Service has been deprecated and replaced by the Data Syncer service. The Feed Service is no longer supported in Enterprise installations.
Package Feeds: The Ruby Gems and NPMs package feeds and policy gates have been declared End Of life and are no longer supported.
UI Updates
Improvements
In this release, administrators are identified by the presence of
the system-admin role. This role is automatically assigned to
users in the admin account, but users in other accounts can be
promoted to or demoted from an administrative role through this
assignment. The role can be directly assigned to a user during
account creation or indirectly through group membership. Note that
this role is read-only for users in the admin account.
Markdown markup is now supported in the Recommendation field of
a policy rule. This allows for more detailed explanations to be
provided to users when a policy rule is triggered.
Fixes
Multiple fixes applied to improve the appearance of the UI theme
Because of a mishandled error condition, a non-admin user would be
logged out if they try to access a global report, which can occur if
they click on an associated report link surfaced on the the
In previous versions of the application, column widths in the
Artifact Analysis view would reset to their default values when
the page state changed due to background data updates. This issue
has now been resolved, and column widths will persist even when the
underlying data changes.
The card view is now the default for Feeds Sync details on the
System Health page. However, if a user has previously overridden
this setting, the table view will still be applied. Additionally,
dataset and checksum names are now displayed on the cards. Aesthetic
adjustments have been made to support these changes.
In previous versions of the application, selecting all visible
events while a filter was applied would inadvertently select all
events, not just the visible ones. This issue has now been resolved,
ensuring that only visible events are selected when a filter is
active. Additionally, an issue with string-based filtering—where the
filter failed to correctly match the user-entered string in the
To remain consistent with the outcome of changes made against
individual users, changes made to user groups will now trigger a
log out event for any users associated with any user groups that are
modified or deleted.
Various supporting libraries have been updated in order to improve
security, performance, and also to remove deprecation warnings from
browser and server output logs. Redundant libraries have been
removed to reduce the app startup time and overall size.
13.1.38 - Anchore Enterprise Release Notes - Version 5.10.0
Anchore Enterprise v5.10.0
Note
The Feed Service has been replaced by a new Enterprise service called the “Data Syncer”. Enterprise no longer supports running a separate feed service.
If upgrading from a release in the range of v5.0.0 - v5.9.0
The upgrade will result in an automatic schema change that will require database downtime.
The v5.3.0 schema change may take more than an hour to complete depending on the amount of data in your reporting system.
The v5.6.0 schema change may take 2 hours or more depending on the amount of data in your system.
The v5.7.0 - v5.9.0 schema change will require minimal database downtime.
If your Anchore Enterprise deployment is on FIPS enabled hosts and your database is being hosted on Amazon RDS, an upgrade to Postgres 16 or greater is required. For more information please see the FIPS section in Requirements.
Improvements
Data Syncer Service: The Feed Service has been replaced by a new Enterprise service called the “Data Syncer”. Enterprise no longer supports running a separate feed service. The Data Syncer Service is responsible for syncing data from the Anchore Data Service to the Enterprise installation. The Data Syncer Service is a core service in the Enterprise installation and is required for the system to function correctly.
A new vulnerability exclusion mechanism has been added to the Policy Engine. This replaces the previous ability to disable specific providers in the on-prem feed service. See Data Synchronization for more information on configuration.
Fixes
Resolves an issue that would prevent images that had no vulnerabilities detected in the past from reporting future vulnerabilities.
Deprecations
Support for OpenStack Swift, which is an open-source object storage system, has been deprecated. Please see Object Storage for a list of supported Object Stores.
Package Feeds and Policy Gates for Ruby Gems and NPMs, are now EOL. Please contact Anchore Support for more information.
The enterprise-gitlab-scan plugin is being deprecated in favor of using AnchoreCTL directly in your pipelines. Please see GitLab for more information on integrating Anchore Enterprise with GitLab.
Feed Service: The Feed Service has been deprecated and replaced by the Data Syncer service. The Feed Service is no longer supported in Enterprise installations.
Package Feeds: The Ruby Gems and NPMs package feeds and policy gates have been declared End Of life and are no longer supported.
UI Updates
Improvements
Data from Anchore Hosted Feeds is now synchronized to your local
enterprise installation via the Data Syncer service, and represented in the
system health view under System.
Fixes
With very large sets of groups and users, the time taken to store an
updated SSO IDP definition could be very long. This issue has now been
addressed.
Bulk selection of events when using a filtered list was including
items outside of the filter context. This issue has now been fixed. In addition, the table-filter control have been updated to permit compound filter strings corresponding to different table columns, and both the table- and advanced-filter
will now match whitespace in the Event Source table field.
Various supporting libraries have been updated in order to improve
security, performance, and also to remove deprecation warnings from
browser and server output logs. Redundant libraries have been
removed to reduce the app startup time and overall size.
13.1.39 - Anchore Enterprise Release Notes - Version 5.9.0
Anchore Enterprise v5.9.0
Anchore Enterprise release v5.9.0 contains targeted fixes and improvements.
Attention Feed Service
In the future v5.10.0 release, the Feed Service will be obsolete and replaced by a new Enterprise service that will import feed data directly from the new hosted Anchore Data Service. The v5.10.0 release will also provide enhanced support for air-gapped deployments. The goal of this change is to reduce operational burden for our end users and allow for faster response to changes in upstream data providers. More information about this migration will be provided leading up to the release of v5.10.0.
If upgrading from a release in the range of v5.0.0 - v5.8.1
The upgrade will result in an automatic schema change that will require database downtime.
The v5.3.0 schema change may take more than an hour to complete depending on the amount of data in your reporting system.
The v5.6.0 schema change may take 2 hours or more depending on the amount of data in your system.
The v5.7.0 - v5.8.1 schema change will require minimal database downtime.
If your Anchore Enterprise deployment is on FIPS enabled hosts and your database is being hosted on Amazon RDS, an upgrade to Postgres 16 or greater is required. For more information please see the FIPS section in Requirements.
Improvements
Package Types
Enterprise has increased the number of supported package types to be aligned with what is currently supported by Syft. Below is a list of the newly available package types:
ArchLinux alpm (under os)
CocoaPods
Conan
Dart Pub
Erlang/OTP
Gentoo Portage (under os)
GitHub Action Workflows
GitHub Actions
Hackage
Hex (Erlang)
Linux Kernel
Linux Kernel Module
LuaRocks
NixOS packages (under os)
PHP Composer
PHP PECL
R Package
Rust Crate
SWI-Prolog
Swift
WordPress Plugins
Policy
The Default Policy, which is automatically available in newly created accounts, has been renamed Anchore Enterprise - Secure - Default Policy. It has also received some updates to its rule sets.
The CIS Policy is no longer automatically available during new accounts creation.
The anchore_security_only Policy is no longer automatically available during new accounts creation.
Theancestry gate now supports denylisting ancestor images by tag or digest.
API
POST /v2/repositories endpoint now includes a query parameter exclude_existing_tags which when set will exclude tags that are already present in the repository. Only newly created tags will be added to the Enterprise system.
GET /v2/system/statistics API endpoint now includes the following
account_creation
account_inventory
user_creation
user_inventory
report_execution_inventory
image_inventory
source_inventory
GET /v2/summaries/image-tags endpoint now includes an optional flag runtime which when set to true will return only tags that are found in the runtime inventory.
Report Graphql
Support was added to cancel a report execution that is currently running or queued.
Fixes
The SPDX format will now have the correct originator field for JAVA jar packages.
Addresses an issue where Native Users that had active UI sessions continue to be able to access reports after Native Users are disabled.
Improves the error handling when listing policies that have a missing or invalid policy digest.
Fixes debug logging in the authorization path within the API Service.
Fixes an issue where we failed to fetch vulnerabilities for an Alpine image due to improper constraints.
The metadata trigger in the packages gate will now default to an equality (’=’) comparison for the package type, name and version fields. The comparison can be controlled by specifying the type_comparison, name_comparison or version_comparison parameters.
Deprecations
Support for OpenStack Swift, which is an open-source object storage system, has been deprecated. Please see Object Storage for a list of supported Object Stores.
Package Feeds and Policy Gates for Ruby Gems and NPMs, are now deprecated. Please contact Anchore Support for more information.
The enterprise-gitlab-scan plugin is being deprecated in favor of using AnchoreCTL directly in your pipelines. Please see GitLab for more information on integrating Anchore Enterprise with GitLab.
The Feed Service is deprecated in v5.8.0. Starting in v5.10.0 a new service will be introduced to synchronize Feed data from a hosted Anchore Data Service.
UI Updates
Improvements
The SBOM tab within the Image and Source Analysis views now supports many more package types such as Conan, Swift, etc.
A new Usage tab for administrators has been added to the System view which displays metrics related to SBOMs analyzed, total number of accounts, and the total number of users in the system. This tab is meant to provide insights into your installation and the value Anchore delivers. Additional detail is available for download as a JSON file.
The Analyze Repository dialog in the Image Selection view now has an option to exclude existing tags from analysis. This is ideal for scanning very large repositories without pulling in unnecessary history.
The Analyze Tag dialog now allows a Dockerfile to be uploaded when you submit a tag or image digest for analysis. The Dockerfile can then be used for policy gates which rely on it rather than the ‘guessed’ one.
The Incomplete Analyses modal within the Image Selection view has been further optimized to improve performance via server-side pagination, filtering, and sorting.
Within the Reports tab, users can now manually stop generating a report that is pending or currently running. For large-scale systems, this can be useful to prevent a report from consuming significant resources.
Within the Reports tab, the Account column is currently included by default for most of our system templates. This field is necessary when viewing global reports (results scoped to multiple accounts). When a new, global report is based on a template that does not include the Account column, the column is now automatically added during the report preview. Similarly, if the local scope is configured instead, the Account column is automatically removed during report preview. The column can still be manually added or removed prior to report creation.
Fixes
Users with the createRepository permission can now analyze a repository even if one or more tags have already been analyzed. Previously, a conflict would occur if the underlying repo_update subscription existed, regardless if it was active or not.
Previously, report filter values were not trimmed of whitespace prior to previewing a report. This issue is now fixed.
When sorting a report by a column that contains null values, the sorting order was incorrectly handled. This issue has now been addressed.
When deleting event(s) from the Events view, the confirmation modal buttons have had their language updated to be more descriptive. Instead of ‘Yes’ or ‘No’, the buttons now read ‘Delete’ and ‘Cancel’.
Various supporting libraries have been updated in order to improve security, performance, and also to remove deprecation warnings from browser and server output logs.
13.1.40 - Anchore Enterprise Release Notes - Version 5.8.1
Anchore Enterprise v5.8.1
Anchore Enterprise release v5.8.1 contains targeted fixes and improvements.
Attention Feed Service
In the future v5.10.0 release, the Feed Service will be obsolete and replaced by a new Enterprise service that will import feed data directly from Anchore every six (6) hours. The future v5.9.0 release will be the last to use the Feed Service on-premises. The v5.10.0 release will also provide enhanced support for air-gapped deployments. The goal of this change is to reduce operational burden for our end users and allow for faster response to changes in upstream data providers. More information about this migration will be provided leading up to the release of v5.10.0.
If upgrading from a release in the range of v5.0.0 - v5.3.0
The upgrade will result in an automatic schema change that will require database downtime. We are anticipating that this schema change may take more than an hour to complete depending on the amount of data in your reporting system.
If your Anchore Enterprise deployment is on FIPS enabled hosts and your database is being hosted on Amazon RDS, an upgrade to Postgres 16 or greater is required. For more information please see the FIPS section in Requirements.
If upgrading from a release in the range of v5.4.x - v5.6.0
The upgrade will result in an automatic schema change that will require database downtime. We expect that this could take up to 2 hours depending on the amount of data in your system.
If upgrading from the v5.7.0 release
The upgrade will result in an automatic schema change that will require minimal database downtime.
If upgrading from the v5.8.0 release, no additional action is needed.
Fixes
Resolves an issue in the kev list policy trigger added in v5.8.0 that prevented it from trigger on vulnerabilities matched from some data sources.
Deprecations
Support for OpenStack Swift, which is an open-source object storage system, has been deprecated. Please see Object Storage for a list of supported Object Stores.
Package Feeds and Policy Gates for Ruby Gems and NPMs, are now deprecated. Please contact Anchore Support for more information.
The enterprise-gitlab-scan plugin is being deprecated in favor of using AnchoreCTL directly in your pipelines. Please see GitLab for more information on integrating Anchore Enterprise with GitLab.
The Feed Service is deprecated in v5.8.0. Starting in v5.10.0 a new service will be introduced to synchronize Feed data from Anchore.
13.1.41 - Anchore Enterprise Release Notes - Version 5.8.0
Anchore Enterprise v5.8.0
Anchore Enterprise release v5.8.0 contains targeted fixes and improvements.
Attention Feed Service
In the future v5.10.0 release, the Feed Service will be obsolete and replaced by a new Enterprise service that will import feed data directly from Anchore every six (6) hours. The future v5.9.0 release will be the last to use the Feed Service on-premises. The v5.10.0 release will also provide enhanced support for air-gapped deployments. The goal of this change is to reduce operational burden for our end users and allow for faster response to changes in upstream data providers. More information about this migration will be provided leading up to the release of v5.10.0.
If upgrading from a release in the range of v5.0.0 - v5.3.0
The upgrade will result in an automatic schema change that will require database downtime. We are anticipating that this schema change may take more than an hour to complete depending on the amount of data in your reporting system.
If your Anchore Enterprise deployment is on FIPS enabled hosts and your database is being hosted on Amazon RDS, an upgrade to Postgres 16 or greater is required. For more information please see the FIPS section in Requirements.
If upgrading from a release in the range of v5.4.x - v5.6.0
The upgrade will result in an automatic schema change that will require database downtime. We expect that this could take up to 2 hours depending on the amount of data in your system.
If upgrading from the v5.7.0 release
The upgrade will result in an automatic schema change that will require minimal database downtime.
Improvements
KEV (Known Exploited Vulnerabilities) Support
The KEV list is now available to be ingested as a Vulnerability Annotation feed within the Feed Service. The KEV list feed will be enabled by default within the helm chart. See Feeds for more info.
A new KEV List Trigger is now available as part of the Vulnerability Policy Gate. See Policy Checks for more info.
This replaces the CISA KEV Vulnerabilities Policy Pack, which can be removed after validating the behavior of this new trigger.
Improve the obfuscation of user credentials in the logs.
Allowlist entries can now include a specific package version. This can be accomplished by adding both the Package Name and Version in the “Package” field within the allowlist UI editor.
Improved the authentication path performance when using the User Group feature at scale.
Fixes
Improves error logs found in the report-worker service to include better information when an error occurs.
Fixes the issue where a success status is returned when deleting an image without the force flag when the image is not allowed to be deleted. This can occur when it is the latest image of the tag or if it has active subscriptions.
Fixes an issue where a repository watch subscription can be created or activated without having the proper RBAC permissions.
Removal of obsolete report-worker task data in the database. This would have no effect on the running system. The cleanup will take place during the db schema migration and is just a small cleanup of old data within the database.
Account Deletion
Ensure that the system will properly clean up an account and its associated data when the account name contains special characters.
Ensure that the system will properly delete any RBAC Principals associated with the account.
If the Disallow Native User feature is enabled, the system will now properly prevent access to GraphQL endpoints and System endpoints by native users.
Deprecations
Support for OpenStack Swift, which is an open-source object storage system, has been deprecated. Please see Object Storage for a list of supported Object Stores.
Package Feeds and Policy Gates for Ruby Gems and NPMs, are now deprecated. Please contact Anchore Support for more information.
The enterprise-gitlab-scan plugin is being deprecated in favor of using AnchoreCTL directly in your pipelines. Please see GitLab for more information on integrating Anchore Enterprise with GitLab.
The Feed Service is deprecated in v5.8.0. Starting in v5.10.0 a new service will be introduced to synchronize Feed data from Anchore.
UI Updates
Improvements
The Kubernetes view has been refactored with an improved data
retrieval strategy to allow the component to work at a larger scale.
Summary information is now fetched independently of the main
dataset, and data fetches for the cluster and namespace tiers are
now compartmentalized. Additional improvements have been made to the
filtering and data composition operations to enhance performance and
reduce time to availability. Please note that the reports service
must be enabled to use this view.
Fixes
The error component used to display inline errors would overflow if
the error information was too voluminous, sometimes exceeding the
height of the viewport. The control is now constrained to a maximum
height and is scrollable.
Several issues related to context-based routing, introduced in the
previous release, were discovered. These issues primarily affected
legacy routes that did not contain an account entry upon logging in.
Additionally, a fix has been provided for manually changing the
context in the URL for routes with URI encoded entries (such as
Artifact Analysis). Previously, these routes would lose encoding
on reload, resulting in a 404 error. These and other routing
issues have now been addressed.
Adding an LDAP URI without the ldap:// or ldaps:// protocol
would crash the app when testing the configuration or logging in
using LDAP. Guards against this error are now in place, and the
protocol prefix is now mandatory.
Changing permissions could sporadically cause the app to crash due
to an error in the event broadcast triggered by this action. This
issue has been resolved.
Under certain circumstances, an error response from the SSO provider
during authentication would crash the app. Error handling has been
updated to gracefully manage errors and provide detailed information
to the user.
In deployments where SSO is the sole authentication scheme, the
LDAP authentication option was still present on the login page.
This is no longer the case.
When an error occurred during the operation of submitting a
repository for analysis, the toast message describing the problem
was not raised. This issue has been addressed.
Due to a missing role-based access control permission, users without
the createRepository permission could still interact with the
Watch Repository toggle. This issue is now fixed.
Previously, it was not possible to add more than one annotation from
the Metadata tab in the Artifact Analysis view.
Additionally, adding a single annotation would result in an
erroneous redirect. Both issues have been addressed.
Non-Chrome users who had not previously set their view theme would
find the app defaulting to dark mode after invoking the print view
control (present in the Policy Compliance and
Vulnerabilities tabs). This issue has been resolved.
Various supporting libraries have been updated in order to improve
security, performance, and also to remove deprecation warnings from
browser and server output logs. Redundant libraries have been
removed to reduce the app startup time and overall size.
13.1.42 - Anchore Enterprise Release Notes - Version 5.7.0
Anchore Enterprise v5.7.0
Anchore Enterprise release v5.7.0 contains targeted fixes and improvements.
Attention
The v5.5.0 release changed the defaults for the feed provider’s configuration. The new defaults will import results published by Anchore every six (6) hours. This will reduce configuration to multiple sources, provide the NVD with Anchore Enriched data, as well as make GitHub Security Advisories available to customers that have firewall constraints. Please ensure that you have access to https://enterprise.vunnel.feed.anchore.io for uninterrupted feeds service.
If upgrading from a release in the range of v5.0.0 - v5.3.0
The upgrade will result in an automatic schema change that will require database downtime. We are anticipating that this schema change may take more than an hour to complete depending on the amount of data in your reporting system.
If your Anchore Enterprise deployment is on FIPS enabled hosts and your database is being hosted on Amazon RDS, an upgrade to Postgres 16 or greater is required. For more information please see the FIPS section in Requirements.
If upgrading from a release in the range of v5.4.x - v5.6.x
The upgrade will result in an automatic schema change that will require database downtime. We expect that this could take up to 2 hours depending on the amount of data in your system.
Improvements
Adds the ability for users to override the base image used throughout the system. This is accomplished by adding an image annotation to the image anchore.user/marked_base_image.
API endpoints /v2/images/{image_digest}/check and /v2/images/{image_digest}/vuln/{vuln_type} now take auto as a value for base_digest parameter. This will allow the system to determine which ancestor will be used as the Base Image.
This feature is enabled by default in v5.7.0. To disable this feature, set services.policy_engine.enable_user_base_image to false in the values.yaml file.
API access for users configured for native access can now be disabled by setting anchoreConfig.user_authentication.disallow_native_users to true in the values.yaml file.
Adds info level log messages to runtime inventory post handlers.
Improves report Vuln ID Filter description to include CVEs.
Removes the image_cpes database table that is no longer used and can consume a large amount of database space.
Improve validation of object_store and analysis_archive settings during startup.
Response object GET /v2/rbac-manager/my-roles now includes more detail about the account for each role.
Admin users can now create an API Key that can be used to manage Accounts, User Groups and RBAC Roles.
Reduced the size of the Enterprise Image.
Fixes
The Fix Observed At value on vulnerabilities from all ecosystems now display correctly.
Deployments using db as their object store driver will now be able to store large objects over 1GB in size. This means very large SBOMs will now successfully store.
Addresses an issue where account deletion didn’t fully clean up db artifacts stored for the account. Example is some reporting data.
The CycloneDX SBOM now contains the bom-ref field as part of the output.
Allow users with read-only or read-write RBAC Authorization to have the following permissions:
getECSContainers
getECSServices
getECSTasks
getKubernetesClusters
getKubernetesVulnerabilities
listRuntimeInventories
getKubernetesNamespaces
getKubernetesContainers
getKubernetesNodes
getKubernetesPods
Fixes an issue in the policy_creation counter found in the GET /v2/system/statistics endpoint.
Explicit SAML Users are now allowed to use the : character in usernames.
Account names are now prevented from being created with the # character.
Deprecations
Support for OpenStack Swift, which is an open-source object storage system, has been deprecated. Please see Object Storage for a list of supported Object Stores.
Package Feeds and Policy Gates for Ruby Gems and NPMs, are now deprecated. Please contact Anchore Support for more information.
UI Updates
Improvements
The login page has been updated with a new design that uses tabs
to switch between configured authentication methods. When multiple
authentication methods are available, tabs are shown for each available
method. The user’s last-selected method is remembered and shown as the
default tab on subsequent visits.
Anchore Enterprise now supports a Single Sign-On (SSO) only mode.
This mode allows administrators to disable the local authentication
mechanism, which removes the default login form. This is an opt-in
feature enabled by setting the sso_auth_only configuration option
to True.
The Analyze a Tag control has been updated to allow users to
provide a SHA256 digest for the image they wish to analyze. This
feature is useful when you only want to analyze a specific image.
In addition, you can now populate the Registry, Repository,
and Tag fields by pasting a pull string (e.g.,
docker pull docker.io/library/alpine:latest) in the inline control
provided.
The reported base image in the Artifact Analysis view now
reflects changes made within our platform services, whereby the
system can either make the determination automatically or have the
base image specified by an anchore.user/marked_base_image
annotation associated with an image in the ancestry.
Fixes
Previously, the selected default entry in the table page size
dropdown was not being set correctly when opened, and was defaulting to
the first entry. This has now been addressed.
Our application security policies have been updated to prevent
client-side caching, the execution of arbitrary code within our
dependent packages using eval(), and the HTTP Strict Transport
Security (HSTS) header has been added to enforce the use of HTTPS
connections and to remove the ability for users to click through
warnings about invalid certificates.
Within Artifact Analysis, when the route for this view (and the associated
compliance data request) contained the fat manifest digest, the image_digest
returned would still be the platform-specific digest. This caused an
equality check with the route to fail. This has now been fixed.
The Vulnerability ID filter description has been updated to
clarify that it filters the Vulnerability and CVE fields.
The Delete Events modal within the Events tab was successfully
deleting events in batches, but the progress bar was not visually
updating to indicate this. This has now been fixed.
The calculation in the Dashboard view that describes how many
vulnerabilities were affecting how many repositories was inaccurate because the
summarization included duplicate entries. This was a consequence of
different vulnerabilities against the same repository advancing the
repository count. This has now been corrected.
An issue with the policy allowlist data payload was preventing
updates (such as removals) from taking place against allowlists displayed by the
associated dialog in the Artifact Analysis view. Now fixed.
The donut chart displayed in the printable version of the Policy
Compliance tab in the Artifact Analysis view was not positioned correctly.
This has now been fixed.
Boolean values for annotations are now displayed correctly.
The Twitter social media logo has been updated to 𝕏 to reflect the change in
brand and name.
Various supporting libraries have been updated in order to improve
security, performance, and also to remove deprecation warnings from
browser and server output logs. Redundant libraries have been
removed to reduce the app startup time and overall size.
13.1.43 - Anchore Enterprise Release Notes - Version 5.6.0
Anchore Enterprise v5.6.0
Anchore Enterprise release v5.6.0 contains targeted fixes and improvements.
Attention
The v5.5.0 release changed the defaults for the feed provider’s configuration. The new defaults will import results published by Anchore every six (6) hours. This will reduce configuration to multiple sources, provide the NVD with Anchore Enriched data, as well as make GitHub Security Advisories available to customers that have firewall constraints. Please ensure that you have access to https://enterprise.vunnel.feed.anchore.io for uninterrupted feeds service.
If upgrading from a release in the range of v5.0.0 - v5.3.0
The upgrade will result in an automatic schema change that will require database downtime. We are anticipating that this schema change may take more than an hour to complete depending on the amount of data in your reporting system.
If your Anchore Enterprise deployment is on FIPS enabled hosts and your database is being hosted on Amazon RDS, an upgrade to Postgres 16 or greater is required. For more information please see the FIPS section in Requirements.
If upgrading from a release in the range of v5.4.x - v5.5.x
The upgrade will result in an automatic schema change that will require database downtime. We expect that this will take between 2 and 15 minutes depending on the amount of data in your system.
Improvements
/v2/system/statistics API endpoint now includes creation and current counts of runtime inventory and associated metadata.
/v2/system/feeds and /v2/system/feeds/{feed} API endpoints now include the last updated time for the feed groups.
Artifact Lifecycle Policies now include a new policy condition to preserve base images.
Deployment history now includes the initial deployment information.
/v2/images and /v2/summaries/image-tags API endpoints now include an optional flag analyzed_since to help reduce the amount of data returned.
Fixes
Ensures that the layer cache is cleared periodically.
Ensures image imports are not removed until they have been completely processed.
Fixes inconsistent return values when specifying registry data to the POST /v2/registries and /v2/registries/{registry_name} endpoints.
Improves the validation of data posted to the /v2/ecs-inventory endpoint.
Improves the validation around the object store compression setting. Appropriate error messages are now available in the log during startup.
Resolves an issue with Policy evaluation and in Reports where inherited_from_base information for vulnerabilities was calculated against the image with the fewest layers in common instead of the most.
Fixes an issue caused by expired image imports that resulted in logs being flooded with validation errors.
Promptly load new tags and policy evaluations for existing images into the reporting system.
Fixes the Ubuntu 24.04 mapping within Enterprise to be noble based on the security announcement. It was previous mapped to numbat incorrectly.
The Stale Feed Policy Gate trigger now uses the last updated time per feed group.
Fixes a deadlock seen by the report-worker service while updating the runtime inventory data in the reporting system.
Deprecations
Support for OpenStack Swift, which is an open-source object storage system, has been deprecated. Please see Object Storage for a list of supported Object Stores.
In the upcoming v5.7.0 release, the support for package feeds, Ruby Gem and NPM will be deprecated. Please contact Anchore Support for more information.
UI Updates
Improvements
By default, the account context is now included within the URL when
navigating throughout the application. This change allows users to
bookmark or share links that will open the application in the same
account context as the original link, as long as they have sufficient
permissions to access the resource.
The Image Selection view has been further optimized to improve
performance when loading the different data tiers (registry,
repository, and tags) via server-side pagination, filtering, and
sorting. This optimization should reduce the time taken to present
the information in each of these tables.
The Dashboard view has been optimized to improve the Time to
Interactive (TTI) on load. Calculation of Dashboard metrics can take
a significant amount of time, so we now allow the pending metrics
data to continue loading without blocking the UI. Since the Dashboard
view is typically the default on login, this change allows users to
navigate elsewhere if desired.
When creating or editing an image retention policy within the Data
Management view, the option to exclude base images from removal
is now available.
When creating a SAML Provider Configuration, the system role account-viewer
is no longer available to be set as the default role.
Fixes
The View Incomplete Analyses modal within the Images tab had the
ability to toggle between listing pending, analyzing, and failed
images across your account or for the registry, repository, or tag
you were viewing. This was removed in a previous release, but has now
been reinstated.
When certain modals were open and a forced logout was triggered due
to a permission change or session expiration, the modal dimmer would
remain. This has now been fixed.
When creating a SAML Provider Configuration, the system role
account-viewer is no longer available to be set as the default role.
Various supporting libraries have been updated in order to improve
security, performance, and also to remove deprecation warnings from
browser and server output logs. Redundant libraries have been
removed to reduce the app startup time and overall size.
The v5.5.1 release has changed the defaults for the feed provider’s configuration. The new defaults will import results published by Anchore every six (6) hours. This will reduce configuration to multiple sources, provide the NVD with Anchore Enriched data, as well as make GitHub Security Advisories available to customers that have firewall constraints. Please ensure that you have access to https://enterprise.vunnel.feed.anchore.io for uninterrupted feeds service.
If upgrading from a release in the range of v5.0.0 - v5.3.0
The upgrade will result in an automatic schema change that will require database downtime. We are anticipating that this schema change may take more than an hour to complete depending on the amount of data in your reporting system.
If your Anchore Enterprise deployment is on FIPS enabled hosts and your database is being hosted on Amazon RDS, an upgrade to Postgres 16 or greater is required. For more information please see the FIPS section in Requirements.
If upgrading from the v5.4.x release, no additional action is needed.
Improvements
A small change to improve the responsiveness of the Runtime Images by Vulnerability report. This change will reduce the time it takes to generate the report under certain conditions.
Deprecations
Support for OpenStack Swift, which is an open-source object storage system, has been deprecated. Please see Object Storage for a list of supported Object Stores.
13.1.45 - Anchore Enterprise Release Notes - Version 5.5.0
Anchore Enterprise v5.5.0
Anchore Enterprise release v5.5.0 contains targeted fixes and improvements.
Attention
The v5.5.0 release has changed the defaults for the feed provider’s configuration. The new defaults will import results published by Anchore every six (6) hours. This will reduce configuration to multiple sources, provide the NVD with Anchore Enriched data, as well as make GitHub Security Advisories available to customers that have firewall constraints. Please ensure that you have access to https://enterprise.vunnel.feed.anchore.io for uninterrupted feeds service.
If upgrading from a release in the range of v5.0.0 - v5.3.0
The upgrade will result in an automatic schema change that will require database downtime. We are anticipating that this schema change may take more than an hour to complete depending on the amount of data in your reporting system.
If your Anchore Enterprise deployment is on FIPS enabled hosts and your database is being hosted on Amazon RDS, an upgrade to Postgres 16 or greater is required. For more information please see the FIPS section in Requirements.
If upgrading from the v5.4.x release, no additional action is needed.
Improvements
Feeds Service
Defaults to using the anchore produced workspaces for each vulnerability feed provider. These workspaces are updated every six (6) hours. Please see Feeds for more detailed information.
Ubuntu 24.04 Feed Provider is now supported.
Reports
Reduced the number of links to upstream sources of vulnerabilities within the reports by adding a new field in the reports. This should be seamless to users of the UI reporting service.
Authentication
Improved the error message returned when requesting an API Key expiry date exceeds the configured setting.
Removes the restriction that prevents creation of SSO users explicitly in Anchore when sso_require_existing_users is not set. SSO users may now be created manually and associated with an IDP by user admins regardless of the configuration of the IDP integration. This is only available directly via the API.
API
Provides a new endpoint to download the compatible version of AnchoreCTL directly from the product. GET /system/anchorectl
Provide new value of stateless_sbom_analysis from GET /system/statistics
AUDIT Logs
The helm chart now provides the ability to disable the AUDIT logging that was introduced in v5.4.0. The default is set to enable.
Removes false-positive vulnerability matches on the kernel headers packages for RHEL and Debian when the match is on the full kernel and the kernel is not present in the image.
Better handle overlapping vulnerability scans for the same image.
Better detection of vulnerabilities for Calico images.
Improved error messages for misconfigured S3 buckets during service startup.
Fixed the filter of Vendor Only when used by the Vulnerabilities Policy Gate and Package Trigger.
Better handle Runtime Inventory that contains missing IDs.
Reports, Vulnerabilities by ECS Container, Vulnerabilities by Kubernetes Container, and Vulnerabilities by Kubernetes Namespace, no longer produce results that are not part of the current inventory tracked by Catalog Service. This behavior is now the same as other provided reports.
Deprecations
Support for OpenStack Swift, which is an open-source object storage system, has been deprecated. Please see Object Storage for a list of supported Object Stores.
UI Updates
Improvements
The Image Selection view has been optimized to improve
performance when loading the different data tiers (registry,
repository, and tags). This optimization should reduce the time
taken to present the information in each of these tables.
The report templates that contain links to external references
now use the Image Link field by default, replacing the
(deprecated) Links field. This prevents duplication of results
where the only differences between row entries were the links
themselves.
Fixes
Operations against the services utilized by the Inventory view
are now correctly logged in the system logs.
Various supporting libraries have been updated in order to improve
security, performance, and also to remove deprecation warnings from
browser and server output logs. Redundant libraries have been
removed to reduce the app startup time and overall size.
If upgrading from a release in the range of v5.0.0 - v5.3.0
The upgrade will result in an automatic schema change that will require database downtime. We are anticipating that this schema change may take more than an hour to complete depending on the amount of data in your reporting system.
If your Anchore Enterprise deployment is on FIPS enabled hosts and your database is being hosted on Amazon RDS, an upgrade to Postgres 16 or greater is required. For more information please see the FIPS section in Requirements.
If upgrading from the v5.4.0 release, no additional action is needed.
Improvements
Enables delivery of Anchore augmentation to vulnerability records to enable a better vulnerability scanning experience. This enables Anchore to minimize customer impact from the current NVD analysis slowdown and ensure accurate scan results.
In order to provide the best experience, we have 3 configuration options available.
NVD Direct Mode - No changes are needed. You will continue to receive the vulnerability data from NVD as you do today.
NVD Direct Mode with Anchore Enrichment - Allowing Anchore to enrich NVD entries by adding CPE string(s) which allows Anchore Enterprise to correctly match on new vulnerabilities. Requires access to GitHub.
NVD Proxy Mode with Anchore Enrichment - In this mode, Anchore produces the resulting workspace of the Anchore Enrichments and publishes it in https://enterprise.vunnel.feed.anchore.io. This allows users to consume the Anchore NVD Enriched data without needing access to GitHub.
For more configuration details please review NVD Provider.
NVD with Anchore Enriched data is not currently providing any severity information. By definition only NVD can supply NVD CVSS scores.
Note
The future v5.5.0 release will change the default for the feed provider’s configuration. The new default will import results published by Anchore every 6 hours. This will reduce configuration to multiple sources, provide the NVD with Anchore Enriched data, as well as make GitHub Security Advisories available to customers that have firewall constraints.
Fixes
Resolves issue with uploading runtime inventory that contains unicode characters.
Deprecations
Support for OpenStack Swift, which is an open-source object storage system, has been deprecated. Please see Object Storage for a list of supported Object Stores.
UI Updates
Fixes
A fix has been applied to the image summary data processing operation
that calculates the artifact taxonomy for registries, repositories,
and tags. Ports are now correctly handled when included in the registry
value.
If your Anchore Enterprise deployment is on FIPS enabled hosts and the database is being hosted on Amazon RDS, an upgrade to Postgres 16 or greater is required. For more information please see the FIPS section in Requirements.
Improvements
AUDIT event logs have been added to the API Service for the following endpoints
We have simplified the Anchore Enterprise deployment by removing the need to create RBAC Authorizer Service and RBAC Manager Service. RBAC functionality within the product is unchanged.
Reports
Reports which contain vulnerability information have a new column for CVEs.
The CVEs may be different from the Vulnerability ID which was used to match on if it was an Advisory ID.
The CVEs column may contain N/A if a CVE has not been published or detected for the Advisory’s ID yet.
Current saved reports remain unchanged. To see this new column, you will need to generate a new saved report.
The Vulnerability ID Filter has been updated to work on both the Vulnerability ID and the CVEs.
API
/system/deployment-history is a new endpoint that returns a history of your future upgrades.
/system/statistics endpoint now includes the number of total number of policy creations, the current number of policies in the deployment, and the total number of policy evaluations.
Fixes
Policy delete now properly removes document store artifacts from this policy.
Improves the account creation errors returned to the user when the failure is regarding policy creation.
Deletion of an image will no longer cause other images to return 500 errors. This could occur when the two image shared the same image ID.
Fixes the Policy Gate: Tag Drift Trigger failure that was seen when multiple versions of the tag existed and the comparison was against the newest one.
Improves the archive rule deletion errors returned to the user when they did not have permissions for the operation.
Return the image content even when the parent digest is being used for the request. This was seen in a error in anchorectl image content.
Improves errors from POST /rbac-manager/roles/{role_name}/members
when the user is an admin user
when the username is not valid or is a reserved system name
Improves errors from POST /system/user-groups/{group_uuid}/users
when the user is an admin user
when the username is not valid or is a reserved system name
Improves errors from POST /system/user-groups
when the user group name is a reserved system name
when the user group name overlaps with a username
Fixes the response of PATCH /system/user-groups/{group_uuid} to return the entire user group value.
Fixes a 500 error in the Action Workbench when selecting a notification endpoint.
Deprecations
Support for OpenStack Swift, which is an open-source object storage system, has been deprecated. Please see Object Storage for a list of supported Object Stores.
UI Updates
Improvements
The User Groups view provides a summary of all user groups and
the accounts associated with each group. From this view,
administrators can create, edit, and delete user groups, and define the accounts and associated permissions accessible to
users within each group. Native users, LDAP users, and SSO users can
all be assigned to user groups from their respective Add or
Edit dialogs.
A performance improvement has been applied to the image summary data
processing operation that calculates the artifact taxonomy for
registries, repositories, and tags. This improvement should reduce
the time taken to present the Image selection view.
Fixes
A default of N/A has now been provided for empty entries in the
CVEs column of the Vulnerabilities tab. This change ensures
that the CVEs column is always populated with data, even if the
vulnerability has no associated CVEs.
During template creation, we identified an issue where the state of
unchanged boolean filters marked as False was incorrectly
recorded as null after being saved. This error caused the filter
to be omitted from any report queries generated from that template.
While the issue was resolved in the 5.3.2 release for new
templates, pre-existing templates remained unchanged. An AppDB
migration has been added to automatically correct this issue for
existing templates.
The Last Seen popup contained broken links to the Inventory
page for ECS containers. Images of this type are not currently
supported in the Inventory view, and the links have now been
removed.
Reports downloaded from the Reports view that contained multiple
CVE entries would not display correctly in the CSV format on account
of the data itself being comma-separated. This issue has now been
addressed.
Various supporting libraries have been updated in order to improve
security, performance, and also to remove deprecation warnings from
browser and server output logs. Redundant libraries have been
removed to reduce the app startup time and overall size.
13.1.48 - Anchore Enterprise Release Notes - Version 5.3.0
Anchore Enterprise v5.3.0
Anchore Enterprise release v5.3.0 contains targeted fixes and improvements.
Enterprise Service Updates
Announcements
Note
In the future v5.4.0 release, any Anchore Enterprise that is deployed on FIPS enabled hosts with its database being hosted on Amazon RDS, will be required to be running with a Postgres Version of 16 or greater. For more information please contact Customer Support.
Requirements
If upgrading from a v5.x release, a database update is required.
Providing the ability for an administrator to define one or more RBAC Roles for one or more accounts within an User Group. The administrator has the ability to add and remove users from the User Groups. These users will automatically have the privileges as defined by the User Group in addition to any explicitly assigned RBAC Roles.
Policy
Policy packages gate has a new metadata trigger and provides the following parameter values:
Package type to exact match against
Package name to match against (supports wildcards)
Package version to match against (supports wildcards)
Allowlists can contain either CVEs or corresponding Advisory IDs and work the same regardless of which was used to match the Trigger ID.
Reports
Report executions that fail to complete after 3 attempts will be cancelled. The report will continue to be executed on any defined schedule.
Improved the description of the Current Only filter in reports that contain tag information.
The /system/statistics endpoint now includes the number of successful policy evaluations and the number of reports generated.
Improved the performance of the background task that deletes older runtime inventory based on the configuration value inventory_ttl_days.
Improved the performance of Policy Evaluations.
Improved the behavior of the GitHub Vulnerability Provider when a token is not provided. The system will automatically disable this provider and log a warning message to alert the user.
Fixes
Addressed an issue where the policy’s dockerfile gate with effective_user trigger could not determine the effective user.
Enterprise provides better handling of NuGet packages.
Syft v0.105.0 improved its ability to search common patterns within a go binary. This should resolve an issue determining the version where the main module is (devel).
Addressed a failure seen by all the feed providers when the GitHub Token was set to NULL instead of an empty string.
Fixed the Policy distro gate when the version field was a non-numeric value (ie latest).
Policy Engine has improved its validation of the grype-db during startup.
JAR filenames, which had an underscore in their names, are now parsed correct in SBOMs.
Deprecations
Support for OpenStack Swift, which is an open-source object storage system, has been deprecated. Please see Object Storage for a list of supported Object Stores.
UI Updates
Improvements
The results table within the Vulnerabilities tab now contains a
CVEs column that lists all CVEs associated with each
vulnerability.
NVD CVSS Base Score is now included in the CSV and JSON reports that
are generated from the Vulnerabilities tab in the Artifact
Analysis view. In addition, a CVEs column has also been added in
order to fully represent every CVE associated with each
The results view for a report now contains the following additional
details:
Results generation started at
Results generation completed at'
Fixes (v5.3.1)
Due to a regression accidentally introduced in version 5.2.0, the migration of reports predating 5.0.0 would fail upon upgrading to 5.2.0. This failure resulted in a service error when attempting to view the report from the Saved Reports view. This issue has now been resolved.
In rare cases, the Accounts view would return a 404 if it tried to fetch users from an account that had been deleted by another admin. This issue has now been addressed.
Due to a regression in 5.3.0, the calendar widget available in Events and Policies was not centered correctly. This issue has now been resolved.
Fixes (v5.3.0)
A fix has been provided for an issue where reports that have no
results either serve corrupted (JSON) or empty (CSV) files on
download. This issue has now been addressed.
In previous releases, the timestamps displayed in the Report
Results view were not correctly calculated if the page was
visited directly via URL, or if the page was refreshed. Now fixed.
Deleted image retention policies are no longer displayed in the
System > Data Management view (admin only).
Various supporting libraries have been updated in order to improve
security, performance, and also to remove deprecation warnings from
browser and server output logs. Redundant libraries have been
removed to reduce the app startup time and overall size.
Enterprise v5.2.0 requires Postgres 13 or greater.
Enterprise v5.2.0 requires that the previous version was Enterprise v4.0.0 or greater. Strongly recommend that you upgrade to Enterprise v4.9.5 prior to attempting this upgrade.
Enterprise v5.2.0 requires the use of the Enterprise Helm Chart. Please see below the table containing compatible version.
Enterprise v5.2.0 requires that you upgrade your integrations and client. Please see below the table containing compatible versions.
Improvements
RBAC Roles
Adds new system role called account-viewer. This role allows the user to list all the accounts within Anchore Enterprise. Authorization to bestow this role is restricted to system administrators.
Reports
Provides a configuration variable, services.reports.use_volume, which directs the Report Service to use disk space instead of memory while generating reports.
The “Inherited From Base” field is now available the vulnerability-related reports including:
Artifacts by Vulnerability
Images Affected by Vulnerability
Runtime Inventory Images by Vulnerability
Tags by Vulnerability
Vulnerabilities by ECS Container
Vulnerabilities by Kubernetes Container
Vulnerabilities by Kubernetes Namespace
Improves the performance of the Kubernetes Namespace Vulnerability Loader within the Report Worker Service.
API
Adds a /system/statistics endpoint to return various system statistics and counters over time.
The /images/{image_digest}/vuln/{vuln_type} endpoint provides a query flag, include_vuln_description, that indicates when to include the vulnerability description field in the response.
Provides a new field, password_last_updated, in the response of /accounts/{account_name}/users.
API Keys
Provides a configuration variable, user_authentication.remove_deleted_user_api_keys_older_than_days, which determines the number of days API Keys will remain in the database.
Fixes
Corrects the time that a Scheduled Query started to be generated in the unlikely occurrence that system restarted the report.
Addresses an issue with the RedHat vulnerability data provider not automatically updating OVAL files which prevents getting accurate fix version information for appstream packages in RHEL 9.
Addresses an issue with grype-db matching logic for RHEL 9, where they are no longer reporting a modularity, resulting in false positives. Specifically, RHEL 9’s default stream no longer reports a modularity.
API endpoint /images/{image_digest}/content/java returns a version format consistent with the output from AnchoreCTL.
Fixes an issue where the services.reports_worker.data_egress_window was not working correctly for the runtime reports.
Fixes a failure in the Source SBOM import that refer to poetry.lock or python requirements files.
An interrupted report generation will correctly error out correctly instead of trying to persist a partially generated report.
Fixes an issue where CVE-2023-44487 would show the incorrect severity.
Licenses for all package content types are now returned when available.
Cpes property returns a list of strings or an empty list for all package content types.
Reintroduced the Policy Evaluation Cache which aids in better evaluation performance.
Logging
Reduces the number of log warning messages for orphaning services.
Suppress an SQLite exception that was not impacting the system.
Removes an incorrect error message in the Reports Service that looked like the following “Could not trigger reports_image_refresh after multiple retries. Will retry on next cycle”.
Deprecations
Support for OpenStack Swift, which is an open-source object storage system, has been deprecated. Please see Object Storage for a list of supported Object Stores.
UI Updates
Improvements
Administrators can now assign the system-wide account-viewer role
to users. This role allows users to list all accounts in the system
and is intended for programmatic access to the Anchore API.
Administrators can now view the last time a user password was
changed from the summary table in the Accounts view.
The error indicator for a failed report has been updated to provide
more information about the failure.
From within the new Data Management view, administrators can
now set policies to determine the removal schedule for images
in the system across all accounts. The policies allow you to
specify the number of days to retain images, based on either
presence in the runtime inventory or their presence globally.
Logs are now written to a file (by default in the
/var/log/anchore directory) in addition to the console. The
logs are rolled once a maximum capacity of 10Mb is reached, and
the last 10 log files are retained. In addition, outbound
requests made by the application to our Anchore Enterprise API now
display the request identifier used within our services, which can
be used to correlate the UI request with the platform service
logs.
A Licenses column has been added to the Java sub-tab.
The "Inherited From Base" field has been added as a default to a variety
of vulnerability-related reports including:
Artifacts by Vulnerability
Images Affected by Vulnerability
Runtime Inventory Images by Vulnerability
Tags by Vulnerability
Vulnerabilities by ECS Container
Vulnerabilities by Kubernetes Container
Vulnerabilities by Kubernetes Namespace
Fixes
Administrators who switch into a different (non-administrative)
account context are no longer able to create global reports in
that account.
Previously, when a saved report was reconfigured (for example, by
changing the name or description), the filter details would be
dropped from the AppDB record, preventing the report from being
viewed (although it would still be available for download). This
issue has now been fixed.
Administrators who are authenticated via LDAP are now able to
create and manage API keys for non-LDAP administrative and standard
users (although not for themselves, because we currently don’t
support API Key self-service for LDAP authenticated users).
Various supporting libraries have been updated in order to improve
security, performance, and also to remove deprecation warnings from
browser and server output logs. Redundant libraries have been
removed to reduce the app startup time and overall size.
Enterprise v5.1.1 requires Postgres 13 or greater.
Enterprise v5.1.1 requires that the previous version was Enterprise v4.0.0 or greater. Strongly recommend that you upgrade to Enterprise v4.9.3 prior to attempting this upgrade.
Enterprise v5.1.1 requires the use of the Enterprise Helm Chart. Please see below the table containing compatible version.
Enterprise v5.1.1 requires that you upgrade your integrations and client. Please see below the table containing compatible versions.
Improvements
Reports
Performance improvement in report generation.
Reduction of database swap space needed during report loading.
Enterprise v5.1.0 requires Postgres 13 or greater.
Enterprise v5.1.0 requires that the previous version was Enterprise v4.0.0 or greater. Strongly recommend that you upgrade to Enterprise v4.9.3 prior to attempting this upgrade.
Enterprise v5.1.0 requires the use of the Enterprise Helm Chart. Please see below the table containing compatible version.
Enterprise v5.1.0 requires that you upgrade your integrations and client. Please see below the table containing compatible versions.
Support for API Keys. API Keys are manually generated credentials used during authenticate with Anchore Enterprise. For more information, please see API Keys
Note: This feature is not currently available for users who have authenticated using LDAP
Vulnerabilities
Provide additional vulnerability matching for goCompiledVersion.
Provide vulnerability matching for pre-released versions of Debian.
Support capture of vulnerability data for Ubuntu 23.04 (Lunar Lobster) and Ubuntu 23.10 (Mantic Minotaur) once publishing commences from Canonical.
Analysis
All namespaced python packages are persisted during analysis which improves displaying the installed location for python packages.
Reports
Report generation can be scaled out to multiple report pods.
Runtime reports now work with the enable_data_egress and data_egress_window configuration options. Please review Reports for more information.
Improved report service logging to provide better error messages.
Runtime report filters for Labels now supports multiple labels.
RBAC Roles
image-lifecycle - permissions around management of archival rules.
registry-editor - permissions to manage private registry credentials.
General System Improvements
Improve memory profile and behavior in the API service.
Improve logging within the feed service.
Provide clear logging of the service version and db schema during startup.
Fixes
Better error handling for policies that are missing data from the document store.
Ability to execute a software downgrade from a patch release to a release within the Major.Minor version numbers.
Prevent a deadlock when two agents are reporting inventory from the same Cluster/Namespace.
If report generation exceeds the configured timeout execution record will be marked as timed out and processing will be halted to allow other scheduled reports to start.
Vulnerability matching now properly accounts for maven versions according to the maven spec rather than the plain semver spec.
Fixed an issue that prevented new Windows OS containers from being analyzed properly.
Image digests will now match when an image is analyzed within Enterprise (centralised analysis) and the image SBOM is imported via AnchoreCTL (distributed analysis).
If an error occurs during database upgrade, the error will be elevated to the pod to prevent it from starting.
Image import that contains a secret or content search results, will now have the correct line number and name translations.
Fix a grypedb digest mismatch that can occur when Policy Engine syncs with the Feed Service.
UI Updates
Improvements
API Token Support
Users can now create and manage API keys for use with the Anchore API. Administrators can control the keys for all users from the System > Accounts view, and all users can create or revoke their own keys from the dropdown menu in the top navigation bar.
Note: This feature is not currently available for users who have authenticated using LDAP
Application Vulnerabilities
Vulnerabilities data for an application group can now be downloaded in JSON format from the Applications view
The Artifact Analysis view now indicates, if available, the fat manifest ID associated with the currently selected artifact in the breadcrumb trail
The Artifact Analysis > SBOM view now includes a Version column to the Java sub-tab
Reports
The Vulnerabilities by ECS Container report now provides the Will Not Fix and Last Seen fields
The Vulnerabilities by Kubernetes Container report now provides the Last Seen field
The Fix Observed At field has been added as a default to a variety of vulnerability-related reports
Help text improvements have been made to the filters associated with runtime-related reports
Accounts
The email address associated with an account can now be updated by an administrator
The roles provided in the user-creation dialog within an account are now alphabetically sorted
UI Theme
A dark theme has been added to the application. This can be enabled by clicking the Dark Mode toggle in the top right of the UI. By default, the theme will follow the system theme, but it can be overridden by the user.
Fixes
Reports
Any previous errors are now cleared when the configuration dialog is opened. In addition, the title of the dialog no longer changes as a new name is entered.
The Report Results page displayed the execution schedule as UTC, which was inconsistent with the information shown in the Saved Reports view, where it is converted to the local timezone. Now fixed.
Licenses are now displayed correctly in the Artifact Analysis > SBOM view; previously they would be displayed as Unknown
Image Selection
A significant performance improvement has been applied to the repository summary operation that presents the interstitial dialog when adding a repository
Clicking an enabled alert subscription toggle for tags that inherit their subscription state from their parent repository would not disable the subscription for the tag; instead, a new subscription would be added for that specific tag, with another tag required to actively disable the entry. This has now been fixed
Various supporting libraries have been updated to improve security and performance, and to remove deprecation warnings from both browser and server output logs. Redundant libraries have been removed to reduce the application’s startup time and overall size.
Enterprise v5.0.0 requires Postgres 13 or greater.
Enterprise v5.0.0 requires that the previous version was Enterprise v4.0.0 or greater. Strongly recommend that you upgrade to Enterprise v4.9.0 prior to attempting this upgrade.
Enterprise v5.0.0 requires the use of the Enterprise Helm Chart v2.0.0.
Enterprise v5.0.0 requires that you upgrade your integration and client. Please see below the table containing compatible versions.
Improvements
V2 API
The Anchore Enterprise API has been updated. For complete details, please review Migrating from API V1 to V2.
The Anchore Enterprise API is found in the API Service. The RBAC Manager API, Notifications API, and Reports API are now served through that same endpoint. Those services are now internal-only services for processing requests in the 5.0 release.
fix_observed_at is now returned as part of the GET /v2/images/{image_digest}/vuln/{vuln_type} endpoint response where a fix is available.
Reports
Scheduled Query Executions now contain a status field. Values include: pending, error, running, and complete.
The pagination of the scheduledQueries query has been improved. An additional query scheduledQueryExecutions has been added to allow pagination of the executions of a specific scheduled query.
Provided a Fix Observed Date for all report queries that contain vulnerabilities information. This Fix Observed Date is the date which Anchore observed that a fix was available.
Improved the Filter Descriptions within the runtime reports.
False Positive Reduction
Provide configuration settings so users can select which package types use CPE-base matching against NVD. For additional details, please review False Positive Management
Policy
Improvements in presentation and validation during policy editing have been made. Please see Policy for an overview on using policies.
New distro policy gate has been added with a deny trigger. Required parameters include the Name of the Distribution, Version of Distribution, and the Operation to perform the evaluation (ie. <, >, !=).
RBAC Roles
Provided a new user role called image-developer. Used alone, the role limits the user to viewing images, vulnerabilities, polices and policy evaluations.
Events
The ANCHORE_EVENT_RETENTION_AGE_DAYS has now been set to 180 days by default.
Runtime Inventory
Now supports a new configuration option inventory_ingest_overwrite which, when set to true, stores only the most recent
inventory per cluster/namespace. Note: the inventory_ttl_days continues to be available for use.
Fixes
Image Dockerfile Status now reports correctly even after a force re-analysis.
Images analyzed from runtime inventory now have the correct Dockerfile Status reported.
Policy
Improved Policy validation; The policy editor no longer allows saving policies with unknown elements.
Policy Name is now a required field during the creating of new policies.
Tag Drift Gate no longer fails with images analyzed with 4.9.x.
The createScheduledQuery mutation now returns correct returns the createdAt, updatedAt, and account fields.
A verbose warning log message in the Policy Engine Service, regarding sqlalchemy, has been attended to.
Addressed an exception in the Report Service when loading an image with an empty dockerfile_mode.
The report vulnerabilitiesByKubernetesContainer executes correctly even when node information is not present.
The V2 API now specifies the version field in the ContentJAVAPackageResponse. This is the response for GET v2/images/{image_digest}/content/java.
Fixed a scale issue where an image, which has been queued for analysis, can be garbage collected prior to being processed.
Deprecations
The anchore-cli has been deprecated and removed from the docker.io/anchore/enterprise image
AnchoreCTL is available within docker.io/anchore/enterprise image today
AnchoreCTL is the only supported command line tool for interacting with Anchore Enterprise.
KAI (Kubernetes Automated Inventory) no longer be compatible with Enterprise v5.0.0. A new version of this
agent, called anchore-k8s-inventory, is available now and compatible with Enterprise v4.7.0. You may start to migrate to this new agent today.
Support for REM (Remote Execution Manager) has been deprecated. It is no longer be supported in Enterprise v5.0.0.
Analyzer Service no longer supports multiple analysis threads. The concurrentTasksPerWorker value is no longer valid within the Enterprise Helm Chart. Analysis throughput should be increased by adding more analyzer pods instead.
UI Updates
Improvements
The Anchore Enterprise Client now uses the Anchore Enterprise V2 API. This transition should be transparent to users. However, if you encounter any issues, please contact support.
The Reports feature has been rebuilt to provide a more intuitive and streamlined experience for creating, scheduling, and managing reports. The new report manager is now the default view when you click the Reports icon in the main navigation bar. If any reports are already present, the Saved Reports tab will be displayed. If no reports are yet available, you will initially see the New Report tab. Once you have created at least one report, the Saved Reports tab will become available as the default.
This component offers the following enhancements:
Report composition is simplified, combining the capabilities of the previous Quick Reports and Report Manager features.
Scheduling has also been simplified. Reports can either be generated on demand or scheduled to run at a specific time.
Templates can now be created at any time, either from an ad-hoc report or from a scheduled report, and are stored in their own dedicated tab. Custom (user) templates and system templates are separated into their own views.
Report data, whether scheduled or ad-hoc, can be downloaded in CSV or JSON format at any time.
Report schedules can be easily reconfigured or removed after their creation.
Individual report items can be removed.
In addition to the above, performance improvements have been made to the report generation process.
Note: In previous versions of the UI, users could create reports using entities known as queries, which were stored filter sets. These sets could be associated with one or more schedules, each containing multiple result items. In the new reports UI, the concept of queries within the Reports Manager has been replaced by storing individual reports under Saved Reports. Therefore, migrating to version 5.0.0 will have the following effects:
Queries that contain schedules will be converted into multiple reports—one for each schedule—with their associated result entries displayed when the report item is expanded.
Queries that do not contain schedules will be turned into custom templates.
The Fix Observed Date is now displayed within the Vulnerabilities tab of the Images view. This date, which is the date Anchore observed a fix being available for a given vulnerability, is also included in the reports where applicable.
Clicking the View Reports button in either the Images or Vulnerabilities views will take you directly to the Saved Reports tab in the Reports view. Here, you can view all reports containing data for the selected image or vulnerability.
Minor improvements have been made to the display of summary data in the rule composition dialog of the Policy Editor.
Service logging has been enhanced to provide information about connections made from the web service to the Anchore Enterprise API services. This information is displayed at the DEBUG level.
There’s a more comprehensive presentation of error details when errors are logged and displayed in the UI.
A new image-developer RBAC role has been added, which is applied to the rule-sets for the UI features. This role is intended for users who need to view images, vulnerabilities, policies, and policy evaluations, but do not need to create or edit them.
Fixes
AppDB database migrations will not execute unless the app is connected to a running instance of Anchore Enterprise services.
The application tour dialog no longer redirects users to the Dashboard view when displayed.
Logging in will now present the user with a landing page appropriate for their RBAC role.
Textual references to Anchore Engine have been replaced with Anchore Enterprise.
An error will now be displayed if a user attempts to submit a repository that has already been analyzed.
The issue where the UI sometimes did not update to reflect a logout event (even though the event was executed on the server) has been addressed.
Notification endpoints that have been disabled by an administrator can no longer be selected in the Action Workbench feature of the Artifact Analysis view.
Security enhancements have been made to the test connection operation within the Notifications view.
Package size is now accurately displayed in the Package Detail popup within the Vulnerabilities view of Artifact Analysis.
Multi-select and clear-all operations now function correctly in both the Events view and the Images view of Artifact Analysis when viewing repositories.
Dashboard metrics now use inclusive terminology.
Broken links to documentation in the Malware subtab of the Content view of Artifact Analysis have been addressed.
Various supporting libraries have been updated to improve security and performance, and to remove deprecation warnings from both browser and server output logs. Redundant libraries have been removed to reduce the application’s startup time and overall size.
Fixes an issue with the V1 Schema that prevented a JIRA Notification Endpoint from being configured via the UI.
Addresses an issue with the RedHat vulnerability data provider not automatically updating OVAL files which prevents getting accurate fix version information for appstream packages in RHEL 9.
Addresses an issue with grype-db matching logic for RHEL 9, where they are no longer reporting a modularity, resulting in false positives. Specifically, RHEL 9’s default stream no longer reports a modularity.
UI Updates
Fixes
The control used to test notifications in the Notifications view would
return a 400 error when used. Now fixed.
In previous versions, the Report Manager would not display report output
on account of an internal page-redirection condition that was an artifact of
pre-release 5.0 testing. This issue has now been addressed.
Previously, the form that allowed you to edit a JIRA notification was not
displaying the required fields. This issue has now been addressed (as
described by the fix in the Enterprise Service Updates section above).
Recommended Component Versions
Component
Recommended Version
Enterprise
v4.9.5
Enterprise UI
v4.9.1
Enterprise Helm Chart
v1.0.4
Engine Helm Chart (Deprecated)
v1.28.7
AnchoreCTL (V1 API Compatible)
v1.8.0
AnchoreCTL (V2 API Compatible)
v4.9.0
anchore-k8s-inventory
v1.1.1
anchore-ecs-inventory
v1.2.0
KAI (Deprecated)
v0.5.0
Kubernetes Admission Controller
v0.4.0
REM - Remote Execution Manager (Deprecated)
v0.1.10
Harbor Scanner Adapter
v1.1.0
Jenkins Plugin
v1.1.0
13.1.53.2 - Anchore Enterprise Release Notes - Version 4.9.4
Anchore Enterprise v4.9.4
Anchore Enterprise release v4.9.4 contains targeted fixes. No database upgrade is needed.
Note
Please view the details around the upcoming Enterprise v5.0.0 release. Important requirements must be met before upgrade. See link below.
Fix an issue that prevented new Windows OS containers from being analyzed properly.
The report vulnerabilitiesByKubernetesContainer executes correctly even when node information is not present.
Prevent a deadlock when two agents are reporting inventory from the same Cluster/Namespace.
Fix a grypedb digest mismatch that can occur when Policy Engine syncs with the Feed Service. The issue is seen as a ChecksumMismatchError in the policy-engine’s logs and results in a failure to sync the feeds.
Fix an exception in the Report Service when loading an image with an empty dockerfile_mode.
Ability to execute a software downgrade from a patch release to a release within the same Major.Minor version numbers. Also provides better log messages during upgrade.
Image digests will now match when an image is analyzed within Enterprise (centralised analysis) and the image SBOM is imported via AnchoreCTL (distributed analysis).
Recommended Component Versions
Component
Recommended Version
Enterprise
v4.9.4
Enterprise UI
v4.9.0
Enterprise Helm Chart
v1.0.2
Engine Helm Chart (Deprecated)
v1.28.4
AnchoreCTL (V1 API Compatible)
v1.8.0
AnchoreCTL (V2 API Compatible)
v4.9.0
anchore-k8s-inventory
v1.1.1
anchore-ecs-inventory
v1.2.0
KAI (Deprecated)
v0.5.0
Kubernetes Admission Controller
v0.4.0
REM - Remote Execution Manager (Deprecated)
v0.1.10
Harbor Scanner Adapter
v1.1.0
Jenkins Plugin
v1.1.0
13.1.53.3 - Anchore Enterprise Release Notes - Version 4.9.3
Anchore Enterprise v4.9.3
Anchore Enterprise release v4.9.3 contains targeted fixes. No database upgrade is needed.
Note
Please view the details around the upcoming Enterprise v5.0.0 release. Important requirements must be met before upgrade. See link below.
Resolved a memory consumption issue in the Policy Engine Service that could occur when handling images with multiple vulnerabilities without fixes. This fix addresses the issue identified during vulnerability scanning, ensuring more efficient resource usage.
Recommended Component Versions
Component
Recommended Version
Enterprise
v4.9.3
Enterprise UI
v4.9.0
Engine Helm Chart
v1.28.3
AnchoreCTL (V1 API Compatible)
v1.8.0
AnchoreCTL (V2 API Compatible)
v4.9.0
anchore-k8s-inventory
v1.1.1
anchore-ecs-inventory
v1.2.0
KAI (Deprecated)
v0.5.0
Kubernetes Admission Controller
v0.4.0
REM - Remote Execution Manager (Deprecated)
v0.1.10
Harbor Scanner Adapter
v1.2.0
Jenkins Plugin
v1.1.0
13.1.53.4 - Anchore Enterprise Release Notes - Version 4.9.2
Anchore Enterprise v4.9.2
Anchore Enterprise release v4.9.2 contains targeted fixes. No database upgrade is needed.
Note
Please view the details around the upcoming Enterprise v5.0.0 release. Important requirements must be met before upgrade. See link below.
Improved the efficiency of Vulnerability Scans. Slower scan time has been linked to the policy-engine service hitting Out of Memory conditions under increased load.
Fixed the Tag Drift Policy Gate which was failing on images analyzed by Enterprise v4.9.0 or later.
Restored the Runtime Inventory Image TTL setting which keeps only the most recent set of inventory per namespace.
Improved the memory profile and reduced memory usage for all the services of Anchore Enterprise.
V2 API Fixes
POST /v2/images - prevent deprecated fields from being accepted in the V2 API
GET /v2/images/{image_digest}/check - returns both the overall final_action, which includes the result of the allow/deny lists, as well as the policy_action of the policy rule evaluation.
GET /v2/subscriptions - when the subscription_type is repo_update, now returns the subscription_value data in the V2 API format.
POST /v2/subscriptions - when the subscription_type is repo_update, prevents non-valid json to be added via the subscription_value data.
GET /v2/subscriptions/{subscription_id} - when the subscription_type is repo_update, now returns the subscription_value data in the V2 API format.
PUT /v2/subscriptions/{subscription_id} - when the subscription_type is repo_update, prevents non-valid json to be added via the subscription_value data.
Evaluation Details field of Policy Evaluations will contain a policy_action field. This field represents the policy result before applying image allow/deny lists
Recommended Component Versions
Component
Recommended Version
Enterprise
v4.9.2
Enterprise UI
v4.9.0
Engine Helm Chart
v1.28.1
AnchoreCTL (V1 API Compatible)
v1.8.0
AnchoreCTL (V2 API Compatible)
v4.9.0
anchore-k8s-inventory
v1.1.1
anchore-ecs-inventory
v1.2.0
KAI (Deprecated)
v0.5.0
Kubernetes Admission Controller
v0.4.0
REM - Remote Execution Manager (Deprecated)
v0.1.10
Harbor Scanner Adapter
v1.2.0
Jenkins Plugin
v1.1.0
13.1.53.5 - Anchore Enterprise Release Notes - Version 4.9.1
Anchore Enterprise v4.9.1
Anchore Enterprise release v4.9.1 contains targeted fixes. No database upgrade is needed.
Note
Please view the details around the upcoming Enterprise v5.0.0 release. Important requirements must be met before upgrade. See link below.
Fixes loading all bundles in the <service_dir>/bundles directory of the API service when new accounts are created`.
Vulnerability records will be created for out-of-support entries from the RHEL Provider when none of the in-support versions are affected.
Addressed a failure with grypedb syncing with Policy Engine.
Enterprise now properly handles the error case where a vulnerability provider fails to run. An example of a provider failing to run - GitHub Provider will fail if the Github API Key was not properly provided in the config.
Recommended Component Versions
Component
Recommended Version
Enterprise
v4.9.1
Enterprise UI
v4.9.0
Engine Helm Chart
v1.27.2
AnchoreCTL (V1 API Compatible)
v1.8.0
AnchoreCTL (V2 API Compatible)
v4.9.0
anchore-k8s-inventory
v1.1.1
anchore-ecs-inventory
v1.1.0
KAI (Deprecated)
v0.5.0
Kubernetes Admission Controller
v0.4.0
REM - Remote Execution Manager (Deprecated)
v0.1.10
Harbor Scanner Adapter
v1.2.0
Jenkins Plugin
v1.0.25
13.1.53.6 - Anchore Enterprise Release Notes - Version 4.9.0
Anchore Enterprise v4.9.0
Anchore Enterprise release v4.9.0 contains targeted fixes and improvements.
A Database update is needed.
Note
Please view the details around the upcoming Enterprise v5.0.0 release. Important requirements must be met before upgrade. See link below.
Anchore Enterprise V2 API is now available for use.
The V2 API has been provided for early adoption for any customer who has custom integrations or scripts that may directly access the V1 API. This will provide extra time to migrate to the new V2 API endpoints prior to the official Enterprise v5.0.0 release.
The V1 APIs were distributed across several files and have now been consolidated into the single V2 API.
Anchore API Swagger
The following V1 APIs have been deprecated:
Enterprise API Swagger
Engine API Swagger
Notifications Swagger
RBAC Manager Swagger
Reports Swagger
For more details about the Anchore Enterprise V2 API, and to view the V2 swagger, please visit API Usage
Kubernetes and ECS Runtime Inventory ingest path received performance enhancements.
Reports
Scheduled Queries now provide a executionsLimit filter
Improvement in both performance and memory consumption were completed on the following reports:
Vulnerabilities by Kubernetes Namespaces
Vulnerabilities by Kubernetes Containers
Vulnerabilities by ECS Containers
Added several new Metrics within the report service. These are now available via Prometheus.
Configuration
Image import maximum size is now configurable. Current default size is 100 MB.
Docker Compose users can set the environment variable ANCHORE_MAX_IMPORT_CONTENT_SIZE_MB
Helm users can modify max_import_content_size_mb
Source repository import maximum size is now configurable. Current default size is 100 MB.
Docker Compose users can set the environment variable ANCHORE_MAX_IMPORT_SOURCE_SIZE_MB
Helm users can modify max_source_import_size_mb
Provided a configuration option to bypass object store content checks. This was provided to aid our customer support team during specific triage. Please contact customer support for additional information.
Policy Engine can now capture and persist additional metadata for vulnerabilities reported by the vulnerability provider sync. The following observed dates are persisted:
The date on which a vulnerability within a provider namespace is first observed by Enterprise via the vulnerability provider sync.
The date on which a specific package fix is first observed by Enterprise via the vulnerability provider sync. This “fix observed date” will be used during policy eval of max days since fix to give a more consistent evaluation result across all newly analyzed image and source SBOMs.
Support capture of vulnerability data for Ubuntu 23.04 (Lunar Lobster) and Ubuntu 23.10 (Mantic Minotaur) once publishing commences from Canonical.
Provide support for vulnerability data for Mariner.
If a Vunnel Provider fails, the system will provide a new sync using the previous data for the failing provider and the new data from the other providers. This change also provides improved messaging around failing providers.
Improved Java matches for Source SBOMS by capturing more metadata during SBOM imports.
Fixes
Reports
Handle an error when the service is loading data for ECS Container Report Table and Kubernetes Container Report Table in cases where a container stops being reported long enough for it to be removed from the Catalog, and is then reported again.
The report service no longer triggers an out of memory error when running larger runtime workloads.
The Archive Image Delete force flag options now works even when the image is in the archiving state.
ECS Inventory which contains both tasks as part of a service and tasks that are run standalone will be properly accepted.
Fixed an issue seen with the Ubuntu provider failing to sync when the git repo has untracked files present.
Addressed an issue where distroless images reported incorrect findings from other catalogers.
Correctly handled the Ubuntu CVE Tracker change for labeling which indicated end of life. This could lead to unfixed CVEs to be missing from the data.
Modifying the value of the Catalog’s resource_metrics cycle timer is now honored.
API call POST /v1/enterprise/stateless/sbom/vuln/{vtype} now works as expected.
Proper handling for vulnerability transitions from affected to not-affected within the RHEL provider.
UI Updates
Fixes
Various supporting libraries have been updated in order to improve security, performance, and also to remove deprecation warnings from browser and server output logs. Redundant libraries have been removed to reduce the app startup time and overall size.
Recommended Component Versions
Component
Recommended Version
Enterprise
v4.9.0
Enterprise UI
v4.9.0
Engine Helm Chart
v1.27.0
AnchoreCTL (V1 API Compatible)
v1.8.0
AnchoreCTL (V2 API Compatible)
v4.9.0
anchore-k8s-inventory
v1.1.1
anchore-ecs-inventory
v1.1.0
KAI (Deprecated)
v0.5.0
Kubernetes Admission Controller
v0.4.0
REM - Remote Execution Manager (Deprecated)
v0.1.10
Harbor Scanner Adapter
v1.2.0
Jenkins Plugin
v1.0.25
13.1.53.7 - Anchore Enterprise Release Notes - Version 4.8.1
Anchore Enterprise v4.8.1
Anchore Enterprise release v4.8.1 contains a new configuration option. No database upgrade is needed.
Note
Please view the details around the upcoming Enterprise v5.0.0 release. Important requirements must be met before upgrade. See link below.
Vulnerabilities by Kubernetes Containers is a new report template which will allow you to view and filter on
vulnerabilities found within a Kubernetes Container. The report will populate only if you have deployed the new anchore-k8s-inventory.
Vulnerabilities by ECS Containers is a new report template which will allow you to view and filter on
vulnerabilities found within an ECS Container. The report will populate only if you have deployed the new anchore-ecs-inventory.
Vulnerabilities by Kubernetes Namespace report now displays the AnchoreAccount Name.
Configuration
A new configuration option is available that can show a significant reduction in resource usage. It is available for
customers that do not use the /v1/query/images/by_vulnerability API.
Setting this configuration option to false will:
Disable the /v1/query/images/by_vulnerability API and return a 501 code if called.
Disable the SBOM vulnerability rescans which occur after each feed sync. It is these rescans that populate the data returned by the API.
Customers who are using /v1/query/images/by_vulnerability API, are encouraged to switch to calling the
ImagesByVulnerability query in the GraphQL API. This query provides equivalent functionality and will allow you to
benefit from this new configuration option.
Docker Compose users can set environment variable, ANCHORE_POLICY_ENGINE_ENABLE_IMAGES_BY_VULN_QUERY, in the policy engine to false.
Helm users can set services.policy_engine.enable_images_by_vulnerability_api key in config.yaml
Fixes
Improved operating system matching prior to determining if a CVE should be reported against an image.
CVSS Scores from NVD are now preferred over other source. This provides a more consistent end user experience.
Addressed a failure to properly generate the Policy Compliance by Runtime Inventory report while using the new anchore-k8s-inventory agent. A symptom was that the Compliance and Vulnerability Count fields within the Kubernetes tab remained in Pending state.
Switch archive delimiter in malware scan output from ‘!’ to ‘:’ to ensure shell copy-paste ease of use.
Improved a few misleading internal service log messages.
Fixed an issue that resulted in a scheduled query, with a qualifying filter, failing to execute. Examples of filters which will result in this failure:
Query Name
Filter Name
Tags by Vulnerability
Vulnerability Last Tag Detected In Last
Images Affected By Vulnerability
Vulnerability Last Tag Detected In Last Image Analyzed In Last
Artifacts By Vulnerability
Vulnerability Last Tag Detected In Last
Policy Compliance History by Tag
Tag Detected In Last Policy Evaluation Latest Evaluated In Last
Policy Compliance by Runtime Inventory Image
Policy Evaluation Latest Evaluated In Last
Runtime Inventory Images by Vulnerability
Vulnerability Last Image Last Seen In
Unscanned Runtime Inventory Images
Last Seen In
UI Updates
The Watch Repository toggles displayed in the registry and repository view tables under Images can now be suppressed when the enable_add_repositories property in config-ui.yaml is set to False for admin or standard accounts. This and other parameters contained in the UI configuration file are described
here.
The Vulnerabilities by ECS Container report template has been added that allows you to search for a specific vulnerability across ECS containers in order to view a list of clusters services, tasks and containers that are impacted by the vulnerability.
The Vulnerabilities by Kubernetes Container report template has been added that allows you to search for a specific vulnerability across Kubernetes containers in order to view a list of clusters services, tasks and containers that are impacted by the vulnerability.
Fixes
References to Anchore Engine have been removed and replaced
app-wide with Anchore Enterprise Services
A fix has applied for an issue where a read-only user was not able to manage registry credentials in another context even when they had a full-control role associated with that account
An Account Name filter has been added to the Kubernetes Runtime Vulnerabilities by Namespace report template, and improved descriptions have been provided for the Label and Annotations filters
Various supporting libraries have been updated in order to improve security, performance, and also to remove deprecation warnings from browser and server output logs. Redundant libraries have been removed to reduce the app startup time and overall size.
Recommended Component Versions
Component
Recommended Version
Enterprise
v4.8.0
Enterprise UI
v4.8.0
Helm Chart
v1.26.0
AnchoreCTL
v1.7.0
anchore-k8s-inventory
v1.0.0
anchore-ecs-inventory
v1.0.0
KAI (Deprecated)
v0.5.0
Kubernetes Admission Controller
v0.4.0
REM (Remote Execution Manager)
v0.1.10
Harbor Scanner Adapter
v1.0.1
Jenkins Plugin
v1.0.25
13.1.53.9 - Anchore Enterprise Release Notes - Version 4.7.1
Anchore Enterprise v4.7.1
Note
Please view the details around the upcoming Enterprise v5.0.0 release. Important requirements must be met before upgrade. See link below.
Please Note: If you are upgrading from an Anchore Enterprise version prior to v4.2.0, there is a known issue that will require you to upgrade to v4.2.0 or v4.3.0 first. Once completed, you will have no issues upgrading to v4.7.0. Please contact Anchore Support if you need further assistance.
Enterprise Service Updates
Improvements
Runtime Inventory
Anchore has introduced two new Runtime Inventory Agents for use with the v4.7.0 release of Anchore Enterprise.
anchore-k8s-inventory and anchore-ecs-inventory will provide better access to your runtime environments.
See Kubernetes Runtime Inventory and ECS Runtime Inventory for more details.
Runtime Inventory TTL was also improved to be more effective in helping you to manage expired inventory items.
Reporting
Vulnerabilities by Kubernetes Namespace is a new template which will allow you to view and filter on
vulnerabilities found within a Kubernetes Namespace. The report will populate only if you have deployed the new anchore-k8s-inventory.
Feeds
Anchore Enterprise is now fully integrated with our Open Source applications of anchore/vunnel and anchore/grype-db.
Chainguard Linux Vulnerability Provider has been added to the list of feeds.
Support for the OVAL v2 RHEL Security Endpoint.
Account email field is now editable via API.
Vulnerability Package trigger, adds a new parameter that controls the behavior of vulnerabilities found in the base image. The new parameter can be set to trigger on vulnerabilities in the base image, trigger on vulnerabilities that are not in the base image, or to trigger only on vulnerabilities present in the base image.
Container Image SBOM generation and import from AnchoreCTL without the need for Syft
Combined with AnchoreCTL 1.6.0, you can now analyze images fully using AnchoreCTL and import the results to Enterprise, including secret scans, filesystem metadata analysis, content searches and file retrieval with equivalent functionality to what Enterprise-backend analysis scans produce. The only exception is that malware scanning is not supported by AnchoreCTL-based analysis.
Fixes
Enabling the Repo Watcher when there is already an image from the repo with an active subscription, no longer returns an error.
Adding a source sbom which does has java packages without a metadata virtual path is handled correctly.
Addressed an issue where Anchore Enterprise displayed multiple Binary Package Locations.
Correctly handle an import of an image sbom which contains packages with no metadata.
Improved handling of the Microsoft Windows product id during analysis of Windows containers.
UI Updates
Fixes
Various supporting libraries have been updated in order to improve security, performance, and also to remove deprecation warnings from browser and server output logs. Redundant libraries have been removed to reduce the app startup time and overall size.
Recommended Component Versions
Component
Recommended Version
Enterprise
v4.7.0
Enterprise UI
v4.7.0
Helm Chart
v1.25.0
AnchoreCTL
v1.6.0
anchore-k8s-inventory
v1.0.0
anchore-ecs-inventory
v1.0.0
KAI (Deprecated)
v0.5.0
Kubernetes Admission Controller
v0.4.0
REM (Remote Execution Manager)
v0.1.10
Harbor Scanner Adapter
v1.0.1
Jenkins Plugin
v1.0.25
13.1.53.11 - Anchore Enterprise Release Notes - Version 4.6.0
Anchore Enterprise 4.6.0
Anchore Enterprise release v4.6.0 contains targeted fixes and improvements.
A Database update is needed.
Note
Please view the details around the upcoming Enterprise v5.0.0 release. Important requirements must be met before upgrade. See link below.
Please Note: If you are upgrading from an Anchore Enterprise version prior to v4.2.0, there is a known issue that will require you to upgrade to v4.2.0 or v4.3.0 first. Once completed, you will have no issues upgrading to v4.6.0. Please contact Anchore Support if you need further assistance.
Enterprise Service Updates
Improvements
Runtime Inventory
New API Delete functionality for any runtime inventory context that is no longer being reported on by KAI.
/enterprise/inventories DELETE
The Inventory Watcher improved logging output at info level so that it is more concise.
The Inventory Watcher now contains additional global metrics
anchore_monitor_inventory_contexts_monitored_total - Total number of contexts monitored via subscriptions
anchore_monitor_inventory_images_total ( found ) - Total number of images from runtime inventory that are being watched
anchore_monitor_inventory_images_total ( success ) - Total number of images successfully added to the catalog
anchore_monitor_inventory_images_total ( fail ) - Total number of images that failed to be added to the catalog
Policy Triggers
Vulnerability Package Trigger has a new parameter inherited from base. It provides more control on which vulnerabilities will be considered by the policy.
true shows vulnerabilities only inherited from the base image
falsehides vulnerabilities inherited from the base image
We have deprecated various triggers using blacklist and whitelist terminology in favor of denylist and allowlist.
The deprecated triggers will continue to work until they are removed in Enterprise v5.0.0. Note that existing allowlist
entries for the deprecated triggers will continue to work until the policy is updated to use the new triggers at
which time the trigger IDs will no longer match.
Analysis Jobs
Improves the ability of the system to re-queue image analysis and image import jobs from shut-down analyzers to minimize the impact of
scale-down operations on the set of analyzers. In addition to the existing analyzing state timeout behavior, the system can
now detect an image was analyzed by a now-down analyzer as soon as the analyzer is reported as down, making the re-queue time
a matter of minutes instead of hours.
Additional metrics were also added to help give more visibility into analysis
anchore_analyzer_status ( waiting ) - Analyzer is idle and is waiting to receive work from the queue
anchore_analyzer_status ( error ) - Analyzer is not able to process work
anchore_analyzer_status ( processing ) - Analyzer is currently processing work
anchore_analyzer_dequeue_latency - Indicator of the responsiveness of the queue service for this analyzer
Fixes
Fixed an SSL Error for customers who are using custom certificates.
Resolved problems in the Inventory Watcher when processing large inventories.
Policy validation has been improved during initial creation of the policy bundle. This will provide a better feedback mechanism so that invalid policies can be fixed earlier.
Addressed an issue where the python binary cataloger incorrectly returned multiple instances of a python package.
UI Updates
Fixes
Deprecated policy triggers
A new warning indicator has been added to the policy rule list to flag triggers that are invalid or that have been deprecated. If you edit a policy rule containing a deprecated trigger, we also indicate that the currently selected trigger has been deprecated and replaced by another trigger, so that it is easy to know how to fix policies containing such triggers.
Policy editor tables
We have upgraded the table widgets within the policy editor to make the columns resizable.
Miscellaneous
Various supporting libraries have been updated in order to improve security, performance, and also to remove deprecation warnings from browser and server output logs. Redundant libraries have been removed to reduce the app startup time and overall size.
13.1.53.12 - Anchore Enterprise Release Notes - Version 4.5.0
Anchore Enterprise 4.5.0
Anchore Enterprise release v4.5.0 contains targeted fixes and improvements.
There is no Database update needed.
Enterprise Service Updates
Improvements
Introducing a new RBAC Role called report-admin. This is meant to be a companion role for users that need to work with scheduled queries but do not have other write permissions.
Anchore Enterprise is now using Red Hat Universal Base Image 9 Minimal as its base image.
This significantly reduces the number of packages provided
by the operating system, thus reducing the vulnerability surface overall.
Fixes
Fixed an issue that prevented image metadata from being correctly displayed for images with unsupported packaging systems (Arch Linux, etc).
Properly identifies alpine:edge when evaluating the vulnerabilities.vulnerability_data_unavailable trigger.
Fixed an issue that allowed admin users to perform some operations against non-existent accounts.
Database upgrades now succeed from Anchore Enterprise Releases older than v4.2.0.
Users who only have read-only permissions are correctly prevented from creating, updating and deleting scheduled report queries.
Deprecation Reminders
The anchore-cli has been deprecated and will be removed from the docker.io/anchore/enterprise image during the v5.0.0 Release.
AnchoreCTL is the only supported command line tool for interacting with Anchore Enterprise.
UI Updates
Improvements
Artifact Analysis
In addition to our native JSON format, the Artifact Analysis
view now allows Software Bill of Material (SBOM) data to be
downloaded in both the Software Package Data Exchange (SPDX) format
and the OWASP CycloneDX format.
The table in the Vulnerabilities tab now contains a Detected At
column that indicates the analysis discovery time of the
vulnerability. This data is now also present in the downloadable
report data for this view.
Policy Editor
The Policy Editor dialog now displays any rules that contain
invalid or obsolete triggers in its summary table. These rules are
similarly highlighted when the rule is edited for easy removal.
Reports
From within the administrative account, both the Quick Reports
and Report Manager controls now allow you to preview and
retrieve report data from either the local account or from all
accounts system-wide.
A new template has been added to our current set of system templates
that surfaces policy compliance data against runtime inventory
artifacts.
Additional fields have been added to our existing system templates:
Vulnerability-related templates now include a links field
Runtime-related templates now include an account field
All templates now include an inventory_type field
Note: In order to surface these fields, new queries must be
created using these updated system templates as their basis—they
will not be present in any existing stored queries.'
Fixes
System: User Management
Prior to this fix, updates to the user list would be inaccurate
if a user was created by another user with full-control privileges
from a switched account context. Now addressed.
Logging
A minor issue has been addressed whereby active users that had their
accounts deleted, or resided within an account that was disabled,
would not be correctly logged after this event.
Policy Manager: Rules
Gate rules created for Source artifacts will now only display the
triggers associated with that artifact type. Prior to this fix, the
entire set of triggers (for both Source and Image types) were
shown in the dropdown.
Report Manager: RBAC
Access control restrictions for report management operations have
now been applied throughout this feature. The creation, management,
and deletion of report schedules and their associated items are now
gated by the RBAC roles associated with the reports service.
Application Architecture
The Anchore Enterprise UI is now provisioned using Red Hat Universal Base Image 9 Minimal.
This image significantly reduces the number of packages provided
by the operating system, thus reducing the vulnerability surface
overall.
System: Login
Addressed an issue whereby logging in via an external IDP, as
opposed to the SSO link on the Enterprise UI login page, would fail
under certain circumstances.
Miscellaneous
Various supporting libraries have been updated in order to improve
security, performance, and also to remove deprecation warnings from
browser and server output logs. Redundant libraries have been
removed to reduce the app startup time and overall size.
13.1.53.13 - Anchore Enterprise Release Notes - Version 4.4.1
Anchore Enterprise 4.4.1
Anchore Enterprise release v4.4.1 is a patch release which solely addresses a critical vulnerability in the ClamAV malware scanner (CVE-2023-20032).
The malware scanner is not enabled by default within Anchore Enterprise. If you have not enabled the malware scanner you are not exposed to this vulnerability.
Please Note: If you are upgrading from an Anchore Enterprise version prior to v4.2.0, there is a known issue that will require you to upgrade to v4.2.0 or v4.3.0 first. Once completed, you will have no issues upgrading to v4.4.1. Please contact Anchore Support if you need further assistance.
13.1.53.14 - Anchore Enterprise Release Notes - Version 4.4.0
Anchore Enterprise 4.4.0
Anchore Enterprise release v4.4.0 contains targeted fixes and improvements.
A Database update will be required.
Please Note: If you are upgrading from an Anchore Enterprise version prior to v4.2.0, there is a known issue that will require you to upgrade to v4.2.0 or v4.3.0 first. Once completed, you will have no issues upgrading to v4.4.0. Please contact Anchore Support if you need further assistance.
Enterprise Service Updates
Improvements
The AnchoreCTL binary for linux x86 is now packaged into the docker.io/anchore/enterprise image for use via direct
’exec’ invocation or to copy from the image into your environment without having to access external networks. The
packaged binary will be the current release of AnchoreCTL at the time of release of Enterprise.
Configuration Options
enable_package_db_load is a new configuration option that will allow users to disable the use of the
package.verify policy trigger. Disabling this trigger, will prevent further additions in the image_package_db_entries
table, which will reduce load on the database. In addition, users may now safely delete the existing entries in the
table and reclaim database capacity usage. See Database for more details.
A new option for users to specify the endpoint used for the Ubuntu Feed Driver. See
Feeds for more information.
Enterprise API now supports the ability to download SBOMs in SPDX Format and CycloneDX Format.
/images/{imageDigest}/sboms/spdx-json
/images/{imageDigest}/sboms/cyclonedx-json
/sources/{source_id}/sbom/spdx-json
/sources/{source_id}/sbom/cyclonedx-json
A new Image Ancestry Policy Gate has been added. Allows the user to verify that a specified image contains an
approved base image. See Policy Checks
for complete details.
Binary detection is now consistent between uploaded SBOMs generated by AnchoreCTL and SBOMs generated by the
backend Enterprise Service.
Tech Preview: Enterprise Reporting provides a global endpoint which will allow administrators to generate queries that
will include data from all accounts. See Reports from more details.
Vulnerability data is now available from Feed Group - Ubuntu 22.10 (Kinetic Kudu).
Fixes
Vulnerability feed group information is now populated at time of switch-over. This should address issues with
displaying the vulnerability group record counts in systems with a large number of active images.
Addressed an error path exception in the Application Version Vulnerability API.
Addressed a parsing issue within the execution of Policy Gate retrieved files with Trigger content regex.
Schedule Report generation will gracefully handle an error found in a report and continue with the generation of other reports.
Properly account for rolling distros (currently Wolfi) when evaluating the vulnerabilities.vulnerability_data_unavailable trigger.
Addressed an analysis failure during SBOM generation for certain images with cycles of soft links.
Deprecation Reminders
The anchore-cli python client has been deprecated as of Enterprise Release
v4.2.0. It will be removed from the docker.io/anchore/enterprise image during the v4.5.0 Release.
AnchoreCTL is the only supported command line tool for interacting with Anchore Enterprise.
UI Updates
Improvements
Reporting
Prometheus logging has now been added to the application with the
following data now being captured and reported:
General node process metrics
Number of active sessions
Count of HTTP requests, split by endpoint and status code
HTTP request duration
Latency of each service, calculated during every health check cycle
Configuration
Sessions will now preferentially use OAuth tokens to provide and maintain
ongoing authentication state
In the event that the token dispensation is not possible when the user
logs in, the system will fall back to using basic authentication
Added confirmation toast on dashboard widget creation
Updated various supporting libraries to improve security and performance
Redundant libraries have been removed to reduce the app startup time and
overall size
Fixes
Reporting
Schedules that contain queries with data enumerations can now be saved
properly
Configuration
Increased the opacity on both the filter input and the sort dropdown when
either are in a disabled state-that is, when no application data exists
This ensures the text is legible while still clearly indicating the
inactive state
Policy Editor Evaluation correctly updates after changes are applied
RBAC rules are now correctly applied to the radio button used to change
the active bundle
Copy bundle modal would now allow all key events
Service errors and access control errors are now properly articulated
13.1.53.15 - Anchore Enterprise Release Notes - Version 4.3.0
Anchore Enterprise 4.3.0
Anchore Enterprise release v4.3.0 contains targeted fixes and improvements.
A Database update will be required.
Enterprise Service Updates
Improvements
Reporting Improvements
The runtimeInventoryImagesByVulnerability report query now supports
various vulnerability filters such as Vulnerability Id.
Various vulnerability-related report queries, such as artifactsByVulnerability,
tagsByVulnerability, now support filtering by one or more severities
via the Severities option.
A new report query called runtimeInventoryUnscannedImages is now available. It provides the list of images
in the runtime inventory that have not been analyzed.
Introducing a new RBAC Role called repo-analyzer. It is meant to be a companion to the image-analyzer role and
specifically provides the ability to create a repository subscription.
Now importing the Wolfi Security Feed. Used in vulnerability matching for Wolfi OS Packages.
Fixes
Fixed a failure during the cleanup of old versions of GrypeDB. This was seen to cause an issue during feed sync.
When deploying with multiple instances of policy-engine, there will only be a maximum of two GrypeDB instances.
Addressed an issue which prevented a scheduled query of a Runtime Inventory Images By Vulnerability from running.
Fixed the unlikely condition where a deleted image is added back into the system, due to a subscription processing error.
Image analysis properly displays all found versions of the same OS package.
Increased accuracy of vulnerability matches on Debian source packages when the source package version differs
from the binary package version. Requires re-analysis in order to populate necessary metadata for existing scans.
Identifies improper SSO IDP Configuration during creation or modification of an existing configuration.
Deprecation Reminders
The anchore-cli python client has been deprecated as of Enterprise Release
v4.2.0. It will be removed from the Enterprise image during the v4.4.0 Release.
AnchoreCTL is the only supported command line tool for interacting with Anchore Enterprise. It will be included in the Enterprise image during the v4.4.0 Release.
UI Updates
Improvements
A new Quick Report for Unscanned Runtime Inventory Images is now available.
It shows which images running in Kubernetes clusters have not yet been
analyzed by Anchore so that users can verify all images are scanned in CI/CD.
The Runtime Inventory Images by Vulnerability report type now supports
various vulnerability filters such as Vulnerability Id. This makes it
easier to focus efforts on zero-days (or other critical and well-known
vulnerabilities) and find exactly which runtime contexts (and the images
within) are impacted by a specific vulnerability.
Various vulnerability-related reports (Artifacts by Vulnerability,
Tags by Vulnerability, etc.) now support filtering by one or more severities
via the Vulnerability Severities option.
An improvement has been made to our cookie management for higher entropy via
an autogenerated encryption key unique to each deployment and to allow
administrators to change it if they wish.
Fixes
Fixed a bug causing logins made directly via an IDP, as opposed to the SSO
link on the Anchore login page, to fail with a 404 error.
Improved fault-tolerance in the event of an invalid or malicious websocket
request: using a scanner such as Nessus could under certain conditions lead to
an application crash.
Fixed a routing issue causing requests to /artifacts/image/ with a trailing
slash to lead to a 404 page not found error.
Various supporting libraries have been updated in order to improve security,
performance, and also to remove deprecation warnings from browser and server
output logs. Redundant libraries have been removed to reduce the app startup
time and overall size.
13.1.53.16 - Anchore Enterprise Release Notes - Version 4.2.0
Anchore Enterprise 4.2.0
Anchore Enterprise release v4.2.0 contains targeted fixes and improvements. A Database update will be required.
Enterprise Service Updates
Improvements
SSO feature enhancements includes
The ability for an Anchore administrator to create another user in the admin account who will authenticate using SSO/SAML enabling use of 2FA and other SSO security mechanisms.
A strict mode which will require SAML users to be configured in Anchore Enterprise prior to user login as an alternative to the existing behavior that creates Anchore users at login time only. This allows administrators to restrict login access for SSO users to only those users specifically allocated by the Anchore admin.
See [Configuring SSO](https://docs.anchore.com/current/docs/configuration/user_authentication/sso/ for additional information about SSO.
Adds detection of non-packaged node.js binaries during image analysis to support sbom and vulnerability scanning.
The Reporting Service now offers the ability to show and filter on vulnerabilities that the vendor of an image distribution either disagrees with or has decided not to fix. This matches the ‘vendor_only’ filtering behavior of the vulnerability APIs and AnchoreCTL.
Fixes
Fixed an issue where the analysis queue processing stops. This was seen in environments with multiple Catalog, Policy Engine, and Analyzer Containers running.
Populates fix information per module for rpm-based feeds such as oracle, rhel, and centos. The rpm modularity is now taken into account when matching rpm packages to vulnerabilities.
Make RedHat/CentOS AppStream modules fully supported for vulnerability matching with reduced false positives and more accurate fix versions.
Improved error handling during SSO IDP Configuration changes.
During the creation of an SSO default account, the default policy bundles are correctly populated.
Improved error handling in the MSRC feed driver so that invalid records are skipped and processing will continue for other records.
Feature Removal
Removed the Kubernetes Runtime Inventory Embedded mode, and associated cluster configuration APIs. This feature saw limited usage and the same goal can be accomplished by deploying KAI into the cluster directly in inventory mode. See https://docs.anchore.com/current/docs/configuration/runtime_inventory/ for more information about configuring KAI in agent mode.
Deprecation Reminders
The anchore-cli python client will be deprecated as of Enterprise Release v4.2.0. AnchoreCTL will be the only supported command line tool for interacting with Anchore Enterprise.
UI Updates
Improvements
The UI now supports the creation and configuration of administrators who
can authenticate directly using Single Sign-On (SSO). In addition,
administrators in deployments that have been configured to use
exclusionary account assignment by disabling “Just-in-Time” account
provisioning for SSO can now associate specific standard users with an
individual IDP.
For environments where analytical volume is extremely high, the
Kubernetes page now provides an optimized presentational view that
excludes information from the reporting services. This version of the view
can be enabled via the file- or environment-based Enterprise Client
application configuration
parameters.
The Vulnerabilities tab now provides a client-side filter for
Vendor Only CVEs that is enabled by default. When disabled, the
full vulnerability dataset is now displayed. Upon disabling the
filter, a new Will Not Fix column is will be displayed within
the results table.
A Vulnerability Will Not Fix filter has been added to the following base templates in the Scheduled Reports view:
Images With Critical Vulnerabilities
Artifacts by Vulnerability
Tags by Vulnerability
Images Affected by Vulnerability
Fixes
In previous versions, setting a boolean filter to true in
Quick Reports would not get correctly passed to the web service. This
is now fixed.
Users with the policy-editor role should not have access to the
Artifact Analysis view. Although the associated navbar icon was
correctly disabled, users could still access the page (albeit in
read-only mode) directly via the URL. This behavior has now been
addressed.
The Only Show toggles in the Vulnerabilities tab of the Artifact
Analysis view provide a number of filters that can reduce the number of
items displayed. When applied, the table updates accordingly—however,
prior to this fix the graph and vulnerability severity summary counts did
not. This issue has now been addressed.
Prior to this fix, if a user encountered an error when saving a policy,
there was no way for them to fix the error and save the policy again
because the Save button remained disabled. Users can now attend to the
error and save the policy.
Various supporting libraries have been updated in order to improve
security, performance, and also to remove deprecation warnings from
browser and server output logs. Redundant libraries have been removed to
reduce the app startup time and overall size.
13.1.53.17 - Anchore Enterprise Release Notes - Version 4.1.1
Anchore Enterprise 4.1.1
Anchore Enterprise release v4.1.1 contains targeted fixes and improvements.
Enterprise Service Updates
Improvements
Introduced a Recommendation field that is available in the Policy Rule. This field will be visible in the image policy check results. It will allow the Policy Rule creator to provide a generic hint on how to fix policy findings.
Improved the description of the “max days since creation” parameter within the vulnerability->package rule. It now states, “A grace period, in days, for a vulnerability match to be present after which the vulnerability is a policy violation”.
Fixes
Fixed enterprise database schema upgrade process from 4.0.x to 4.1.0 schema when run on a fips-enabled host.
Improved error message when providing invalid tag to the External API Inventory calls.
Improved error messages around registry access failures.
Improved detection and error handling of an image that contains an empty or unknown distro.
Image analysis will succeed when the image contains an uncompressed layer.
Image analysis will succeed when the image contains un-parsable rpmdb file entries.
On a restart or a manual resync of the feed service, the system will maintain no more than 2 versions of the grype database records.
Tag status is updated immediately in reporting data. Previously, the tag status updates maybe have been delayed.
Deprecation Reminders
The Embedded Inventory Mode Feature, has been deprecated. During the future Enterprise Release v4.2.0, it will be removed.
The anchore-cli python client will be deprecated as of the future Enterprise Release v4.2.0. AnchoreCTL will be the only supported command line tool for interacting with Anchore Enterprise.
UI Updates
Improvements
A Recommendation field has been added to the policy rule editor to allow
policy creators to provide bespoke remediation guidance. This information
will be surfaced within the output for any matched rule within the
Policy Compliance results table in the Artifact Analysis view.
The service log output for the application has been overhauled.
Administrators with access to the running app instance are now able to
view detailed timestamped information—categorized by level—that describes
the routes being accessed, connection and configuration details, and
information about the major operations taking place within the runtime.
Additional logging data will be added in subsequent releases.
Fixes
The management of database connectivity details from the app has been updated to handle special characters in configuration strings.
A Forbidden error is displayed when a non-administrative user tries to
directly access the /system/notifications tab via URL. It also blocks a
fetch for the LDAP configuration details for non-admins.
Various supporting libraries have been updated in order to improve
security and performance, and also to remove deprecation warnings from
browser and server output logs. Redundant libraries have been removed to
reduce the app startup time and overall size.
13.1.53.18 - Anchore Enterprise Release Notes - Version 4.1.0
Anchore Enterprise 4.1.0
Anchore Enterprise release v4.1.0 contains targeted fixes and improvements.
A Database update will be required.
4.1.0 Upgrade Notes
The 4.1 upgrade requires a new vulnerability database to be built by the feed service using a new schema. In the time between the new deployment startup and the completion
of the first post-upgrade feed service data sync, the policy engine API will return errors for vulnerability scans. Once it receives the newly built vulnerability database
from the upgraded feed service it will resume normal operation. Depending on the deployment, the data update and new db build may take several hours.
The system will resolve this condition on its own but your maintenance window should take this into account.
Notes for new deployments
Due to improved error handling in the vulnerability scanner (see details below) new deployments will not provide vulnerability reports via the API until the first full vulnerability
sync has occurred but images may be analyzed during this time. Once the first sync is completed (you can see using anchorectl feed list), the vulnerability scans will return successfully.
Enterprise Service Updates
Improvements
Source to Image SBOM Drift
Introduces a new artifact relationship API which provides the ability to indicate that a container image was built from one or more specific source repository revisions. Allowing Anchore to show when the source repository’s SBOM packages are correctly found in the image SBOM.
Introduces a new policy gate and trigger which will raise drift findings in the policy compliance evaluations.
Vulnerability False Positives Reduction
Introduces an Anchore vulnerability feed shown as ‘anchore:exclusions’. This is a curated feed of vulnerability matches which will be automatically excluded from results in order to reduce false positives.
The feed utilizes Version 4 of the Grype database schema which provides support for vulnerability match exclusion data.
Application Name and Version Name improvements
Added uniqueness and non nullable constraints to the following fields:
Application.name must be unique per account
ApplicationVersion.version_name must be unique per application
Attempting to create or update these fields to a non-unique value will result in a 409 error.
During upgrade, if existing records are found to have the same value, they will be automatically renamed by appending ‘_N’ where ‘N’ is incremented for each conflict. For example, if there are two applications named “test” within an account, one will be renamed “test_1”.
Accounts may now be created with a name that contains an underscore (_) as the last character.
Tag subscriptions will now be removed when the last image for a tag is deleted from the system.
Adds last_seen_in_days field to the archival rule exclusion block that allows images to be excluded from archive if there is a corresponding runtime inventory image where last_seen is within the specified number of days
Image Vulnerabilities now provides the timestamp when each vulnerability was detected on the image. This is now available in the API and is indicated with the “detected_at” field.
Reduced the number of Error Events generated when there is an issue accessing the registry. You will now only see on event generated per registry/repo. Previously there would be an event for each image.
In order to reduce vulnerability false positives, it is recommended that users do not attempt vulnerability matches on go main modules with pseudo-version v0.0.0- or (devel) unless the true version has been specified via correction.
Fixes
Subscriptions are now being properly cleaned up when images are deleted or archived.
The API will return a proper error message if the caller attempts to delete an image, using the image ID, that is the latest of its tags and still has an active subscription.
Providing an unsupported vulnerability type for API sources/{source_id}/vuln will result in a proper error message.
Addressed an incorrect error events regarding Image Registry Lookups. This event was generated in error even when registry credentials were valid and the lookup succeeded.
Errors that are detected during a vulnerability scan are now properly reflected in the API. Previously, it was possible that the scan would fail, but it would appear that the image had no vulnerabilities.
Importing an image SBOM where the distro version is NULL or None, will now succeed.
A max-images-per-account Archive Rule will correctly handle an image that has more than one tag associated with it.
Deprecations
The Embedded Inventory Mode Feature has been deprecated as of this release. It will be removed from the Enterprise product during the future release of v4.2.0.
Configuration Variable ‘ANCHORE_VULNERABILITIES_PROVIDER’ is no longer supported by Enterprise.
Configuration Variable ‘ANCHORE_ENTERPRISE_FEEDS_THIRD_PARTY_DRIVERS_ENABLED’ is no longer supported by Enterprise.
Future Deprecations
The anchore-cli Python client will be deprecated as of version 4.2 of Anchore Enterprise. AnchoreCTL contains all of the functionality of anchore-cli and is the default, supported tool for interacting with Anchore Enterprise as of 4.1.
UI Updates
Improvements
In SSL-enabled environments, all requests made from client are automatically upgraded to use a secure connection.
Account entries and user entries are now both permitted to contain spaces in their names. In addition, account names are now permitted to contain a trailing underscore (_) character.
Various supporting libraries have been updated in order to improve
security, performance, and also to remove deprecation warnings from browser and server output logs. Redundant libraries have been removed to reduce the app startup time and overall size.
Fixes
Single sign-on (SSO) authentication now preserves the page URL. Prior to this update, the user would always be sent to the Dashboard view, but now the original location is used after the SSO authorization round-trip is complete.
Due to a cookie misconfiguration, completion of the SSO round-trip would
not always place the user inside an authenticated view, requiring a page refresh—this issue has now been addressed.
The Whats's New tour dialog will now be displayed for new SSO users /
SSO users logging in after a version update.
When changing the displayed item range for any table within the Kubernetes view, under certain circumstances the app would
whitescreen—this issue has now been fixed. In addition, the summary total of items shown for each table is now displayed correctly.
The documentation link provided in the Add Cluster popup in the
Kubernetes view is now correct.
13.1.53.19 - Anchore Enterprise Release Notes - Version 4.0.3
Anchore Enterprise 4.0.3
Anchore Enterprise v4.0.3 is a patch release containing targeted fixes and improvements. No database upgrade is necessary.
Enterprise Service Changes
Improvements
Expanded capability for users with an image-analyzer role. The role now has the ability to create subscriptions.
Added Amazon Linux 2022 vulnerability feed to the amazon driver. This will populate the amzn:2022 namespace.
Support added for cataloging RPM databases with NDB and sqlite formats.
Improved handling of manifest lists where the mediaType is missing.
Details of Event Notifications have been improved for the following events:
user.image.analysis.pending
user.image.analysis.processing
user.image.analysis.complete
user.image_tag.added
Fixes
The global archive rule for max number of images per account, will only consider images that have been analyzed and are in the active state.
In some configurations, the global archive delete rule failed to run do to an error in the order of the rule processing. This issue has been corrected.
UI Updates
Improvements
The Applications button in the navbar will remain highlighted
when presented with the Artifact Analysis view for a source
item, as sources are considered part of the navigation path for
applications. In addition, this button will also now indicate the
last application and version viewed (if applicable) in a popup on hover.
Grab targets for Dashboard items widget have been increased inside for
easier focus and manipulation.
The legends associated with charts in the app have been removed
in all instances where the meaning of the data is otherwise
indicated.
The createSubscription permission is now a requisite to use
components that create subscriptions—this permission has also been
added to roles where it was missing yet required in the context of
the general purpose of that role (for example, image-analyzer).
Non-alphanumeric characters are now permitted in the password used
to authenticate against the AppDB service.
Fixes
The Copy Allowlist modal within the Tools dropdown for items
displayed within the Allowlists tab of the Policy Editor had
an issue whereby focus would be drawn away from the Name input
field, preventing the submission of a valid form. This behavior is
now fixed.
Due to a regression in our date component, removing a timestamp
from the Edit Allowlist Items dialog in the Policy Editor or
from the Add / Remove Allowlist Item dialog associated with
compliance results in the Artifact Analysis view would result in
an error on save. This has been fixed.
The Copy Policy modal within the Tools dropdown for items
displayed within the Policies tab of the Policy Editor
would successfully copy a policy, but would fail to close after the
operation concluded. This behavior is now fixed.
The summary count of event items in the Events view now
correlates to the number displayed after a severity filter
(WARN / INFO) has been applied. Prior to this fix, the count
would remain the same.
Removing all filter boxes displayed within the Events view would
also remove the Clear Filters button, preventing any filters
previously applied from the boxes from also being removed. This
behavior has now been fixed.
An error in our payload validation system caused the notifications
component to fail to update upon editing an entry. This issue has
now been resolved.
The RBAC permissions associated with policy-editor role are now
correctly asserted when trying to navigate to Images or
Applications using the main navigation bar (or when using the
minimized icons in the topnav that appear when the main bar is out
of view).
Various supporting libraries have been updated in order to improve
security, performance, and also to remove deprecation warnings from
browser and server output logs. Redundant libraries have been
removed to reduce the app startup time and overall size.
13.1.53.20 - Anchore Enterprise Release Notes - Version 4.0.2
Anchore Enterprise 4.0.2
Anchore Enterprise v4.0.2 is a patch release containing targeted fixes and improvements. No database upgrade is necessary.
Enterprise Service Changes
Improvements
Expanded capability for users with an image-analyzer role. The role now has the ability to modify image subscriptions.
Added support of space characters in usernames.
It is now possible to create an account name that contains a forward slash character.
Added support for policy bundle license gate triggers to differentiate between os and non os components during package license checks.
Tech Preview: Added the ability to run a stateless vulnerability scan of a sbom via a new API call.
Added new event types which improve visibility during the image analysis workflow.
user.image.analysis.pending
user.image.analysis.processing
user.image.analysis.complete
user.image_tag.added
Fixes
Fixed the growth of log files beyond 10MB and collection of log files when reaching the maximum count of 10 files.
Fixed the detection of vendored golang modules in built binaries.
Fixed the analysis of images with binaries built by golang 1.18 to correctly identify the go modules used.
Improved grypedb to exclude matching entries that have been withdrawn from GitHub Security Advisories.
Improved grypedb to handle entries without primary vulnerability identifier which may be received from vulnerability feed services.
Fix ability to update existing ECR registry credentials, no longer reports an 406 error.
UI Updates
Improvements
The content types within the SBOM tab under Artifact Analysis in the UI are now presented vertically to prevent them being truncated at narrower screen widths.
It is now possible to create an account name that contains a forward slash character
In order to improve the filtering and sorting operations within the
Mappings tab of the Policy Editor in the UI, source and image mappings are now stored within their own dedicated subtabs.
Various supporting UI libraries have been updated in order to improve
security, performance, and also to remove deprecation warnings from browser and server output logs. Redundant libraries have been removed to reduce the app startup time and overall size.
Fixes
When resizing the table columns in the UI Applications view, the action
controls could be made to overflow the bounds of their cell—this is now fixed.
Items added via anchorectl would occasionally cause an app exception when
viewed from within the Applications view in the UI. This issue has now been addressed.
The JSON entry in the SBOM Report download menu in the UI within the
Artifact Analysis view had an extraneous tail pointer, which has now been removed.
The button to download a report from the Vulnerabilities tab in the
Artifacts view in the UI now correctly reads Vulnerability Report instead of Compliance Report.
The no-results condition in the content view for Malware under the SBOM tab
of the Artifact Analysis view in the UI did not disambiguate between no results being found vs. malware scanning not being enabled. If malware scanning is not enabled, the message now indicates this and provides a link to the documentation for this feature.
As of release 4.0.0, the default behavior when creating a new policy bundle
was to add a default source rule and mapping, however this interfered with the upgrade path for users who wanted to upload a pre 4.0.0 bundle to the system. These default entries are no longer added.
The information and recent creation indicator labels within the Stored
Report Items component of the advanced Reports view in the UI are now
correctly aligned.
Switching account context within the UI and then attempting to download a
report would result in a fatal app error due to missing privileges on the call that fetches the data. This issue has now been addressed.
A slight error in the alignment of the header within the UI date picker
component has been addressed.
13.1.53.21 - Anchore Enterprise Release Notes - Version 4.0.1
Anchore Enterprise 4.0.1
Anchore Enterprise v4.0.1 is a patch release containing targeted fixes and improvements. No database upgrade is necessary.
Fixes
Fixes issues with vulnerability data matching for a small set of distros including Ubuntu, Oracle Linux, and Amazon Linux. All customers are recommended to upgrade to include this patch.
AnchoreCTL
The latest version of AnchoreCTL is 0.2.0.
AnchoreCTL is dependent on Syft v0.39.3 as a library.
AnchoreCTL v0.1.4 is vulnerable to CVE-2022-1766, which was fixed in v0.1.5+. We strongly encourage users to upgrade to the latest version.
The current features that are supported are as follows:
Ability to add sboms via anchorectl using stdin to provide an existing SBOM without re-creating it.
Source Repository Management: Generate an SBOM and store the SBOM in Anchore’s database. Get information about the source repository, investigate vulnerability packages by requesting vulnerabilities for a single analyzed source repository, or get any policy evaluations.
Download full image SBOMs for images analyzed with Enterprise 4.0.0.
Compliance Reports: View and operate on runtime compliance reports, such as STIGs, created by the rem tool.
Corrections Management: View and modify corrections information to help reduce false positives in your vulnerability results.
Image Management: View, list, import local analysis, and request image analysis by the system.
Runtime Inventory Management: Add, update, and view cluster configurations for Anchore to scan, as well as for the inventory reports themselves.
System Operations: View and manage system information for your Enterprise deployment.
13.1.53.22 - Anchore Enterprise Release Notes - Version 4.0.0
Anchore Enterprise 4.0.0
The Anchore Enterprise 4.0.0 release offers significant new supply chain security features expanding the Anchore Enterprise SBOM management platform beyond container scanning. Users can now generate and continuously monitor SBOMs for their source code repositories to identify vulnerability and security risks. Policy rules that are specific to managing source code are now available in the Policy Engine. Multiple source code and container image SBOMs can also now be grouped together as an Application that can be managed as a single set enabling generation of SBOMs representing a total application or service.
Additional new SBOM capabilities enable users to observe and limit SBOM drift between container image builds. Users can use policy rules to enforce immutable container best practices or help detect potentially malicious activity.
AnchoreCTL, the integration tool for use in CI/CD pipelines, has also been updated to include Source Repository Management.
A number of performance improvements have also been made to improve the response of the GUI, reporting service, as well as the efficiency of the queue processing processes.
Version 4.0.0 also includes other improvements and fixes.
New Features
The following new features are included in Enterprise 4.0.
SBOM Management
You can now generate SBOMs using AnchoreCTL as part of a command line or CI/CD workflow, through pulling content from a registry, or by submitting an artifact to the Anchore API.
SBOMs can be managed using the command line, API or GUI, where contents can be grouped together, annotated, viewed, or searched. Artifact metadata, vulnerability information, and policy evaluations can also be viewed and managed through the same interfaces.
All SBOMs can be downloaded into a variety of formats, either individually or collectively, to be sent to security teams, customers or end-users.
Applications
You can now build applications in Anchore Enterprise. Applications are the top-level building block in a hierarchical view, containing artifacts like packages or image artifacts. Applications can represent any project your teams deliver. Each application is associated with one or more application versions which track the specific grouping of artifacts that comprise a product version.
Anchore Enterprise lets you model your versioned applications to create a comprehensive view of the vulnerability and security health of the projects your teams are building across the breadth of your Software Delivery Lifecycle.
By grouping related components into applications, and updating those components across application versions as projects grow and change, you can get a holistic view of the current and historic security health of the applications from development through built image artifacts.
SBOM Drift
You can now set triggers for policy violations on changes in the SBOM between images, with the same tag, so that it can detect drift over time between builds of your images.
There is a new gate called:
tag_drift
The triggers are:
packages_added
packages_removed
packages_modified
Legacy Vulnerability Scanner No Longer Supported
The legacy vulnerability scanner is no longer included as an option when installing or upgrading Anchore Enterprise.
If you currently have Enterprise configured to use the legacy vulnerability scanner, you will not be able to successfully upgrade and start the system without explicitly configuring the default vulnerability scanner.
You can remove that configuration variable so the system can default to the current vulnerability scanner.
If you choose not to upgrade, instead performing a new installation of Enterprise, the vulnerability scanner will be configured by default.
Improvements
Analyzers no longer wait 5 seconds between analysis tasks if the last queue check had work available.
Adds global image count metrics to the set of available prometheus metrics.
Adds new internal reports_worker service that processes async tasks for reporting data.
Adds reporting task (data load, refresh, etc) to the set of available prometheus metrics.
System can be configured to automatically delete events older than a specified age to help manage data growth.
Go modules detected and reported from within binaries.
Removes old and unsupported PG8000 DB driver from container image. Database connection strings starting with “pg8000:” will no longer work.
Default PostgreSQL version used in the Quickstart docker-compose.yaml is updated from 9.6 to 12. Anchore’s Postgres requirements are unchanged.
Reporting service can be configured to remove reporting data for images deleted or archived.
Reporting service data update performance improvements and scalability improvements.
Fixes
Resolved data leaks from the grypedb feeds driver that could occur when process terminated by OS.
Resolved reporting service refresh issue.
Reporting service no longer looks at or attempts to refresh deleted image data. Reporting procedures now operate on data sets where the analysis state is analyzed and image state is active.
There was an issue with the Debian driver providing empty content. The grype-db-builder now builds all Debian data in the feeds service.
The NVD CVSS scores known issue from the 3.3.0 release has been fixed. NVD CVSS scores are now present in the API responses for the request to get a detailed information query about a vulnerability feed record.
Stale feeds policy trigger issue fixed.
Report worker tag refresh issue fixed.
Fixes vulnerability scanning failures for container images with no known distro.
Known Issues
The vulnerability scanner needs to be explicitly configured for Grype. If it is configured for v1 (legacy) vulnerability scanner, you will get an error during upgrade.
Workaround:
Helm chart: Set services->policy_engine->vulnerabilities->provider to grype.
Docker compose: The environment variable ANCHORE_VULNERABILITIES_PROVIDER=grype must be present for the policy-engine service.
Image drift only supports comparison of images analyzed by 4.0.0. Images analyzed prior to upgrade do not support drift computation and will result in a policy evaluation warning message.
Image SBOM downloads do not include content hints entries or detected binaries (python, go) that are not installed via a package manager.
Enterprise UI Changes
New Applications tab. Observe applications in Enterprise and see a summary of the artifacts that have been collected into an application. From the application view, you can drill down into the source repositories or container images that make up the application, and browse their SBOMS.
View applications and application versions from source repositories and image containers. The information is categorized by applications, with sub-categories of application versions available.
You can download an SBOM report in JSON format for everything in an application.
View information about an artifact, such as the policies set up, the vulnerabilities, SBOM contents,and metadata information.
From the Policies tab, set up policies and policy bundles for source repositories.
Fixes
Fixed inventory view performance issues with large data sets.
Report manager now returns preview results.
The inventory service error now returns the appropriate 500 error message.
Fixed how the ordering of policy bundle mappings are displayed within a table.
Increased the LDAP filter character limit.
Package names within the Vulnerability tab are now sorted alphanumerically.
Upgrading
Upgrading to Anchore Enterprise 4.0.0 involves a database upgrade that the system will handle itself. It may cause the upgrade to take several minutes.
If you currently have Enterprise configured to use the legacy vulnerability scanner, you will not be able to successfully upgrade and start the system without explicitly configuring the default vulnerability scanner.
You can remove that configuration variable so the system can default to the current vulnerability scanner.
If you choose not to upgrade, instead performing a new installation of Enterprise, the vulnerability scanner will be configured by default.
AnchoreCTL
The latest version of AnchoreCTL is 0.1.4.
AnchoreCTL is dependent on Syft v0.39.3 as a library.
The current features that are supported are as follows:
NEW! Source Repository Management: Generate an SBOM and store the SBOM in Anchore’s database. Get information about the source repository, investigate vulnerability packages by requesting vulnerabilities for a single analyzed source repository, or get any policy evaluations.
NEW! Download full image SBOMs for images analyzed with Enterprise 4.0.0.
Compliance Reports: View and operate on runtime compliance reports, such as STIGs, created by the rem tool.
Corrections Management: View and modify corrections information to help reduce false positives in your vulnerability results.
Image Management: View, list, import local analysis, and request image analysis by the system.
Runtime Inventory Management: Add, update, and view cluster configurations for Anchore to scan, as well as for the inventory reports themselves.
System Operations: View and manage system information for your Enterprise deployment.
13.1.53.23 - Anchore Enterprise Release Notes - Version 3.3.0
Anchore Enterprise 3.3.0
This release offers Rocky Linux support and various UI updates.
Version 3.3.0 also includes other improvements and fixes.
Rocky Linux support
Anchore Enterprise can now scan Rocky Linux images for vulnerabilities.
Configure maximum number of parallel workers
Asynchronous parts of the image deletion workflow in the backend can now be parallelized. You may now configure the maximum number of parallel workers in the catalog configuration.
Fixes
Images that had Go content and hints enabled were failing analysis. This has been fixed.
Images reported via runtime inventory that also had port numbers in the registry host URL were failing to parse properly, which caused scan failures. This issue has been fixed.
NuGet packages were not matched to vulnerabilities correctly. This is now fixed.
With the Grype provider, NVD and vendor CVSS scores were missing for records in non-NVD namespaces. This is now fixed.
Migration code was added to clean-up the unused feed records, and fixed artifacts and vulnerabilities records for the github:os group.
Known Issue
NVD CVSS scores may not be present in the API responses for the request to get a detailed information query about a vulnerability feed record.
There is a workaround to get this information. See the Workaround section below for more details on the workaround.
This is only present for a subset of records NVD records.
It does not impact the vulnerability reports or findings for images. It only impacts the next-gen vulnerability scanner, so users still on the legacy scanner are not impacted.
Details
The /query/vulnerabilities API response contains an nvd_data attribute for each vulnerability in the result. The value of the attribute represents the NVD assigned CVSS scores. This field is not correctly populating for a small subset of vulnerabilities in the system. Instead of a list of results, the value is a null reference as shown below.
Note: This known issue only affects vulnerabilities that exclusively belong in the nvd namespace with Grype as the vulnerabilities provider (next-gen v2 scanner). It does not affect the legacy vulnerability provider.
The API supports a namespace query parameter to filter results based on the namespace. Supply the namespace with an nvd value to view the NVD CVSS scores, as shown in the following example.
Multi-image selection and deletion now possible for RepositoryView.
The login page banner can now be edited. You can now edit the banner on the login page to provide customized information, such as how to log in, whether to use SSO or email addresses, and support contact information.
Failed images can now be removed from a repository.
The context of the policy bundle test results view is now preserved as a user changes to different tabs.
Fixes
JSON and CSV downloads from the Policy Compliance tab now include the policy bundle name and data.
Compliance tables now correctly filter based on column data.
Upgrading
Upgrading to Anchore Enterprise 3.3.0 involves a database upgrade that the system will handle itself. It may cause the upgrade to take several minutes.
AnchoreCTL
The latest version of AnchoreCTL is 0.1.3.
AnchoreCTL is dependent on Syft v0.20.0 as a library.
The current features that are supported are as follows:
Compliance Reports: View and operate on runtime compliance reports, such as STIGs, created by the rem tool.
Corrections Management: View and modify corrections information to help reduce false positives in your vulnerability results.
Image Management: View, list, import local analysis, and request image analysis by the system.
Runtime Inventory Management: Add, update, and view cluster configurations for Anchore to scan, as well as for the inventory reports themselves.
System Operations: View and manage system information for your Enterprise deployment.
13.1.53.24 - Anchore Enterprise Release Notes - Version 3.2.1
Anchore Enterprise 3.2.1
v3.2.1 is a patch release of Anchore Enterprise containing targeted fixes and improvements. No database upgrade is necessary.
Enterprise Service Changes
Fixes
Feed syncs no longer fail for GitHub groups.
Images failing analysis due to specific unexpected python package format issue fixed in Syft to ensure analysis can complete.
Content hints now correctly scan non-OS packages for vulnerabilities.
The Syft invocation during image analysis now uses the analyzer unpack directory consistent with other analysis data IO instead of the OS default temp directory.
Enterprise UI Changes
Fixes
Image Analysis: Vulnerabilities. RPM packages were displayed as RedHat packages in the Vulnerabilities tab, and they used the RedHat icon for SuSE images. The RPM icon is now used, and the package type is now simply described as RPM.
Image Analysis: Ancestry. Image ancestry fetch errors are now gracefully handled inline and do not block image analysis calls if they occur.
Image Selection: Add Image/Add Repository. Opening the Add Registry dialog from the Add Image or Add Repository dialogs would cause the tooltips on the initial dialogs to flicker if you attempted to view them after dismissing the Add Registry dialog. This is now fixed.
Kubernetes Inventory: Analyze Image. On initial presentation of the list of any images detected within a namespace, the buttons that allowed you to analyze new images would be disabled. This was due to an RBAC permission error. This issue is now fixed.
LDAP: Connectivity. LDAP authentication connection timeouts have now been externalized in order to allow customers to directly configure these thresholds, if necessary. These values can be set via the file- or environment-based Enterprise Client application configuration parameters.
Miscellaneous. Various supporting libraries have been updated to improve security, performance, and also to remove deprecation warnings from browser and server output logs. Redundant libraries have also been removed to reduce the app startup time and overall size.
Upgrading
No database upgrades are required for this update.
13.1.53.25 - Anchore Enterprise Release Notes - Version 3.2.0
Anchore Enterprise 3.2.0
This release brings the Next-Gen (v2) vulnerability scanner, based on Grype, from Tech Preview into full support and makes it the default for new Anchore Enterprise deployments.
Version 3.2.0 also includes other improvements and fixes.
New Features
Next-Gen scanner is now the default vulnerability scanner
Anchore Enterprise now uses the Next-Gen scanner, based on Grype, for vulnerability scanning. The new scanner replaces the legacy vulnerability scanner, but legacy remains available.
Only new installations will default to the new scanner. Upgrades for existing deployments will use the same scanner as the pre-upgrade deployment unless specifically configured to change.
SUSE Linux Enterprise Server (SLES) support
Anchore Enterprise can now scan SLES and OpenSUSE images for vulnerabilities.
Allow trigger IDs to be added to allow lists
To allow list a package and version rule, a mechanism to allow list items other than vulnerabilities has been added to the app.
Fixes
Dependency updates to resolve vulnerability findings.
Enterprise UI Changes
Added
New Secret Search content tab. Secret Search results are now available within the Image Analysis → Contents page. These artifacts are already calculated during analysis, but were not previously visible in the UI.
New Content Search content tab. Content Search results are now available within the Image Analysis → Contents page. These artifacts are already calculated during analysis, but were not previously visible in the UI.
New Retrieved Files content tab. Retrieved Files results are now available within the Image Analysis → Contents page. These artifacts are already calculated during analysis, but were not previously visible in the UI.
Add / Edit Registry Credentials feature now is accessible from the Account menu. Since the Registry Credentials are at the account level, they were moved from the System view to the top-right Account menu. It is also accessible from within the Analyze Repository / Tag modals.
View package metadata from the Vulnerabilities tab main table. As a SecOps user, you can now see more information about a package listed with a vulnerability in the Vulnerabilities tab main table. You can click the Package column entry to assess the impact, and determine if the vulnerability match may be a false positive.
Analyzing images can now be removed in bulk via the Analysis Cancellation / Repository Removal dropdown.
Content tab data is now cached. Content type tabs within the Image Analysis → Contents page are now lightly cached for performance.
Permit gates other than vulnerabilities to be added to an allowlist. This includes package version triggers, and more.
Descriptions can be added upon allowlisting a trigger from within the Image Analysis → Policy Compliance tab.
Fixes
View Reports tab now available for any user with listImages permissions.
Severities filter is now properly handled for scheduled Runtime Inventory Images by Vulnerability queries.
Table columns are automatically resized. When table column widths are greater than the total width of its container, they automatically resize to avoid overlap of text.
LDAP user mappings are now removed upon account deletion.
Miscellaneous: Various supporting libraries have been updated in order to improve security, performance, and also to remove deprecation warnings from browser and server output logs. Redundant libraries have been removed to reduce the app startup time and overall size.
Upgrading
With the new scanning engine there may be slightly different vulnerability results due to improved accuracy. It is highly
recommended for you to reach out and partner with Anchore Support for planning and managing the upgrade to ensure minimal
disruption for your workflows and workloads.
Upgrading to Anchore Enterprise 3.2.0 involves a database upgrade that the system will handle itself. It may cause the upgrade to take several minutes.
13.1.53.27 - Anchore Enterprise Release Notes - Version 3.1.0
Anchore Enterprise 3.1.0
This release adds new capabilities for automated runtime inventory scanning, runtime container compliance checks, a new
vulnerability scanner option in tech preview, a new enterprise CLI, as well as other improvements and fixes.
New Features
Runtime Kubernetes Inventory Scanning with UI Support
Building on the runtime inventory features in the 3.0 release, Anchore can now automatically analyze images reported as in
use in kubernetes clusters so that you can easily assess the security risks not only of image in your CI pipelines, but also
in production in your clusters. Additionally, the UI now supports visualizations of kubernetes inventories and the vulnerability
and policy compliance status of the inventory by namespace or cluster.
Anchore now includes the ability to execute and collect runtime compliance checks using industry standard tooling such as OpenSCAP to provide evaluation of running
containers’ STIG compliance or any other compliance specification that can be described and checked using XCCDF profiles.
The new anchorectl tool provides a new Enterprise-focused CLI experience with support for local analysis of images to import
into your deployment. Using the new tool you can also perform other Enterprise operations such as interacting with new compliance reports
and viewing or configuring inventory scanning.
Tech Preview Features
A new vulnerability scanner based on Grype is now available in tech preview. See Vulnerability Scanner V2 for more information.
This update is not configured by default and must be set by opt-in using a configuration value.
Enterprise Service Changes
This release contains a database schema update to version 0.0.8 for the enterprise schema and 0.0.15 for the engine schema.
The upgrade process will modify the db schema and update some tables in the reporting service for any existing runtime
inventory records. Unless you have a very large number of inventory records, the upgrade should complete in seconds to minutes depending
on your database size.
Owned Package Filtering Control
A new configuration option: services.analyzer.enable_owned_package_filtering: is now available in the analyzer service configuration.
By default, the analyzer will filter packages that are determined at analysis time to be “owned” by a parent package when that package
installs all the files of the child package. That behavior can be disabled by setting this configuration value to “false”.
The default filtering removes false positives associated with packages installed by distro packages that install language
packages like python, npms, or gems and have backports applied by the distro maintainer with no corresponding
language package version change. However, if you package your own applications as rpms, debs, or similar and need to
ensure all included packages are scanned directly against NVD sources, then you can disable this behavior.
Added
New tech-preview vulnerability scanner
Improved alpine vulnerability scanning by using NVD matches for OS packages for CVEs that are not yet present in Alpine SecDB
Analyzer service configuration option to control package-ownership filtering. Allows exposing all packages regardless of ownership relationship
Fixed
Adds missing fields and fixes errors in the swagger spec for the API
Restores file package verification data ingress during image load to fix a regression
Malware policy gate can fail causing policy eval error when malware not enabled and other rules precede malware rule in a policy
JSON serialization error in internal policy engine user image listing API
“package_cpe23” field missing in vulnerabilities
Ensure python38 used in the Dockerfile build, and set tox tests to only run py38
User to not be able to delete some notification configurations when they should be able based on RBAC role
Improved
Performance of GET operations between services improved by better streaming memory management for large payload transfers
Use UBI 8.4 as base image in Docker build
Updates skopeo version used to 1.2.1, allowing removal of the ’lookuptag’ field in the POST /repositories call for
watching repositories that do not have a ’latest’ tag
RedHat packages for an Out-of-Support distro release version now indicated as being vulnerable if a newer distro release version is supported and indicated as affected for the package.
Additional minor bug fixes and enhancements
Known Issues/Errata
Note: the policy engine feed sync configuration is now in the policy engine service configuration as part of the provider
configuration. The provided helm charts, docker-compose.yaml and default configurations handle this change automatically.
Deprecations
The affected_package_version query parameter in GET /query/vulnerabilities is not supported in the V2 scanner (aka Grype mode)
and has known correctness issues in the legacy mode. It is deprecated and will be removed in a future release.
Enterprise UI Changes
Added
From the new Kubernetes Runtime Inventory view you can now inspect
the spread of compliance and vulnerability information reported by
the KAI agent across all detected
Kubernetes clusters and namespaces in your deployment topology
Information relating to any items detected by the runtime agent is
now surfaced in the repository- and tag-level views within the Image
Selection hierarchy
Improved
If the reporting service fails, feature components that require this
service as a dependency will be disabled in the navigation bar until
service recovery
Pie-chart components have been restructured to present selected
information inclusively when segments are clicked—other segments
are now disabled
Fixes
Printable view assembly issues addressed in Image Analysis Vulnerability
and Compliance views—charts now render correctly in portrait mode
The alerts banner is now subject to RBAC and will not appear if the
fetch alert permission is not detected
Clipping issues resolved in the creation date popup in the Policy Bundle view
Supporting libraries have been updated in order to improve security,
performance, and also to remove deprecation warnings from browser
and server output logs
You can use the Anchore runtime compliance API to gain insight into the security compliance of runtime environments. Tools responsible for executing compliance checks on a running environment are the intended consumers of this general-purpose API, such as the Security Technical Implementation Guides (STIGs) that users can run on a Kubernetes cluster using Anchore’s Remote Execution Manager (REM). These tools can upload the results of an execution to Anchore through this new compliance API, which allows users to leverage additional Anchore functionality like reporting and correlating the runtime environment to images analyzed by Anchore. This enables deeper understanding and insight into an image’s lifecycle and the ongoing security of the runtime environments deploying them.
Usage
The Compliance API can be found in the Enterprise API swagger specification. This API allows for the creation and retrieval of runtime compliance checks and any document reports provided in the creation calls.
The following is an example of the body of an API call to create a runtime compliance check using the Compliance API to be submitted as a multipart form to support file upload:
{
"check_type": "oscap", // type of compliance check to report
"result": "pass", // overall result of compliance check
"pod": "postgres-9.6", // k8s or kubernetes pod the compliance check was run against
"namespace": "dev", // the namespace of the pod
"image_tag": "9.6", // tag of the image that the pod is running
"image_digest": "sha256:a435b8edc3bdb4d766818dc6ce22ca3a5e6a922d19ca7001afd1359d060500eb", // the digest of the running image
"start_time": "2021-03-22T15:12:24.580054", // start time of the compliance run
"end_time": "2021-03-22T16:02:24.580054"// end time of the compliance run
"result_file": "path_to_file",
"report_file": "path_to_file}
Two fields are required for the creation of runtime compliance checks. The type field references the type of scan that generates the report. The only supported option is oscap, which stands for OpenSCAP. The other required field is image_digest, which represents the image used by the container that the runtime compliance check was run against.
While not required, the status attribute is used to designate whether the given compliance check has passed or failed. There are several additional metadata fields provided to further contextualize the runtime check, such as the pod and namespace that the check was run against.
One of the other key functionalities of this API is the ability to attach a report_file and a result_file to the created runtime compliance checks. This can be the direct output generated by the runtime tool itself, such as an OpenSCAP XML document. This allows for entire reports to be stored within Anchore using the object storage, which allows for a number of options for how and where this data will be preserved.
Once created, runtime compliance checks can be retrieved using the GET endpoint specified in the Swagger spec. The corresponding result and report files can be retrieved by pulling the file_ids from a runtime compliance check and querying the endpoint for runtime compliance results using the specified result_id.
13.1.53.27.1.1 - REM
Remote Compliance Check
Anchore Enterprise Remote Execution Manager (REM) enables an operator to run a STIG compliance check for a defined container
within a Kubernetes Cluster. REM contains functionality to perform package management such as installation and removal
of OpenSCAP, retrieval of generated results files, and upload capabilities to the compliance API. There is also a provided
local data-store if upload functionality is disabled or unavailable.
REM can work well out-of-the-box with minimal required configurations.
At the very least, REM needs to be able to authenticate with the Kubernetes API, know which command to run, and know which
pod and container to connect to. If you have a Kube Config at ~/.kube/config, REM will use that by default.
It is always recommended to use the configuration file that is attached to each release as an artifact.
The example configuration file in the repository is a good reference for explaining which configuration key does what.
Pod configuration
This section will describe the minimum required configuration required for REM to work.
In the file, you can specify kubernetes pod information in the following section:
# This section tells REM the execution details for the STIG check report:# Pod Name, Namespace, and Container Name are required so that REM knows where to exec the stig checkreport:podName:"centos"nameSpace:"default"containerName:"centos"# These must be set via the file, and correspond to the command being executed in the container# For example, if your compliance check command looks like this:# oscap xccdf eval --profile <profile> --results /tmp/anchore/result.xml --report /tmp/anchore/report.html target.xml# The values should for --results and --report should match the values of these configurations.# The file paths defined here are also where REM downloads the files from the container. You can think of it like this:# docker cp container:/tmp/anchore/report.html /tmp/anchore/report.htmlreportFile:"/tmp/anchore/report.html"resultFile:"/tmp/anchore/result.xml"# REM supports Kubernetes Configuration in the following manner:# 1. If you have a Kubeconfig at ~/.kube/config, you don't need to set any of these fields below, REM will just use that# 2. If you want to explicitly specify kubernetes configuration details, you can do so in each field below (ignore path)# 3. If you are running REM within Kubernetes, set path to "use-in-cluster" and set cluster to the cluster name and you don't need to set any of the other fieldskubeconfig:path:""# set to "use-in-cluster" if running REM within a kubernetes containercluster:""clusterCert:# base64 encoded cluster certserver:# ex. https://kubernetes.docker.internal:6443user:type: # valid:[private_key, token]clientCert:# if type==private_key, base64 encoded client certprivateKey:# if type==private_key, base64 encoded private keytoken:# plaintext service account token
As an alternative, or a way to override the setting in the configuration file on the command line, you can pass a few flags to set new values.
Here, <cmd> is the full oscap command to execute within the container, and the args before the double hyphen '--' are telling REM where to run the command
$ rem kexec -n <namespace> -p <pod> -c <container> -k <kubeconfig-path-override> -- <cmd>
Example (this will use kubeconfig at ~/.kube/config)
$ rem kexec -n default -p anchore-pod -c anchore-container -- oscap xccdf eval --profile standard --result /tmp/result.xml --report /tmp/report.html target.xml
Note: The double hyphen -- is important because it tells REM that all subsequent flags should be passed to the container command
A full list of the options supported by the rem kexec command can be found by running the command with the -h or --help option
i.e.
rem kexec --help
Compliance Tool Installation
Enable the following section in the configuration file.
command:...oscap:# This boolean flag tells REM whether or not to try to install OpenSCAP into the container (if the command is oscap)installEnabled:true# This boolean flag tells REM whether or not to try to uninstall OpenSCAP from the container# (after the oscap command runs and the result/report files get downloaded)uninstallEnabled:true
After the installation option has been enabled this will allow the operator to manually install the compliance tool
or allow REM to automatically install the missing tool needed to run the compliance check.
note: uninstallEnabled can be set to false if you intend on leaving the tool available.
Running the following will install OpenSCAP but this is not mandatory.
> rem kexec install oscap
Run a compliance check
There are two options on how to run the check. The first is from the command line. The second method
is to have REM read it from the configuration file.
command:# If no command is specified through arguments passed to the application on the command line, this command will be used# Each element of the list is interpreted as part of the command# I.E. echo 'hello-world' > /tmp/test.txt would look like:# cmd:# - echo# - 'hello-world' > /tmp/tst.txtcmd:oscap xccdf eval --profile xccdf_org.ssgproject.content_profile_stig --fetch-remote-resources --results /tmp/anchore/result.xml --report /tmp/anchore/report.html /usr/share/xml/scap/ssg/content/ssg-rhel8-ds.xml
Once the check has completed the report and results file should be located in the set path passed into openSCAP.
Custom STIG targets
REM has the option to allow the operator to specify a custom target by setting a path under customTargetPath.
# If a custom OSCAP profile is desired, specify it's path here# Note: this will be placed into a /tmp/anchore/ directory in the container at runtime, so the command being executedcustomTargetPath:<local path to target>/custom.xml
Audit uploads
REM has an audit database which is used to track which compliance checks have been successfully run, this also
serves as a method to ensure fault tolerance in the case where reports have not been uploaded do to unavailable
service connections to Enterprise. REM will mark those uploads as incomplete allowing the operator to issue a flush
command and push the remainders to Enterprise.
Database subcommand
To list the current state for all past transactions issue the following command:
> rem db list
In order to retrieve detailed information about a transaction use the db get command with the id:
> rem db get 1
To push all results which have been marked as not uploaded, issue the follow command:
note: the –dryrun flag will show you the records which will be processed
A new vulnerability scanning engine, based on Grype improves performance, reduces
database load, and provides better vulnerability matching results. It includes a new vulnerability feed sync process
integrated into the enterprise feed service that also provides faster feed syncs from the feed service to the policy engine.
Tech Preview Status
Note: The v2 scanner is intended for use in sandbox or staging environments in the current release. It is not possible to
run both vulnerability scanners at the same time. This configuration is picked up at bootstrap, and cannot be changed
on a running system.
The new mode must be set at deployment time, the scanner is configured at service startup.
Switching modes in a deployment is not supported.
Downgrading from the v2 scanner back to the legacy scanner is not supported.
Some features of the policy system are not yet supported in this mode:
vulnerability gate triggers not supported for the new scanner. They will return incorrect results when used.
vulnerability_data_unavailable
stale_feed_data policy
Windows container scanning is not yet supported. Support will be added in the next feature release.
Proprietary vulnerability feeds are not yet supported in this scanner. Support will be added in the next feature release.
Running with docker compose
Install or update to Anchore Enterprise 3.1.0
Add the following environment variable to the policy engine container section of the docker compose file:
After making the relevant change above and redeploying, the system will start up with the v2 vulnerability scanner enabled and will
sync the latest version of grype db as built by your local feed service. Note that legacy feeds will no longer be synced while the v2 scanner is configured. All vulnerability data
and scanning will now come from the ‘grypedb’ feed.
Vulnerability Feed Data and Syncs
The v2 scanner has its own feed sync mechanism that generates a Grype vulnerability DB from your locally installed feed
service instead of https://ancho.re as used by Grype itself. This results in a much faster sync process since the DB is
packaged as a single database file. It also reduces load on the Engine DB since the scanner matching and syncs do not
require large amounts of writes into the Engine DB. The Grype vulnerability DB is built from the same sources as the
legacy service, so there is no reduction in scan coverage or vulnerabilities sources supported.
The feed synced by the Grype provider is identified as feed name ‘grypedb’ when using the feed listing API or anchore-cli system feeds list CLI command.
13.1.53.28 - Anchore Enterprise Release Notes - Version 3.1.1
Anchore Enterprise 3.1.1
v3.1.1 is a patch release of Anchore Enterprise containing targeted fixes and improvements. No database upgrade is necessary.
Enterprise Service Changes
Note: the Content Hints feature now only supports adding new packages to the analysis report and can no longer modify or update package records found
by the package analyzers. This is to ensure unintended conflicts do not occur.
Fixes
Some RPMs content in hints file causes analysis to fail
Feeds service driver for MSRC safely handles unexpected data from upstream
Feed service MSRC driver should not require a Microsoft API key
Ubuntu feed service driver git repo sync error
Github feed service driver incorrectly categorizes some data
Sometimes get error when trying to analyze image due to finding unsupported package types
Remove unused nvd scores from normalized vulnerability records
Alpine feeds driver to use CVSS v3 for severity scoring instead of CVSS v2
Events not generated correctly if an image digest has multiple tags
Ensure content hints do not conflict with findings from analyzers and only add entries and cannot modify existing analysis finings
SSL Error handling in swift objectstorage driver
Syft/Stereoscope cache in /tmp not cleaned up after image analysis
Adds will_not_fix field to vulnerability report API response
Adds will_not_fix field to /query/vulnerabilities response
Wrong tag may be used for image download during analysis if the digest is mapped to multiple tags
Dependency updates to resolve non-impacting vulnerability findings
Additional minor bug fixes and enhancements
Enterprise UI Changes
Fixes
Socket protocol now enforceable via configuration to avoid false positives with application scanners
Allow expiration of allowlist item to be set via Vulnerabilities table view in Image Analysis
Security vulnerability in package WS addressed
Add/Edit User & Add/Edit LDAP User Mapping modal content overflows issue fixed
Enable System button for users with correct requisite permissions
Users without correct permissions can no longer directly access app routes via URL
Default allowlist expiration now set to 30 days
Items with vulnerabilities inherited from base image can now be excluded by filter in Vulnerabilities view in Image Analysis
Users can now be prevented from accessing the app for a configurable amount of time after a configurable number of invalid login attempts
Improved internal field validation to prevent unexpected input in AppDB report routes
Additional minor bug fixes and enhancements
Upgrading
No database upgrades are required for this update.
AnchoreCTL
Updates vendor_only option to default to true for consistent experience with users coming from anchore-cli
13.1.53.29 - Anchore Enterprise Release Notes - Version 3.0.3
Anchore Enterprise 3.0.3
v3.0.3 is a patch release of Anchore Enterprise containing targeted fixes and improvements. No database upgrade is necessary.
Enterprise Service Changes
Fixes
Better vulnerability listing API call performance
Fixes regression in 3.0.0+ that made “hints” feature cause analysis errors of images for some package types
Large image analysis load failures from catalog to policy engine due to connection timeout. Makes timeout configurable.
Updates internal Syft to 0.15.1 to reduce java package CVE false positives and include CPE permutations that replace hyphens with underscores for better matching
Fixes Ubuntu feed mappings from name to version via configuration
Adds new debian releases for vulnerability feeds and makes new ones configurable without software upgrades
Enterprise UI Changes
Fixes
Adds package path to vulnerability listing table to differentiate findings packages in multiple locations
Report manager timezone string conversion error
The CSV report data for an image that is a descendant of a base image would not show the Inherited From Base column header in the output if the dataset contained items that were false
In the Print Report view for Vulnerabilities in Image Analysis, the appearance of the View Report button was obscuring the values held in the Vulnerability ID column
The Anchore Service Version (previously, Anchore Engine Version) in the About Anchore Enterprise Client modal will now update dynamically if the services are upgraded in the background
13.1.53.30 - Anchore Enterprise Release Notes - Version 3.0.2
Anchore Enterprise 3.0.2
v3.0.2 is a patch release of Anchore Enterprise containing targeted fixes and improvements. No database upgrade is necessary.
A flaw has been discovered in Anchore Enterprise versions 3.0.0 and 3.0.1 that partially effects java software detection and GHSA vulnerability matching. If a container image has java artifacts that are embedded within java artifacts (i.e. jars in jars), AND certain embedded java artifacts have certain forms of malformed metadata, Anchore analysis can fail to report on the top level java artifact and all artifacts embedded within. The fingerprint of this issue is apparent as the SBOM (content) reports from Anchore would show incomplete or missing java packages when compared to the same reports generated from Anchore Enterprise versions prior to 3.0.0. In addition, while Anchore Enterprise uses several vulnerability data feeds when performing matches against java artifacts, another flaw was discovered that prevented Anchore Enterprise from matching java artifacts with records from the GHSA data feed (other feeds, including NVD, Third-party, and OS feeds were still being consulted). The fingerprint for this issue would manifest as missing GHSA matches when compared to results from versions of Anchore Enterprise prior to 3.0.0. Both flaws have been addressed in Anchore Enterprise version 3.0.2.
Enterprise Service Changes
Fixes
Fixes issue where java artifacts are not being matched against records from GHSA feed - synthesize pom properties contents in syft mapper. See https://github.com/anchore/anchore-engine Issue #950
Updates syft to 0.14.0 to fix missing java elements from image SBOM, for embedded java artifacts combined with malformed pom.properties metadata. See https://github.com/anchore/syft Issue #349
Enterprise UI Changes
Fixes
Updates to the security model surrounding the stored data presented in the LDAP mapping management view.
Within System > Accounts, Role dropdowns are no longer truncated by the boundary of the user management dialog and will now display all entries without needing to scroll the list.
Various supporting libraries have been updated in order to improve security, performance, and also to remove deprecation warnings from browser and server output logs. Redundant libraries have been removed to reduce the app startup time and overall size.
13.1.53.31 - Anchore Enterprise Release Notes - Version 3.0.1
Anchore Enterprise 3.0.1
v3.0.1 is a patch release of Anchore Enterprise containing targeted fixes and improvements. No database upgrade is necessary.
Enterprise Service Changes
Adds
Adds new “inventory-agent” RBAC role with minimal permissions for use with KAI agents deployed in kubernetes clusters
Adds wildcard support for GraphQL query filters in reporting service
Fixes
Increases the TTL for kubernetes runtime inventory items to 120 days from 1 day after last being seen
Fixes RHEL/UBI images imported to engine using syft have different distro name that skips OS vuln checks by mapping them to the proper “rhel” namespace and adding support for “redhat” namespaces.
Fixes false positive vulnerabilities due to application packages (npm, python, etc) being installed via rpms, debs, or other distro packages. Filters those “owned” packages from analysis leaving the parent rpm/deb/apk for vulnerability matching.
Fixes SSO login not working after upgrade from 2.4.x to 3.0.0 with “invalid_client” error
Fixes analysis failures due to python package manifest format issues causing Syft errors
Fixes image ancestor lookup failures due to ancestor being deleted or not found
Fixes ubuntu feed driver failures during data fetch processing
Enterprise UI Changes
Fixes
Fixes bulk delete image count limitations during repo cleanup
Fixes potential SSO issues due to Redis connection errors
13.1.53.32 - Anchore Enterprise Release Notes - Version 3.0.0
Anchore Enterprise 3.0
This represents a significant update in Enterprise, requiring database upgrades and adds new components to the system including an optional deployable agent for gathering
runtime image inventory from Kubernetes clusters.
New Features
Runtime Kubernetes Inventory
Anchore now can receive inventory reports from a new agent that runs in the kubernetes cluster and reports which images are used in which namespaces. The new agent is KAI, and
it can run within your Anchore deployment or in another kubernetes cluster to return which images are in-use over time. This allows Anchore to show which
images are in use and facilitates focused triage and attention on in-use images to ensure you are addressing security findings in this most critical images first.
Anchore now provides fix suggestions for policy violations and a notification delivery mechanism so you can quickly and conveniently send notifications (email, Slack, MS Teams, Github, Jira, etc) to the image maintainer
so they can take corrective action for policy findings such as updating packages, modifying the Dockerfile, or rebuilding on a new base image.
The UI and API now present stateful alerts that will be raised for policy violations on tags to which you are subscribed for alerts. This raises a clear notification in the UI to help initiate the remediation
workflow and address the violations via the remediation feature. Once all findings are addressed the alert is closed, allowing an efficient workflow for users to bring their image’s into compliance with
their policy.
Improved Pipeline Scanning Integration
Anchore now has the ability to accept SBoM and image metadata from analysis run inside your CI/CD pipelines or local to developer machines and load it into the system for processing without requiring
images to be pushed to an image registry. This enables more efficient scanning inside the pipelines and less data transfer to decrease the overall time to result. Analysis results are provided by Syft which
is integrated into Anchore itself for SBoM generation of packages as well.
A new configurable maximum image size has been added to the system to enable administrators to ensure that very large images are not admitted into Anchore causing potential QoS or resource usage issues.
New capabilities in the analysis archive rules allow more efficient description of what to archive and what to exclude as well as the ability to set rules to limit the number of images in each account to help with capacity management.
These new capabilities include new selectors for exclusions to rules so that broader rules can be use to select candidates for archival and just exclusions set for specific images, tags, or repos.
See [Analysis Archive Rules]
Enterprise Service Changes
In Enterprise 3.0, the system now requires the deployment configuration to explicitly set a default admin password and will fail system initialization if one is not found in the configuration. This is automatically
configured for users of the helm chart and our Quickstart docker-compose.yaml, but if you have a custom deployment template and create a new deployment of Anchore, you must ensure that the default_admin_password field
is set in the config.yaml used by the catalog component.
Added
Adds ability to block large images based on configurable max size
Adds configurable image max size value to optionally limit size of images analyzed by system
Adds corrections API to support artifact metadata corrections for false positive management
Adds kubernetes inventory ingress API and agent to run in kubernetes clusters to track image inventory
Adds additional archive analysis rule exclusions to allow rules to be broader but have specific exclusions so that fewer rules can be used
Adds API to upload analysis SBoM generated by Syft and imported as image for remote analysis without Anchore retrieving the image content directly
Adds CPEs used for vulnerability matching against NVD and VulnDB data to the image content output itself for greater transparency in matching
Use Python 3.8 instead of Python 3.6
Update base image for containers to UBI 8.3 from UBI 8.2
Improved
Improved - Updated output messages and description for vulnerability_data_unavailable trigger and stale_feeds_data trigger to clarify only OS packages impacted.
Improved - Do not allow selectors to be empty unless using max_images_per_account_rule.
Improved - Updates Syft to version 0.12.4 to fix several issues in image analysis including empty package names/versions in invalid package.json files and java jar parent references being Nil.
Improved - Require user to set explicit default admin password at bootstrap instead of defaulting to a value if none found.
Improved - Update Authlib to 0.15.2 from 0.12.1
Improved - Update PyYAML to 5.4.1
Improved - Update Passlib to 1.7.4
Improved - Update to use Python 3.8
Improved - Update base image to UBI 8.3.
Fixes
Fixed - Failed analysis due to incorrect manifest mime types due to bug in buildah that caused incorrect content type to be in the manifest at build time.
Fixed - External API service swagger spec for GetRegistry response is inconsistent with actual returned JSON.
Fixed - Fixed analysis archive rules that did not fire if delete transition rule present.
Fixed - Force re-analysis of tag and digest rejected if create_at_override timestamp not provided.
Additional minor bug fixes and enhancements
Known Issues/Errata
False Positive Management feature incompatible with legacy Engine report/query routes
Using the GET /query/images_by_vulnerability endpoint for querying all images with a specific vulnerability using the legacy Engine API does not support the new False Positives management feature.
It is recommended to use the Enterprise Reporting Service GraphQL API to get the same information that does support the corrections.
Change to now require an explicitly set default admin password at system bootstrap may cause issues with some deployment templates
If your deployment template (chart, docker compose, etc) does not ensure that the config.yaml for services includes default_admin_password explicitly set to a value, the system will no longer
bootstrap with a built-in default. This does not affect our updated helm chart or quickstart docker-compose.yaml files, those have been updated appropriately.
Enterprise UI Changes
Added
New compliance landing page
Alerts view in dashboard
Alerts selection for repositories and tags
Remediation workflow and Actions Workbench
Kubernetes runtime inventory reports
“Last Seen” timestamp in image analysis to overlay runtime inventory in analysis view
13.1.53.33 - Anchore Enterprise Release Notes - Version 2.4.0
Anchore Enterprise 2.4.0
Features & changes of note:
Malware scanning capabilities
Image ancestry and comparison of an image’s policy and vulnerability findings with a base image
New analyzers for binaries not delivered in packages,
A “content hints” capability in the analyzers so developers or image builders can pass metadata to augmentation analysis results
UI improvements for scanning and deleting repositories with warnings for very large repositories
Asynchronous deletion of images
A new enterprise extension to the external API, available with base route: /v1/enterprise/
Malware Scanning
Anchore Enterprise now integrates ClamAV for optional (disabled by default) malware scanning of image content during the analysis phase and with policy rules to trigger on findings. This is particularly useful for using Engine to validate
external images in an image catalog or “golden repo” where you must guard against both vulnerable and malicious code from external sources.
Image Ancestry and Base Image Comparisons for Vulnerabilities and Policy Findings
Anchore now provides an API and UI enhancements to show an image’s base image as well as any images in its ancestry. Using this information, Anchore can now also show which
vulnerabilities and policy findings are inherited from an image’s base. This allows quicker triage, analysis, and remediation of image findings. See Base and Parent Images.
New Binary Content Type
A new binary analyzer will check for and inspect binaries that are often installed outside of package managers. This supports a common use-case of language or runtime-specific base images
such as Python and Go images where the runtime is installed via an archive and thus no package db entry exists. The analyzer supports specific binaries that it searches and can get metadata for: Go, Python, and BusyBox.
Once detected, these are checked for vulnerabilities, just like regular packages using the NVD and other non-OS vulnerability sources.
Content Hints
A new “hints” feature allows users to pass specific metadata into the analyzers to help identify and augment content that existing analyzers would not have been discovered. This feature is useful
if you have libraries statically compiled into another binary or installed outside of a package manager that you want to tell Anchore about so you can get vulnerability matches for and include them in the
image’s content manifests. This is accomplished with a specific JSON file present in the image: /anchore_hints.JSON. The entries are merged into the analyzer results to augment their findings for
different content types.
Image deletion is now an asynchronous operation and the image_status property in the image record now has possible states ‘active’ and ‘deleting’. Deletion of an image by API call will
transition the image record to a deleting status as indicated by the image_status property. Images in that state will be deleted by an asynchronous process on a duty cycle. This approach helps manage database
load under a high volume of delete operations and also makes the client-perceived response time much lower.
NOTE: Responses for GET /images and GET /summaries/imagetags do not include images in the deleting state by default, though new query parameters
allow those images to be returned in those calls if desired (image_status=deleting or image_status=all)
New API Extension for Enterprise
The engine API is updated to version 0.1.15
There is also a new enterprise extension to the API, available at /v1/enterprise/ that has its own version (0.1.0) and has calls specific to the Enterprise edition. These calls include
the new base-image comparison and ancestry API calls.
The swagger spec for this is available from the service using the route: /v1/enterprise/swagger.json
Enterprise Service Changes
Added
Changed image deletion to asynchronous behavior to make API more responsive and throttle db load during image deletes.
New dry-run mode for repository scan request to return list of tags that would be scanned without scanning or persisting the record.
Support for a “hints” JSON file in the image. JSON file to pass additional metadata to augment analyzer findings.
Adds API support for deleting multiple images in a single call.
Support for malware scanning using ClamAV and new ‘malware’ content type in API and policy gate to trigger on findings as well as scan not run. Disabled by default.
Support for content type ‘binary’ with analyzers to detect specific binaries: Python, Golang, Busybox not installed by package manager.
Query parameter filters for GET /images calls to filter by image_status and analysis_status.
Ability to indicate which vulnerability findings are inherited from the base image.
Ability to indicate which policy findings are inherited from the base image.
API call to return the ancestor images (parent and base images) for an image.
Improved
Change image analysis queue processing behavior to fair share across accounts.
Removes image_to_get property in GET body of /images route, since body in GET operations is not standard behavior.
Fixes
Handle scratch images correctly in files gate behavior.
Add missing fields in swagger JSON spec for GET /query/vulnerabilities.
Better handling of java packages missing certain metadata in MANIFEST.MF files.
Additional minor bug fixes and enhancements
Enterprise UI Changes
Added
New image count summaries to Image Analysis pages
Warning during “Analyze Repo” workflow if repo to be added has a lot of images, allowing users to cancel operation before the analysis is requested to avoid unintentional workload.
“Whats New” message on initial login and available in the “About Enterprise Client” selection from Account dropdown in top right of screen.
“Binary” content type in Image Contents tab
“Golang” content type in Image Contents tab
“Malware” content type in Image Contents tab
Ability to cancel all pending analyses from a single repository
Download for report preview data as JSON and CSV
Show image’s base image in Image Overview page
Shows which vulnerabilities are inherited from the base image in the Vulnerabilities view
Shows which policy findings are inherited from the base image in the Compliance view
Images can be deleted via the UI
Repository deletion (deletes all image analyses for that repository)
Improved
Order accounts by name in Associate Accounts pop-up
Analysis status is its own column to allow sorting by analysis status in repository view of tags
Adds total image counts to repository view, main page, and tag listing
Improved error handling in GraphQL responses for Reports
Custom control for relative time filters in reporting
Fixes
Some table cell truncations for image digests and other fields in the Image Analysis tab
Changelog showing entries when no change is apparent
Re-analysis of images that failed analysis
Version mismatch after container restart
Results shown after whitelisting an item with an inactive bundle
Built on Anchore Engine v0.8.1: Anchore Enterprise is built on top of the open-source Anchore Engine, which has received new features and updates as well See Anchore Engine Release Notes for information on new features, bug fixes, and improvements in Anchore Engine.
13.1.53.34 - Anchore Enterprise Release Notes - Version 2.4.1
Anchore Enterprise 2.4.1
v2.4.1 is a patch release of Anchore Enterprise containing targeted fixes and improvements. No database upgrade is necessary.
Enterprise Service Changes
Added
Ability to set pool_recycle and other SQLAlchemy engine parameters via config in db_engine_args section of config.yaml
Updates image build to support dynamic UID mapping in OpenShift
Fixes
RedHat CVE normalization in feed service did not ensure only one fix record per vulnerability in all cases
Orphaned feed service driver tasks left in ‘running’ when the system shuts down are now cleaned up on restart and marked as failed
Fixes small size limit of data scanned by ClamAV, adds default 4GB max size and configuration options to make it smaller. Errors if image is larger than that (ClamAV does no support larger sizes)
Report ClamAV malware findings that do not include a file path as ‘unknown’ rather than skipping
Policy engine should return HTTP 400 with instructive message on invalid bundle upload instead of HTTP 500
Vulnerability fix version not correct for vulnerabilities with multiple fixes
NPM and Gem packages not matching GHSA sources properly
Update urllib3 to 1.25.9 to address CVE-2020-26137 even though Anchore not affected by that issue
Deactivating or deleting repo subscription does not halt in-progress repository scans and can result in analysis being added after the subscription is removed
Additional minor bug fixes and enhancements
Enterprise UI Changes
Improved
Only show enabled feeds and groups via system health
Updates image build to support dynamic UID mapping in OpenShift
Fixes
Repositories with no watch subscription can cause UI errors during deletion
Lack of error message in case of creating/updating password with value that is too short to pass validation
Built on Anchore Engine v0.8.2: Anchore Enterprise is built on top of the open-source Anchore Engine, which has received new features and updates as well See Anchore Engine Release Notes for information on new features, bug fixes, and improvements in Anchore Engine.
13.1.53.35 - Anchore Enterprise Release Notes - Version 2.3.2
Anchore Enterprise 2.3.2
Adds features as well as bug fixes and improvements. Highlighted features are: new parameters in the Reporting service’s GraphQL API for specifying time ranges using a relative window (e.g last 30 days), and a new CVE blacklisting rule in the policy language to trigger if specific CVEs are found.
Improved
Improved - Adds retry wrapper on image download operations on analyzer. Implements #483
Improved - Updates serialize-javascript dependency to 4.0.0 to bring in fix for CVE-2020-7660 (Anchore unaffected)
Improved - Adds HEALTHCHECK to UI image
Improved - Removes npm installation from UI image to remove all the unused artifacts it brings in
Bug Fixes
Fix - Adds release to version string for all os package types if one is present. Fixes #504
Fix - Fixes global analysis archive rule application for non-admin accounts. Fixes #503
Fix - Fixes LDAP service tab fails if account mappings cannot be retrieved from service API
Fix - Fixes multiple vulnerability fix records from RHEL driver by collapsing to a single fix for correct semantics
Fix - Updates Alpine SecDB driver to use new source (https://secdb.alpinelinux.org) for data and new download process. Adds Alpine 3.12 support
Fix - Some db tables not created correctly for certain upgrade paths
Additional minor bug fixes and enhancements
Built on Anchore Engine v0.7.3: Anchore Enterprise is built on top of the OSS Anchore Engine, which has received new features and updates as well See Anchore Engine Release Notes for information on new features, bug fixes, and improvements in Anchore Engine
13.1.53.36 - Anchore Enterprise Release Notes - Version 2.3.0
This release focuses on enabling the Microsoft ecosystem within Anchore to allow the same analysis flow and pipelines that you use for linux images to be applied to Windows images
as well for a consistent approach across ecosystems. It also includes several enhancements to the reporting and event management features of the UI.
New Features
Windows Container Image Support
Analyze and get vulnerabilities for Windows OS-based containers. Anchore ingresses Microsoft vulnerability data via the MSRC
No requirement to run Anchore itself on windows or other changes to the infrastructure needed to deliver this feature
NuGet/.NET Package Support (Tech Preview)
Detection and inclusion in analysis output as well as vulnerability scans
GitHub Advisories vulnerability data
See Configuring GitHub advisories for information on configuring the new feed including creating a GitHub token the driver can use for API calls to GitHub.
Scheduled Reports
Create report templates for easy re-use of your most frequently used reports
Schedule reports for generation and get notifications when they are ready, delivered via Slack, email, webhooks, and the other supported notification integrations Enterprise provides.
Event Management in the UI
Improved sorting, filtering, and deletion of events in the UI directly
Improved RHEL/CentOS vulnerability matching using CVE-based feeds instead of RHSA-based data
To help provide early detection of vulnerabilities before a fix is available or for issues where a fix is not issued, Anchore now uses RedHat’s CVE information instead of RHSA information
This also provides improved whitelist consistency between RHEL/Centos and images based on other distros since CVEs are consistent
Improved feed data and configuration management via APIs and CLI
New APIs and CLI commands allow dynamic configuration of which feeds to sync and the ability to enable/disable and delete feed data without updating configuration files or restarting containers.
Built on Anchore Engine v0.7.1: Anchore Enterprise is built on top of the OSS Anchore Engine, which has received new features and updates in the 0.7 series. See Anchore Engine Release Notes for information on new features, bug fixes, and improvements in Anchore Engine for versions v0.7.0 and v0.7.1.
Changes
Starting in 2.3.0 all services except the UI in an Enterprise deployment must:
Have the license.yaml available in /license.yaml inside the image. This is currently how the Notifications, Reports, and RBAC services are run, and is now extended to all services.
Be started with the anchore-enterprise-manager command instead of anchore-manager. This ensures that enterprise extensions and functionality is properly loaded and available.
The docker-compose.yaml is no longer built into the image, but is available in the Docker Compose guide via a link to download. The image versions will be set to the release version matching the documentation version.
These changes are all configured by default in the new Docker Compose guide and are also enabled in the updated Helm chart for this release.
As with previous releases, we recommend upgrading with the newest deployment templates rather than just changing the image references in existing templates.
Bug Fixes and Enhancements
Fixed user deletion and role removal failures
Uses NVD severity for Debian vulnerabilities when ‘urgency’ field not set in the upstream data
Updates alpine feed driver to ensure severities are set using newer nvd2 driver data instead of older nvd driver that may have had stale data due to old NVD XML feed
Adds new ‘–no-auto-upgrade’ option to anchore-enterprise-manager to start services that will not upgrade the db automatically, enabling more control over the upgrade process
Fixed Report CSV/JSON download missing records in UI
Fixed scrollbar functionality issue in Policy Bundle editor in UI
Fixed missing scrollbar for context switching in UI
Fixed problem with sorting vulnerability columns in UI causing hangs and missing links
This is a significant upgrade. Backups should be taken, and downtime expected to complete the process.
NOTE The upgrade from 2.2.x to 2.3.0 will take several minutes at least for the database schema upgrade and involves a data migration can take longer to fully transition the RHSA data to CVE data. Part of this process is done during
the database upgrade, but part of the process can only complete after the upgraded feed service is able to run and sync the new RedHat CVE data. Because of this, there will be an interval where RHEL-based images
will have no vulnerabilities listed. That will automatically resolve itself once the feed syncs, and all affected images will have CVE-based vulnerability matches as expected, but depending on deployment environment and number
of images in the database, this may take a long time (hours potentially).
To upgrade, use the new version of the Helm chart or docker compose provided with this release. The new chart and compose files contain all needed configuration changes. See Enterprise Upgrade to 2.3.0 for details on this specific upgrade process and how to update your own deployment templates if you are not using the official Helm chart.
13.1.53.36.1 - RHSA to CVE Feed Changes for RHEL-Based Images
Starting in Enterprise 2.3.0, Anchore Enterprise uses the RedHat Security API for CVEs for vulnerability matches for RHEL, CentOS, and UBI images. This
is a change from previous releases that utilized the API for Advisories (RHSAs) instead.
What Changed
In short, rhel:* replaces centos:* in the vulnerability feed for matches against RHEL-based distros such as CentOS and UBI.
Specifically, in Enterprise 2.2.x, all RHEL-based images (CentOS, RHEL, UBI) used data from the RedHat Security Advisories API. This data populated
the centos:* groups of the vulnerabilities feed, as seen when you run anchore-cli system feeds list or via the UI’s system page showing feed syncs.
Changed for Enterprise 2.3.0, RHEL-based images will match against a new feed source by default: data from the RedHat CVE API .
This new source populates the rhel:* groups of the vulnerabilities feed. The centos:* groups are no longer used for matches by default.
Reason for Change
The CVE source provides the ability to match vulnerabilities that have not yet been fixed upstream or via backports by Redhat as well as information on
vulnerabilities that will not be fixed. Both of these classes of vulnerability are not covered in the RHSA data because that data is generated by fix
releases. Overall, the change gives better matches earlier in the vulnerability triage and fix process so you can make better decisions about issues
that affect your images.
Upgrade
During upgrade Anchore will change the matching logic to transition images to use the new feed groups. This update involves:
Completed Automatically During DB Upgrade:
Updating db schema to support new enable/disable flags for feeds and groups.
Disabling the existing centos:* feed groups from future syncs by setting the groups to disabled status.
Updating the internal mappings for distros to use the new groups.
When the system starts, all RHEL/CentOS/UBI images will still have RHSA matches, but the centos:* groups will be disabled so no new updates arrive for those groups.
After upgrade, when the system is running the new version:
Feed service will sync the new data from the source
Policy engine syncs from feed service to get new data
Once the rhel:* groups sync in the policy engine, all RHEL/CentOS/UBI pre-upgrade analyzed images will now show both CVE and RHSA matches.
Images analyzed after the upgrade will only match CVEs.
The output from a CLI feed listing should look roughly like (note the disabled centos groups and synced rhel groups:
You can optionally flush the old RHSA matches by using the anchore-cli to delete the centos group data, which will remove the both the feed data and vulnerability matches for the RHSAs, leaving only the CVE matches.
To accomplish this, via the cli run:
[anchore@c4799ee0b36e enterprise]$ anchore-cli system feeds delete vulnerabilities --group centos:5
Group LastSync RecordCount
centos:5(disabled) pending 0
[anchore@c4799ee0b36e enterprise]$ anchore-cli system feeds delete vulnerabilities --group centos:6
Group LastSync RecordCount
centos:6(disabled) pending 0
[anchore@c4799ee0b36e enterprise]$ anchore-cli system feeds delete vulnerabilities --group centos:7
Group LastSync RecordCount
centos:7(disabled) pending 0
[anchore@c4799ee0b36e enterprise]$ anchore-cli system feeds delete vulnerabilities --group centos:8
Group LastSync RecordCount
centos:8(disabled) pending 0
At this point all RHSA matches for all images in the DB have also been removed, leaving only the CVE matches from the new RedHat CVE source.
Feed Service Driver Configuration
The new RHEL CVE feed is enabled in the feed service by default. No changes to configuration are necessary to enable it.
Policy Engine Configuration
No changes to the policy engine configuration are needed to enable the new data because it is delivered as new groups in the existing vulnerabilities feed,
which syncs all groups automatically.
Rolling Back
If you need to restore the old behavior see the rollback guide
13.1.53.36.2 - Reverting Back to use RHSA Data
NOTE: This section is only for very specific situations where you absolutely must revert the matching system to use the RHSA data. This should not be done lightly. The newer CVE-based data is more accurate, specific, and provides a more consistent experience with other distros.
If your processing of anchore output relies on RHSA keys as vulnerability matches, or you have large RHSA-based whitelists that cannot be converted to CVE-based,
then it is possible, though not recommended, to migrate your system back to using the RHSA-based feeds (centos:* groups).
Here is the process. It requires the Anchore CLI with access to the API as well as direct access to the internal policy engine API endpoint. That may require a docker exec or kubectl exec call
to achieve and will be deployment/environment specific.
Revert the distro mapping records that map centos, fedora, and rhel to use the RHEL vuln data.
With API access to the policy engine directly (output omitted for brevity), remove the existing distro mappings to RHEL data. These are the used by Anchore:
Note: if something went wrong and you want to undo the progress you’ve made, just make the same set of calls as the last two steps in the same order but with the to_distro values set to ‘rhel’.
Now, ensure you are back where you have access to the main Anchore API and the Anchore CLI installed. Disable the existing rhel feed groups
anchore-cli system feeds config vulnerabilities --disable --group rhel:5
anchore-cli system feeds config vulnerabilities --disable --group rhel:6
anchore-cli system feeds config vulnerabilities --disable --group rhel:7
anchore-cli system feeds config vulnerabilities --disable --group rhel:8
anchore-cli system feeds delete vulnerabilities --group rhel:8
anchore-cli system feeds delete vulnerabilities --group rhel:7
anchore-cli system feeds delete vulnerabilities --group rhel:6
anchore-cli system feeds delete vulnerabilities --group rhel:5
Enable the centos feed groups that have the RHSA vulnerability data
anchore-cli system feeds config vulnerabilities --enable --group centos:8
anchore-cli system feeds config vulnerabilities --enable --group centos:7
anchore-cli system feeds config vulnerabilities --enable --group centos:6
anchore-cli system feeds config vulnerabilities --enable --group centos:5
NOTE: if you already have centos data in your feeds (verify with anchore-cli system feeds list) then you’ll need to delete the centos data groups as well
to ensure a clean re-syncin the next steps. This is accomplished with:
anchore-cli system feeds delete vulnerabilities --group centos:5
anchore-cli system feeds delete vulnerabilities --group centos:6
anchore-cli system feeds delete vulnerabilities --group centos:7
anchore-cli system feeds delete vulnerabilities --group centos:8
Now do a sync to re-match any images using rhel/centos to the RHSA data
[root@d64b49fe951c ~]# anchore-cli system feeds sync
WARNING: This operation should not normally need to be performed except when the anchore-engine operator is certain that it is required - the operation will take a long time (hours) to complete, and there may be an impact on anchore-engine performance during the re-sync/flush.
Really perform a manual feed data sync/flush? (y/N)y
Feed Group Status Records Updated Sync Duration
github github:composer success 0 0.28s
github github:gem success 0 0.34s
github github:java success 0 0.33s
github github:npm success 0 0.23s
github github:nuget success 0 0.23s
github github:python success 0 0.29s
nvdv2 nvdv2:cves success 0 60.59s
vulnerabilities alpine:3.10 success 0 0.27s
vulnerabilities alpine:3.11 success 0 0.31s
vulnerabilities alpine:3.3 success 0 0.31s
vulnerabilities alpine:3.4 success 0 0.25s
vulnerabilities alpine:3.5 success 0 0.26s
vulnerabilities alpine:3.6 success 0 0.25s
vulnerabilities alpine:3.7 success 0 0.26s
vulnerabilities alpine:3.8 success 0 0.35s
vulnerabilities alpine:3.9 success 0 0.28s
vulnerabilities amzn:2 success 0 0.26s
vulnerabilities centos:7 success 1003 34.91s
vulnerabilities centos:8 success 199 9.15s
vulnerabilities debian:10 success 2 0.50s
vulnerabilities debian:11 success 4 60.53s
vulnerabilities debian:7 success 0 0.30s
vulnerabilities debian:8 success 3 0.34s
vulnerabilities debian:9 success 2 0.38s
vulnerabilities debian:unstable success 4 0.39s
vulnerabilities ol:5 success 0 0.31s
vulnerabilities ol:6 success 0 0.29s
vulnerabilities ol:7 success 0 0.41s
vulnerabilities ol:8 success 0 0.28s
vulnerabilities rhel:5 success 0 0.28s
vulnerabilities rhel:6 success 0 0.43s
vulnerabilities ubuntu:12.04 success 0 0.45s
vulnerabilities ubuntu:12.10 success 0 0.25s
vulnerabilities ubuntu:13.04 success 0 0.24s
vulnerabilities ubuntu:14.04 success 0 0.37s
vulnerabilities ubuntu:14.10 success 0 0.25s
vulnerabilities ubuntu:15.04 success 0 0.42s
vulnerabilities ubuntu:15.10 success 0 0.23s
vulnerabilities ubuntu:16.04 success 0 0.35s
vulnerabilities ubuntu:16.10 success 0 0.33s
vulnerabilities ubuntu:17.04 success 0 0.33s
vulnerabilities ubuntu:17.10 success 0 0.31s
vulnerabilities ubuntu:18.04 success 0 0.42s
vulnerabilities ubuntu:18.10 success 0 0.37s
vulnerabilities ubuntu:19.04 success 0 0.45s
vulnerabilities ubuntu:19.10 success 0 0.32s
[root@d64b49fe951c ~]# anchore-cli image vuln centos os
Vulnerability ID Package Severity Fix CVE Refs Vulnerability URL Type Feed Group Package Path
RHSA-2020:0271 libarchive-3.3.2-7.el8 High 0:3.3.2-8.el8_1 CVE-2019-18408 https://access.redhat.com/errata/RHSA-2020:0271 rpm centos:8 pkgdb
RHSA-2020:0273 sqlite-libs-3.26.0-3.el8 High 0:3.26.0-4.el8_1 CVE-2019-13734 https://access.redhat.com/errata/RHSA-2020:0273 rpm centos:8 pkgdb
RHSA-2020:0575 systemd-239-18.el8_1.1 High 0:239-18.el8_1.4 https://access.redhat.com/errata/RHSA-2020:0575 rpm centos:8 pkgdb
RHSA-2020:0575 systemd-libs-239-18.el8_1.1 High 0:239-18.el8_1.4 https://access.redhat.com/errata/RHSA-2020:0575 rpm centos:8 pkgdb
RHSA-2020:0575 systemd-pam-239-18.el8_1.1 High 0:239-18.el8_1.4 https://access.redhat.com/errata/RHSA-2020:0575 rpm centos:8 pkgdb
RHSA-2020:0575 systemd-udev-239-18.el8_1.1 High 0:239-18.el8_1.4 https://access.redhat.com/errata/RHSA-2020:0575 rpm centos:8 pkgdb
Note in the last command output that the OS vulnerabilities are again showing ‘RHSA’ matches. The restoration to RHSA-based vuln data is complete.
13.1.53.37 - Anchore Enterprise Release Notes - Version 2.3.1
Anchore Enterprise 2.3.1
Adds features as well as bug fixes and improvements. Highlighted features are: new parameters in the Reporting service’s GraphQL API for specifying time ranges using a relative window (e.g last 30 days), and a new CVE blacklisting rule in the policy language to trigger if specific CVEs are found.
Added
Added - New reporting GraphQL parameters for relative time-windows on reports (e.g. last 30 days) as alternative to absolute date ranges for all queries with start/end parameters.
Added - CVE Blacklisting via new policy rule.
Added - New “licenses” field in API response for content (pkgs etc) that is an array type for easier parsing. Supplements existing “license” field that is a comma-delimited list in a single string.
Added - Configuration option to disable Repository Add feature in UI
Added - Support for custom links/content on UI login page
Improved
Improved - Update base docker image to UBI 8.2 from 8.1.
Improved - Faster rhel feed driver execution via parallelized data download
Improved - Renamed “Registries” to “Registry Credentials” for more clarity in UI
Improved - Ask user if they are sure they want to add a full repository of tags in UI to prevent accidental add of large numbers of tags in UI
Improved - Alphabetical ordering of account data in context list in UI
Improved - Ability to copy and paste full tag string in image analysis page in UI
Improved - Enable vulnerabilities tab even if image has no vulnerabilities in UI
Bug Fixes
Fix - Ability to whitelist VulnDB IDs in policy editor in UI
Fix - PDF generation from vulnerabilities fix to not be truncated in UI
Fix - Protect against LDAP service tab whitescreen based on service response in UI
Fix - Fixes previewing saved query with invalid filter value shows nothing in UI
Fix - Fix formatting error on compliance report in UI
Fix - Filter entry persists between tabs in UI
Fix - Fixes error viewing vulnerabilities for .NET Core images
Fix - Fixes payload handling for MS Teams integration for notifications.
Fix - Fixes rhel feeds driver to handle updates in upstream data properly
Fix - package_type parameter now handles GHSA matches correctly as non-os types.
Fix - Correctly finds java content in cases where file permissions prevent a read.
Fix - Updates pyyaml dependency to 5.3.1.
Fix - Updates several npm dependencies of the UI.
Fix - Fixes API documentation in swagger spec for registry digest-style POST /image call.
Fix - Fixes db upgrade failure during upgrades of deployments that still have the ’nvd’ data from the deprecated driver.
Additional minor bug fixes and enhancements
Built on Anchore Engine v0.7.2: Anchore Enterprise is built on top of the OSS Anchore Engine, which has received new features and updates as well See Anchore Engine Release Notes for information on new features, bug fixes, and improvements in Anchore Engine
13.1.53.38 - Anchore Enterprise Release Notes - Version 2.2.0
Anchore Enterprise 2.2.0
Building upon the Anchore Enterprise 2.0 release, Anchore Enterprise 2.2 adds major new features and architectural updates that extend integration / deployment options, security insights, and the evaluation power available to all users.
New Features
Integration with Github, Jira, Slack and Microsoft Teams: Anchore Enterprise Notifications is a new capability offered in version 2.2, bringing the ability to flexibly configure your Enterprise deployment to send proactive system, user, and workload level notification events to a variety of third party systems.
System Dashboard and Feed Sync Status: New system dashboard in the Enterprise GUI which makes it easier to review the status of your Anchore Enterprise deployment, troubleshoot issues and understand the roles of the various services.
Harbor Support: Anchore Enterprise 2.2 is fully supported by the latest release of the CNCF’s Harbor project (v1.10++) – an open source container and artifact registry.
Built on Anchore Engine v0.6: Anchore Enterprise is built on top of the OSS Anchore Engine, which has received new features and updates as well See Anchore Engine Release Notes for information on new features, bug fixes, and improvements in Anchore Engine
13.1.53.39 - Anchore Enterprise Release Notes - Version 2.1.0
Anchore Enterprise 2.1.0
Building upon the Anchore Enterprise 2.0 release, Anchore Enterprise 2.1 adds major new features and architectural updates that extend integration / deployment options, security insights, and the evaluation power available to all users.
New Features
GUI report enhancements: Leveraging Anchore Enterprise’s reporting service, there is a new set of configurable queries available within the Enterprise GUI Reports control. Users can now generate filtered reports (tabular HTML, JSON, or CSV) that contain image, security, and policy evaluation status for collections of images.
Single-Sign-On (SSO): Integration support for common SSO providers such as Okta, Keycloak, and other Enterprise IDP systems, in order to simplify, secure, and better control aspects of user management within Anchore Enterprise
Enhanced authentication methods: SAML / token-based authentication for API and other client integrations
Enhanced vulnerability data: Inclusion of third party vulnerability data feeds from Risk Based Security (VulnDB) for increased fidelity, accuracy, and live-ness of image vulnerability scanning results, available for all existing and new images analyzed by Anchore Enterprise
Policy Hub GUI: View, list and import pre-made security, compliance and best-practices policies hosted on the open and publicly available Anchore Policy Hub
Built on Anchore Engine v0.5: Anchore Enterprise is built on top of the OSS Anchore Engine, which has received new features and updates as well See Anchore Engine Release Notes for information on new features, bug fixes, and improvements in Anchore Engine
13.1.53.40 - Anchore Enterprise Release Notes - Version 2.0.0
Anchore Enterprise 2.0.0
Building on top of the existing Anchore Enterprise 1,2 release, Anchore Enterprise version 2.0 adds major new features and architectural updates. The overarching purpose of the new features and design of the 2.0 version of Anchore Enterprise is to directly address the challenges of continued growth and scale by extending the enterprise integration capabilities of Anchore, establishing an architecture that grows alongside our users’ demanding throughput and scale requirements, and offering even more insight into users’ container image environments through rich new APIs and reporting capabilities, all in addition to the rich set of enforcement capabilities included with Anchore Enterprise’s flexible policy engine.
New Features
GUI Dashboard: new configurable landing page for users of the Enterprise UI, presenting complex information summaries and metrics time series for deep insight into the collective status of your container image environment.
Enterprise Reporting Service: entirely new service that runs alongside existing Anchore Enterprise services that exposes the full corpus of container image information available to Anchore Engine via a flexible GraphQL interface
LDAP Integration: Anchore Enterprise can now be configured to integrate with your organization’s LDAP/AD identity management system, with flexible mappings of LDAP information to Anchore Enterprise’s RBAC account and user subsystem.
Red Hat Universal Base Image: all Anchore Enterprise container images have been re-platformed atop the recently announced Red Hat Universal Base Image, bringing more enterprise-grade software and support options to users deploying Anchore Enterprise in Red Hat environments.
Anchore Engine v0.4: Anchore Enterprise is built on top of the OSS Anchore Engine, which has received many new features and updates as well. See Anchore Engine Release Notes for information on new features, bug fixes, and improvements in Anchore Engine
Upgrading from Anchore Enterprise 1.2
If using the trial docker compose method, or the production Helm chart method of deploying Anchore Enterprise, upgrading from 1.2 to 2.0 follows the normal upgrade procedure for Anchore Enterprise. However, if you are deploying Anchore Enterprise manually or using another orchestration environment, there are new dependencies and considerations to take into account for deploying Enterprise 2.0. Please visit the upgrade section for more information.
This release upgrades Anchore Enterprise to 5.24.2 and includes significant infrastructure component updates along with critical bug fixes for disk expansion and image pulling.
For additional details on how to use the Cloud Image Manager, see the Cloud Image Manager.
This release upgrades Anchore Enterprise to 5.24 and includes significant infrastructure component updates along with critical bug fixes for disk expansion and image pulling.
For additional details on how to use the Cloud Image Manager, see the Cloud Image Manager.
Anchore Enterprise & Infrastructure Updates
Component
Version
Anchore Enterprise
5.24.0
PostgreSQL
16.11
Redis
1.29.4
Prometheus
3.8.0
Grafana
11.6.8
Postgres-exporter
0.18.1
Node-exporter
1.10.2
Fixes
Disk Expansion: Fixed an issue where incorrect disks were discovered during volume expansion, ensuring the correct data disk is identified and expanded
Disk Path: Corrected the path used for data disk operations
Image Pulling: Fixed a crash that could occur when pulling container images if the response text was missing, improving error handling during image downloads
Note: AnchoreCTL v6.0.x versions are compatible with Enterprise v6.0.x deployments.
AnchoreCTL v6.0.0
AnchoreCTL v6.0.0 adds a new anchorectl app command family for the Anchore Enterprise v6.0.0 SBOM Management platform, providing command-line management of Applications, Application Versions, Assets, Jobs, VEX annotations, policy results, and exports.
Improvements
Adds anchorectl app commands to list, get, add, update, and delete Applications.
Adds anchorectl app version commands to list, get, add, update, and delete Application Versions, and to list vulnerabilities for a version.
Adds anchorectl app version asset commands to list, get, update, and delete Assets, and anchorectl app version asset sbom get to download an Asset’s SBOM.
Adds anchorectl app version asset add container-image-remote to add a container image Asset using centralized (server-side) analysis, where Enterprise pulls and analyzes the image from the registry.
Adds anchorectl app version asset add container-image to analyze a container image and add it as an Asset using distributed (client-side) analysis. Pulls from a registry by default and supports --from docker, --from podman, and --from docker-archive:<path> sources for analyzing local images.
Adds anchorectl app version asset add sbom to import an existing SBOM file as an Asset.
Adds anchorectl app version asset add filesystem to generate an SBOM from a local directory and add it as an Asset.
Filesystem SBOM generation now supports --author and --supplier parameters and includes a generation timestamp in the SBOM document, improving SBOM quality scores for filesystem scans.
Adds anchorectl app job commands to list, get, and cancel jobs. The list command supports filtering by version, status, jobs owned by the calling user (--mine), and jobs created since a relative duration or absolute timestamp (--created-since).
Adds anchorectl app version policy commands: status get returns the policy evaluation status (pass/fail), policy name, and finding statistics; findings list returns paginated policy findings with gate, trigger, action, message, and affected asset count.
Adds anchorectl app version package list to list the aggregated package contents of an Application Version.
Adds anchorectl app version vex commands to list, get, add, update, and delete VEX (vulnerability annotation) records.
Adds anchorectl app version export commands to export an Application Version’s SBOM (CycloneDX or SPDX), VDR, VEX statements, vulnerabilities (CSV), package contents (CSV), and policy compliance findings (CSV). Each command creates an export job, waits for completion, and writes the result to stdout or a file.
The anchorectl system wait command can now also wait for the component-catalog service.
Fixes
Fixes an issue where anchorectl image add --from docker with STIG checks (--stig) failed the STIG evaluation when the local image had not been pushed to a registry and therefore had no assigned digest.
Fixes an issue where the generated SBOM for an image analyzed via distributed analysis was missing the os and architecture details in the source metadata.
Fixes an issue where anchorectl image add --platform did not pull the requested platform when the platform specifier included a variant (for example, linux/arm64/v8).
Fixes an issue where anchorectl image one-time-scan --dockerfile did not submit the supplied Dockerfile, so Dockerfile policy gates never triggered during the scan.
Deprecations
The legacy application commands, anchorectl application, are deprecated and hidden in favor of the new anchorectl app command family.
The legacy source commands, anchorectl source, are deprecated and hidden in favor of the new anchorectl app version asset add filesystem commands.
The anchorectl stig k8s commands are deprecated.
Removals
The anchorectl sbom add command has been removed. Use anchorectl app version asset add sbom to import SBOMs.
The Artifact Lifecycle Policy (ALP) rule type for imported SBOMs has been removed.
13.3.2 - AnchoreCTL Release Notes - Version 5.27.2
Note: AnchoreCTL v5.27.x versions are compatible with Enterprise v5.27.x deployments.
AnchoreCTL v5.27.2
Security
This is a security maintenance release. Various supporting libraries and dependencies have been updated to address security advisories, including an update of Syft from v1.42.2 to v1.42.4.
13.3.3 - AnchoreCTL Release Notes - Version 5.27.1
Note: AnchoreCTL v5.27.x versions are compatible with Enterprise v5.27.x deployments.
AnchoreCTL v5.27.1
Fixes
Fixes an issue where the anchorectl image vuln -o json-raw command output dropped multiple fields that are present in
the API swagger schema. The json-raw output now aligns directly with the API response, including the top-level
extended_support field, and the per-vulnerability field has been renamed from extendedSupport to extended_support
to match API convention.
Fixes an issue where anchorectl image add --from registry --platform pulled the wrong platform when the --platform
value included a variant suffix (for example, linux/arm64/v8). Variant-qualified platform values, as documented in
the --help text, are now honored correctly.
13.3.4 - AnchoreCTL Release Notes - Version 5.27.0
Note: AnchoreCTL v5.27.x versions are compatible with Enterprise v5.27.x deployments.
AnchoreCTL v5.27.0
Fixes
Fixes an issue where AnchoreCTL environment variables are not documented. Available environment variables are now included in the help output and documentation.
Fixes an issue where the anchorectl event list --help required the correct case when providing level values but the help text suggested uppercase.
The command can now accepts any case (e.g., info or Info or INFO).
13.3.5 - AnchoreCTL Release Notes - Version 5.26.0
Note: AnchoreCTL v5.26.x versions are compatible with Enterprise v5.26.x deployments.
AnchoreCTL v5.26.0
New Features
Adds HTML output format support for the anchorectl image one-time-scan, anchorectl image vuln, and
anchorectl image check commands, enabling browser-viewable vulnerability reports.
Adds --stig-tools-image and --stig-tools-binary-path flags to enable STIG checks on shell-less container images.
AnchoreCTL automatically extracts a tools binary (e.g., busybox) from a specified tools container image and mounts it
into the target container, removing the need to manually prepare shell-less images for STIG execution.
Fixes
Fixes an issue where stereoscope temporary directories are not cleaned up when a disk full failure occurs.
Fixes JSON output formatting for the anchorectl image one-time-scan -o json command. It also now provides the output
option of anchorectl image one-time-scan -o json-raw. The json-raw output option provides the unformatted JSON
output directly from the API, while the json output option provides a more human-readable formatted JSON output.
Fixes an issue where the anchorectl image one-time-scan command displays full policy evaluation details by default. Summary findings are now shown unless the --detail flag is provided, consistent with anchorectl image check.
Fixes an issue where anchorectl image add --from docker-archive fails to locate the saved tarball.
13.3.6 - AnchoreCTL Release Notes - Version 5.25.0
Note: AnchoreCTL v5.25.x versions are compatible with Enterprise v5.25.x deployments.
Added support for the new user-viewer RBAC role in Anchore Enterprise. See the RBAC documentation for more information.
During decentralized image analysis, AnchoreCTL is now capable of running content and secret search catalogers in parallel, significantly reducing the time it takes to complete the analysis. See the AnchoreCTL documentation for more information.
Fixes
Removed the unused HostedFeedURL config option.
Known Issues
Apple Silicon (M4/M5)/DinD (Docker-in-Docker): --from docker SBOM analysis failure
On macOS running on Apple Silicon (M4/M5) with Docker Desktop using VirtioFS or DinD environments, anchorectl image add --from docker may fail in some cases with unable to get local analyze SBOM: could not determine source due to lack of containerd support. This occurs when Docker pulls images in a format that does not produce a complete OCI layout on disk, which prevents AnchoreCTL from resolving the source for local analysis. This issue has not been observed on Intel-based Macs but may also occur in non-DinD environments where containerd is used as the underlying storage driver.
Workarounds:
For images that exist in a registry, remove the local copy and allow AnchoreCTL to pull the image directly:
For locally built images, disable Use containerd for pulling and storing images in Docker Desktop under Settings → General, restart Docker Desktop for the changes to take effect, then build the image and continue as normal.
A fix is planned for an upcoming release.
13.3.7 - AnchoreCTL Release Notes - Version 5.24.3
Note: AnchoreCTL v5.24.x versions are compatible with Enterprise v5.24.x deployments.
AnchoreCTL v5.24.3
Improvements
STIG Enhancements
Enhanced Docker image STIG workflows with improved container management. AnchoreCTL now ensures STIG containers are available and in running state before executing STIG checks.
Two execution options are available:
Option
Description
Default
anchore-keep-alive
Uses prepackaged binary to maintain the container’s running state during STIG execution
✓ Yes
Manual Override
Uses existing running container via --stig-container-manual-override flag
No
Default Behavior:
AnchoreCTL uses the anchore-keep-alive binary to maintain the container’s running state
Binary is prepackaged within AnchoreCTL and deploys automatically
Removes dependency on cat being present in the target image’s PATH
Use --stig-container-manual-override flag with a running container ID
Available in:
anchorectl image add --stig
anchorectl stig docker image execute
Bypasses automatic container creation and uses specified container directly
13.3.8 - AnchoreCTL Release Notes - Version 5.24.2
Note: AnchoreCTL v5.24.x versions are compatible with Enterprise v5.24.x deployments.
AnchoreCTL v5.24.2
Improvements
Support for STIG Waiver Files
A waiver file is a formal document granting an exception to a rule, requirement, or disqualification.
The following commands now support the --stig-waiver-file option to provide one or more STIG waiver file when performing STIG evaluations:
anchorectl image add
anchorectl stig docker image
anchorectl stig k8s container
13.3.9 - AnchoreCTL Release Notes - Version 5.24.1
Note: AnchoreCTL v5.24.x versions are compatible with Enterprise v5.24.x deployments.
AnchoreCTL v5.24.1
Fixes
Allow for an image that has a media type of application/vnd.docker.image.rootfs.diff.tar.zstd to be added and analyzed successfully.
13.3.10 - AnchoreCTL Release Notes - Version 5.24.0
Note: AnchoreCTL v5.24.x versions are compatible with Enterprise v5.24.x deployments.
AnchoreCTL v5.24.0
Fixes
The command anchorectl application artifact list now displays unknown for the description field when the artifact has not been analyzed yet.
Improve error handling of anchorectl airgap feed download command when the output directory was written by a version of AnchoreCTL 5.20.x or earlier.
The anchorectl airgap feed download command now uses the config variable ANCHORECTL_HTTP_TIMEOUT for the HTTP timeout when downloading feeds.
The anchorectl image one-time-scan command correctly supports the files gate with the suid_or_guid_set trigger.
13.3.11 - AnchoreCTL Release Notes - Version 5.23.0
Note: AnchoreCTL v5.23.x versions are compatible with Enterprise v5.23.x deployments.
AnchoreCTL v5.23.0
Improvements
One Time Scan
The command anchorectl image one-time-scan now provides additional policy compliance support for the following gates:
Distro
Dockerfile
Files
Image Metadata
Licenses
Packages
Password File
Retrieved Files
STIG Profiles
The STIG Profiles are now available from the Anchore Data Service. The change allows Anchore to update them as the need arises instead
of waiting for the next release cycle.
You will see a new dataset called stig_profiles_db after updating your deployment.
Air-gapped user will download and upload the STIG Profiles as part of the normal Air Gap Workflow.
The STIG Profiles will be retrieved from your enterprise deployment by AnchoreCTL using the same command, anchorectl stig write-profiles.
Please Note: the names of the downloaded profile files have changed slightly.
anchorectl image vulnerabilities now supports two new output options:
-o cyclonedx-xml
-o cyclonedx-json
anchorectl source add will now preserve the files section when uploading and downloading the SBOM from Anchore Enterprise.
Fixes
Addresses an issue running anchorectl system smoke-test run while specifying an ANCHORECTL_LOG_LEVEL.
Addresses an issue running anchorectl system smoke-test run while specifying a config file path using the -c flag.
Fixes an issue where the anchorectl image sbom command failed to retrieve the sbom when provided with the parent digest.
13.3.12 - AnchoreCTL Release Notes - Version 5.22.0
Note: AnchoreCTL v5.22.x versions are compatible with Enterprise v5.22.x deployments.
AnchoreCTL v5.22.0
v5.22.x Compatibility for Air-gapped Users
Air-gapped users of Anchore Enterprise 5.22.x need to ensure that they are using the same/supported version of AnchoreCTL with Anchore Enterprise for all airgap workflows, this is due to a dataset schema change for ClamAV Database (v2) which occurred in 5.22.0. Using an older version of AnchoreCTL will no longer provide the correct datasets.
Improvements
Vulnerability Annotation Status
Annotation Status has been added to the output of the anchorectl image vulnerabilities command.
The annotation status can be found in the table output as well as the json output.
The annotation UUID is included only in the json output.
The command also provides the ability to filter the returned vulnerabilities based on annotation status with the use of the --annotations flag.
PURL is now included in the image content and image vulnerability commands when asking for the json output and csv
output where available.
The image one-time-scan command now has a flag --extended-support to allow the caller to override the EUS system configuration.
STIG Profiles
STIG Profiles are available for download from the anchorectl stig write-profiles command. Additional license entitlements are required, please contact Anchore Customer Success for more information.
Updates to the previously supported profiles have been completed
ubi8
ubi9
ubuntu2204
ubuntu2402
New profiles are now supported
Apache Tomcat 9
Nginx
Please see the Anchore STIG documentation for more information.
ClamAV 1.4.x
Air Gap workflow commands of anchorectl airgap feed upload and anchorectl airgap feed download now work with the
new ClamAV v2 database.
Fixes
The docker image execute and image add --stig commands create a local docker container in order to complete the STIG
evaluation. These commands correctly remove the local docker container when execution has completed.
13.3.13 - AnchoreCTL Release Notes - Version 5.21.0
Note: AnchoreCTL v5.21.x versions are compatible with Enterprise v5.21.x deployments.
AnchoreCTL v5.21.0
v5.21.x Compatibility for Air-gapped Users
Air-gapped users of Anchore Enterprise 5.21.x need to ensure that they are using the same/supported version of AnchoreCTL with Anchore Enterprise for all airgap workflows, this is due to a dataset schema change for Vulnerability Database (GrypeDB v6) which occurred in 5.20.x. Using an older version of AnchoreCTL will no longer provide the correct datasets.
AnchoreCTL commands now have indications included in the output of the anchorectl image get and anchorectl image vulnerabilities commands when the -o json option is supplied.
Extended Support in the anchorectl image get output indicates that EUS was detected during image analysis.
Extended Support in the anchorectl image vulnerabilities output indicates that EUS data was used during the vulnerability scan.
Air-gagged workflow downloads will no longer list the CISA Known Exploitable Vulnerabilities (KEV) Database and Exploit Prediction Scoring System (EPSS) Database as
separate downloads, as this data is now included in the primary Vulnerability Database.
Note that if you supply an existing file created from a prior version of anchorectl you will see an error, you should start with a new file.
These datasets continue to be required:
Vulnerability Database
Vulnerability Match Exclusions Database
ClamAV malware Database
KEV and EPPS data has been added to the output of the anchorectl image vulnerabilities command.
The KEV indicator can be found in the table output as well as the json output.
The EPSS data is included only in the json output.
STIG
The anchorectl image stig commands have been deprecated in favour of the new anchorectl stig docker image commands.
Resolves an issue with filenames in the output of the anchorectl airgap feed upload command which caused errors on NTFS filesystems.
Resolves an issue with the handling of the –enabled flag in the anchorectl system artifact-lifecycle-policy add and anchorectl system artifact-lifecycle-policy update commands.
Resolves an issue with the value of the Last Updated field in the output of the anchorectl registry update command not being populated correctly.
The Ubuntu 2004 STIG profile has been removed.
13.3.14 - AnchoreCTL Release Notes - Version 5.20.0
Note: AnchoreCTL v5.20.x versions are compatible with Enterprise v5.20.x deployments.
AnchoreCTL v5.20.0
v5.20.x Compatibility for Air-gapped Users
Air-gapped users of Anchore Enterprise 5.20.x need to ensure that they are using the same/supported version of AnchoreCTL with Anchore Enterprise for all airgap workflows, this is due to a new dataset format for vulnerability data (GrypeDB v6). Using an older version of AnchoreCTL will no longer provide the correct datasets. It is important to immediately upload the new dataset upon upgrade.
Improvements
airgap feed download command supports the --retries flag to allow users to specify the number of retries for
downloading the feed data. This is useful in environments with intermittent network issues.
airgap feed download command provides better error messages when the download fails due to system issues such as
insufficient disk space or permission issues.
airgap feed download command provides supports for environment variables
Your api key via the ANCHORECTL_API_KEY environment variable
Your license file via the ANCHORECTL_LICENSE_FILE environment variable
Various package updates to improve security and performance.
Fixes
When attempting to execute image add command from within a Windows environment, the command will now display a
proper error message when the image download fails.
Fixes the feed sync command when the --force_sync flag is used. It will now properly force a sync of the feeds.
13.3.15 - AnchoreCTL Release Notes - Version 5.19.1
Note: AnchoreCTL v5.19.x versions are compatible with Enterprise v5.19.x deployments.
AnchoreCTL v5.19.1
Fixes
Addresses a STIG runtime error seen when generating a STIG evaluation using the Ubuntu profiles.
Addresses an issue where the anchorectl image stig write-profiles command is failing due to a TLS certificate verification error.
13.3.16 - AnchoreCTL Release Notes - Version 5.19.0
Note: AnchoreCTL v5.19.x versions are compatible with Enterprise v5.19.x deployments.
AnchoreCTL v5.19.0
Improvements
Anchore STIG - Anchore now has support for running STIG evaluations against container images.
The feature provides the ability to download STIG profiles, generate STIG evaluations and upload them to your
Anchore Enterprise deployment. This feature requires the cinc-auditor tool to be installed on the system where
anchorectl is being run. This feature is available through a new entitlement called Static STIG AddOn.
The following new commands and command updates are added in support of this workflow:
New command anchorectl image stig write-profiles <path to write profiles> [--include-experimental] allows users
to download the Anchore STIG profiles and write them to a specified directory. This command also allows users to
download experimental profiles that are not yet formally supported.
New command anchorectl image stig run <image reference> <-p path to profile file> generates and uploads a STIG
evaluation to Anchore Enterprise.
New command anchorectl image stig list <image digest> returns the metadata for all STIG evaluations uploaded to
Anchore Enterprise for the specified image digest.
New command anchorectl image stig delete <image digest> <stig evaluation uuid> deletes a STIG evaluation for
the specified image digest and STIG evaluation UUID.
New command anchorectl image stig add <image digest> <path to stig evaluation> uploads a STIG evaluation for
the specified image digest.
New command anchorectl image stig download <image digest> <stig evaluation uuid> downloads a STIG evaluation for
the specified image digest and STIG evaluation UUID.
Updated command anchorectl image add to support the --stig and --stig-profile flags to allow users to
generate and upload a STIG evaluation during the image add workflow.
For more detail on this feature, please see the Anchore STIG documentation.
Anchore One Time Scan - A stateless scan feature that allows users to scan images without persisting the data in the Anchore Enterprise deployment.
New command anchorectl image one-time-scan <pull string> allows users to submit an image for a one time scan.
The command will return the policy evaluation summary and vulnerabilities found in the image. If provided with a
destination directory, the command will output three documents in the specified directory:
SBOM
policy evaluation
vulnerability list
The policy evaluation will be performed against the active policy bundle in the account provided with the Secure Module Gates of
vulnerabilities and secret_scans.
The anchorectl system integration list command has been updated to include the name of each integration.
Various package updates to improve security and performance.
Fixes
When running anchorectl airgap feed download with debug logging enabled, the command will no longer print any tokens.
13.3.17 - AnchoreCTL Release Notes - Version 5.18.0
Note: AnchoreCTL v5.18.x versions are compatible with Enterprise v5.18.x deployments.
AnchoreCTL v5.18.0
Improvements
The command anchorectl image sbom <digest> -o cyclonedx-json now supports an additional flag -x which will remove
file entries in the SBOM. This flag is only available for the CycloneDX output format.
Various package updates to improve security and performance.
Fixes
The image add command now correctly handles the case when the user specifies --from <source> and the
name of the source is also a local file or directory name.
13.3.18 - AnchoreCTL Release Notes - Version 5.17.0
Note: AnchoreCTL v5.17.x versions are compatible with Enterprise v5.17.x deployments.
AnchoreCTL v5.17.0
Improvements
Various package updates to improve security and performance.
Fixes
When using distributed analysis, AnchoreCTL will correctly identify RHEL-based images that contain only a /etc/redhat-release file.
13.3.19 - AnchoreCTL Release Notes - Version 5.16.0
Note: AnchoreCTL v5.16.x versions are compatible with Enterprise v5.16.x deployments.
AnchoreCTL v5.16.0
Improvements
Various package updates to improve security and performance.
Fixes
Fixes a failure to download an SBOM added via distributed analysis in the SPDX or CycloneDX format.
13.3.20 - AnchoreCTL Release Notes - Version 5.15.1
Note: AnchoreCTL v5.15.x versions are compatible with Enterprise v5.15.x deployments.
AnchoreCTL v5.15.1
Fixes
Fixes image command failures that occurred when your account has images larger than 4GB
anchorectl image list
anchorectl image get
anchorectl image content
13.3.21 - AnchoreCTL Release Notes - Version 5.15.0
Note: AnchoreCTL v5.15.x versions are compatible with Enterprise v5.15.x deployments.
AnchoreCTL v5.15.0
Improvements
New Command anchorectl auth set-password provides a user the ability to set their own password.
Various package updates to improve security and performance.
Fixes
The parent digest is now correctly represented for fat manifests when using the command anchorectl image add <repo:tag> --from registry.
13.3.22 - AnchoreCTL Release Notes - Version 5.14.0
Note: AnchoreCTL v5.14.x versions are compatible with Enterprise v5.14.x deployments.
AnchoreCTL v5.14.0
Improvements
Commands will now return the usage string when an invalid command is entered.
Command anchorectl images vuln <image> -o json-raw is now available to output raw JSON data for vulnerabilities.
Commands which display archive rules with the “Exclude Last Seen” option set will now display this value.
anchorectl archive rule add
anchorectl archive rule list
anchorectl archive rule get <rule id>
Improved the help text for command anchorectl image check to clarify when the --tag option is required.
New command to help delete inactive system integration health data.
anchorectl system integration health delete <uuid>
Command anchorectl system smoke-tests run now supports --image flag so the user can specify their own image to use for the test. This is helpful for users in air-gapped environments.
Fixes
The command anchorectl airgap feed upload is now functioning properly when executed on a Windows system.
13.3.23 - AnchoreCTL Release Notes - Version 5.13.0
Note: AnchoreCTL v5.13.x versions are compatible with Enterprise v5.13.x deployments.
AnchoreCTL v5.13.0
Improvements
Updated to use Syft v1.17.0
13.3.24 - AnchoreCTL Release Notes - Version 5.12.0
Note: AnchoreCTL v5.12.x versions are compatible with Enterprise v5.12.x deployments.
AnchoreCTL v5.12.0
Improvements
The command anchorectl user add now supports all RBAC Roles.
The command anchorectl usergroup role add now supports all RBAC Roles except the account-view which is restricted from addition into an usergroup.
Provide better error messages when downloading datasets or uploading datasets to Anchore Enterprise while in air-gapped environments.
The air gapped workflow has been improved to download and upload the EPSS dataset.
13.3.25 - AnchoreCTL Release Notes - Version 5.11.0
Note: AnchoreCTL v5.11.x versions are compatible with Enterprise v5.11.x deployments.
AnchoreCTL v5.11.0
Improvements
With the addition of integration health updates in Enterprise v5.11.0, the following command will provide you
data on the health of the integration and Anchore Enterprise:
New command anchorectl system integration list to list all the integrations registered with the system.
New command anchorectl system integration get <UUID> to get the details of a specific integration.
Fixes
The event list command can now support filtering events by the resource-id of the event.
Example: anchorectl event list --resource-id grypedb
The anchorectl system smoke-tests command now correctly returns a non-zero exit code when a test fails. The test has also been updated to use an image with known vulnerabilities.
13.3.26 - AnchoreCTL Release Notes - Version 5.10.1
Note: AnchoreCTL v5.10.x versions are compatible with Enterprise v5.10.x deployments.
AnchoreCTL v5.10.1
Fixes the command anchorectl system smoke-tests run
13.3.27 - AnchoreCTL Release Notes - Version 5.10.0
Note: AnchoreCTL v5.10.x versions are compatible with Enterprise v5.10.x deployments.
AnchoreCTL v5.10.0
AnchoreCTL has been updated to support the new Data Syncer service. AnchoreCTL has been enhanced to handle Air Gapped imports of datasets with the data syncer service.
Updated Commands:
anchorectl feeds list: List all available feeds, this list now includes other datasets like CISA KEV and ClamAV Malware signatures.
anchorectl feeds sync: Sync all feeds, this command will sync all available feeds.
New Commands
anchorectl airgap feed download: Download all feeds for air-gapped environments.
anchorectl airgap feed upload: Import the downloaded feeds into Enterprise.
13.3.28 - AnchoreCTL Release Notes - Version 5.9.1
Note: AnchoreCTL v5.9.x versions are compatible with Enterprise v5.9.x deployments.
AnchoreCTL v5.9.1
Fixes the command anchorectl system smoke-tests run
13.3.29 - AnchoreCTL Release Notes - Version 5.9.0
Note: AnchoreCTL v5.9.x versions are compatible with Enterprise v5.9.x deployments.
AnchoreCTL v5.9.0
A feature and bug fix release which includes:
The command anchorectl repo add <repo name> now supports the --exclude-existing-tags flag. When set, this flag will exclude tags that are already present in the repository. Only newly created tags will be added to the Enterprise system.
Various supporting libraries have been updated in order to improve security.
13.3.30 - AnchoreCTL Release Notes - Version 5.8.1
Note: AnchoreCTL v5.8.x versions are compatible with Enterprise v5.8.x deployments.
AnchoreCTL v5.8.1
Various supporting libraries have been updated in order to improve security.
13.3.31 - AnchoreCTL Release Notes - Version 5.8.0
Note: AnchoreCTL v5.8.x versions are compatible with Enterprise v5.8.x deployments.
AnchoreCTL v5.8.0
A feature and bug fix release which includes:
Improves an error message when deleting images without a force flag.
Fixed an issue that prevented images from being analyzed when the cataloger scope was set to Scoped or AllLayers.
Various supporting libraries have been updated in order to improve security.
13.3.32 - AnchoreCTL Release Notes - Version 5.7.0
Note: AnchoreCTL v5.7.x versions are compatible with Enterprise v5.7.x deployments.
AnchoreCTL v5.7.0
A feature and bug fix release which includes:
Cataloger scope specified from the configuration file is now respected during the image content command.
Improvements to golang release version extraction from go binary ldflags.
Various supporting libraries have been updated in order to improve security.
13.3.33 - AnchoreCTL Release Notes - Version 5.6.0
Note: AnchoreCTL v5.6.x versions are compatible with Enterprise v5.6.x deployments.
AnchoreCTL v5.6.2
A maintenance release which includes:
Updates to the Syft version of v1.5.0
AnchoreCTL v5.6.1
A bug fix release which includes:
Fails the creation of a user within the admin account when an RBAC Role is specified. If the user is not being created in the admin account, the default RBAC Role is read-write unless otherwise specified.
AnchoreCTL v5.6.0
A feature and bug fix release which includes:
The addition of a system smoke-tests run command. This can be used as a tool to aid the assessment of the health of your Anchore
Enterprise deployment by executing a few basic operations.
The command requires the caller to have admin credentials.
The command does not have the ability to assess the health of the feed service, the report service, or the notification service.
The command feed list now includes the Last Updated column which is the last successful update time of the specific feed groups.
Updates the system artifact-lifecycle-policy commands to expose a new policy condition which allows for the preservation of base images.
Improved an error message during creation of a user within the admin account when an RBAC Role is specified.
Various supporting libraries have been updated in order to improve security.
13.3.34 - AnchoreCTL Release Notes - Version 5.5.0
The latest version of AnchoreCTL is 5.5.0.
Note: AnchoreCTL v5.5.x versions are compatible with Anchore Enterprise v5.5.x deployments.
AnchoreCTL v5.5.0 is a maintenance release
Various supporting libraries have been updated in order to improve security
13.3.35 - AnchoreCTL Release Notes - Version 5.4.0
The latest version of AnchoreCTL is 5.4.0.
Note: AnchoreCTL v5.4.x versions are compatible with Anchore Enterprise v5.4.x deployments.
AnchoreCTL v5.4.0 is a feature and bug fix release which includes:
RBAC Role Support
Addition of the following commands that are accessible by users with admin, account-user-admin, or full-control.
anchorectl system role list - returns the list of supported RBAC Roles.
anchorectl system role get <rbac role name> - returns description and list of permissions of the specified role.
User Group Support
Commands for the management of User Groups
anchorectl usergroup add <usergroup name or uuid> [--description <string>]
anchorectl usergroup delete <usergroup name or uuid>
anchorectl usergroup role add <usergroup name> <account name> --role <rbac role name>
anchorectl usergroup role delete <usergroup name> <account name> --role <rbac role name>
anchorectl usergroup role list <usergroup name>
anchorectl usergroup user add <usergroup name> --user <username>
anchorectl usergroup user delete <usergroup name> --user <username>
anchorectl usergroup user list <usergroup name>
anchorectl system wait command now defaults to waiting only on the Enterprise API Service. The –services flag can be used to specify other services that should be waited on as well.
Return the image content even when the parent digest is being used for the request. This was seen in a error in anchorectl image content.
Various supporting libraries have been updated in order to improve security
13.3.36 - AnchoreCTL Release Notes - Version 5.3.0
The latest version of AnchoreCTL is 5.3.0.
Note: AnchoreCTL v5.3.x versions are compatible with Anchore Enterprise v5.3.x deployments.
AnchoreCTL v5.3.0 is a feature and bug fix release which includes:
Enable the dotnet-deps-cataloger for image analysis
Various supporting libraries have been updated in order to improve security
13.3.37 - AnchoreCTL Release Notes - Version 5.2.0
The latest version of AnchoreCTL is 5.2.0.
Note: AnchoreCTL v5.2.x versions are compatible with Anchore Enterprise v5.2.x deployments.
AnchoreCTL v5.2.0 is a feature and bug fix release which includes:
Adds the ability to delete runtime inventory with inventory delete.
Adds the ability for admins to edit the email field of accounts with account update.
Addresses an exception in the system artifact-lifecycle-policy update command when the policy uuid was not provided.
Adds a new field, password_last_updated, to the response of user list and user get commands.
image content command correctly displays the licenses property in the response.
image vuln command provides an optional flag, --include-description, that is available with the json output format. Using this flag will include the description for each vulnerability listed.
13.3.38 - AnchoreCTL Release Notes - Version 5.1.0
The latest version of AnchoreCTL is 5.1.0.
AnchoreCTL 5.1.0 is a feature and bug fix release which includes:
Removes errant ‘status’ string at beginning of anchorectl image check <img> --detail output which caused invalid json.
Updates Syft version to v0.97.1 aligned with Enterprise 5.1.0
AnchoreCTL 5.1.x versions are compatible with Anchore Enterprise 5.1.X deployments.
13.3.39 - AnchoreCTL Release Notes - Version 5.0.1
The latest version of AnchoreCTL is 5.0.1.
AnchoreCTL 5.0.1 is a bug fix release which includes:
A fix for a stack overflow that can be seen when executing the command anchorectl image check <image> --detail. This can occur when the image has an allowlisted policy finding.
AnchoreCTL 5.0.x versions are compatible with Anchore Enterprise 5.0.X deployments.
13.3.40 - AnchoreCTL Release Notes - Version 5.0.0
The latest version of AnchoreCTL is 5.0.0.
NOTE: This version of AnchoreCTL only supports Anchore Enterprise 5.0.x
AnchoreCTL 5.0.0 is a feature and bug fix release which includes:
Dependency updates, and general client updates to support Anchore Enterprise v5.0.0
Change to version scheme, switching to keep version of AnchoreCTL inline with the version of Anchore Enterprise that the client supports (by semver compatibility)
Add sub-command for policy update
Add single java version column to the table output for java content
Remove rbac-url requirement from configuration in support of Anchore Enterprise v5.0.0’s single API feature
Remove the fix_observed_at date from table output for image vulnerability operation
Update the inventory watch commands
Update source policy check output to be more inline with image policy check output
Fix to some cases where the command could hang or terminal could get scrambled
Update to Syft 0.90.0, inline with the version of Syft used in Anchore Enterprise 5.0.0
AnchoreCTL 5.0.x versions are compatible with Anchore Enterprise 5.0.X deployments.
13.3.41 - End-of-Life Releases
13.3.41.1 - AnchoreCTL Release Notes - Version 4.9.0
AnchoreCTL 4.9.0 is a V2 API-compatibility release that is otherwise identical to 1.8.0.
Warning
AnchoreCTL 4.9.0 is compatible Enterprise 4.9.x ONLY and requires the V2 API.
To minimize impact to automated installations, the V2 API compatible AnchoreCTL will not be automatically upgraded using
the install script. See Installation for more information.
AnchoreCTL v4.9.0 uses Syft 0.84.1, the same as AnchoreCTL v1.8.0
AnchoreCTL 4.9.x versions are compatible with Anchore Enterprise 4.9.X deployments.
13.3.41.2 - AnchoreCTL Release Notes - Version 1.8.0
The latest version of AnchoreCTL is 1.8.0.
AnchoreCTL 1.8.0 is a feature and bug fix release which includes:
Adds the ability to create explicit SAML users with user add --idp_name
Adds the ability to list, activate and deactivate runtime inventory watchers with inventory watch
Extends image content command to support the type content_search
Extends image content command to support the type retrieved_files
Extends image content command to support the type secret_search
Adds the ability to specify the image platform to retrieve and analyze when using the --from registry source in the image add command so that local analysis can be done on images of a different architecture than the local host where the analysis occurs.
Add an API version check to prevent accidental use of 1.8.0 against an Anchore V2 API endpoint. See Configuration for more information.
Update to using Syft 0.84.1
13.3.41.3 - AnchoreCTL Release Notes - Version 1.7.0
The latest version of AnchoreCTL is 1.7.0.
AnchoreCTL 1.7.0 is a feature and bug fix release which includes:
Adds more detail from the Anchore Enterprise service for error responses, exposing the server side error detail to the user
Adds new formats (spdx, cycloneDX) to the SBOM output options when using the content get options during image add operations
Add support for new ancestor list command
Add new recommendation field to policy evaluation table output for the image check operation
Changed the policy evaluation level of detail from basic to full detail when fetching policy evaluation during image add operation
Fixed issue where the sbom content was not being fetched when the all type was given to the get option, in the image add operation
Update to using Syft 0.80.0
13.3.41.4 - AnchoreCTL Release Notes - Version 1.6.0
The latest version of AnchoreCTL is 1.6.0.
AnchoreCTL 1.6.0 is a feature and bug fix release which includes:
Adds ability to generate container image SBOMs using a new ‘–from’ option to anchorectl image add. This removes the need to use Syft with anchorectl. AnchoreCTL can now perform all the analysis itself and upload it to your Enterprise deployment. See Using CLI for Images for mor information.
Adds extra analysis locally in addition to the SBOM generation. Filesystem metadata, secret scans, content scans, and file retrieval are now supported as they are when doing analysis of an image inside and Anchore Enterprise deployment
The additional analysis features of secret scans, filesystem metadata, and content searches are only compatible with Anchore Enterprise 4.7+
Fixes the –help output for the ‘completion’ commands to provide correct autocompletion setup guidance
Fixes duplication of vulns shown when no type is specified in anchorectl image vuln <digest> usage
Update to using Syft 0.79.0
13.3.41.5 - AnchoreCTL Release Notes - Version 1.5.0
The latest version of AnchoreCTL is 1.5.0.
AnchoreCTL 1.5.0 is a bug fix release which includes:
Updates a help string for subscription update command to include the runtime_inventory subscription type
Fixes image add <tag> --wait failure with image not found if the same tag is added with another image digest by another client while waiting for the original image to analyze
Update to using Syft 0.75.0
13.3.41.6 - AnchoreCTL Release Notes - Version 1.4.0
The latest version of AnchoreCTL is 1.4.0.
AnchoreCTL 1.4.0 is a feature release which includes:
Adds full output format option support to ‘source sbom’ command similar to ‘image sbom’ operation, including spdx and cyclonedx formats
Adds new command to get a list of vulnerabilities in a specific application version across all artifacts (images and sources)
Adds csv output format for source-repo vulnerability and policy evaluation commands
Fixes adding of incorrect image to application version when using a tag reference in cases where more than one image with that tag is present in the system
Update to using Syft 0.72.1
13.3.41.7 - AnchoreCTL Release Notes - Version 1.3.0
The latest version of AnchoreCTL is 1.3.0.
AnchoreCTL 1.3.0 is a maintenance release which includes:
Added SPDX, CycloneDX and other format options alongside the default JSON format, to the ‘image sbom’ fetch operation
Added CSV format option to ‘image vulnerabilities’ and ‘image check’ operations
Enable ability add container images to Anchore Enterprise by image digest
Add a new ‘CVEs’ column to default table output for ‘image vulnerabilities’ operation for non-CVE findings that refer to one or more CVEs
Update ‘image add’ from SBOM to respect the –no-auto-subscribe flag
Fixes segfault when adding application association to an image that is in analyzing state
Update to using Syft 0.62.3
13.3.41.8 - AnchoreCTL Release Notes - Version 1.2.0
The latest version of AnchoreCTL is 1.2.0.
AnchoreCTL 1.2.0 is a maintenance release which includes:
Support for ‘recommendation’ fields from policy evaluations when used with Enterprise 4.1.1
Fixed to only show a vulnerability once in anchorectl image vuln when not using the -t/--type option
Help and command typo fixes
Updated to using Syft v0.58.0
13.3.41.9 - AnchoreCTL Release Notes - Version 1.1.0
The latest version of AnchoreCTL is 1.1.0.
AnchoreCTL 1.1.0 is a maintenance release which includes:
inventory list command to show all images in the inventory
compatibility with Syft v0.56.0
Updated to using Syft v0.56.0
13.3.41.10 - AnchoreCTL Release Notes - Version 1.0.0
The latest version of AnchoreCTL is 1.0.0.
AnchoreCTL 1.0.0 represents the first stable release of the tool as the primary CLI for Anchore Enterprise users. Configuration, command structure and capabilities have all been renovated to support the usage of the client by administrators, users, and within scripting environments for automated integration
The image add and source add commands have been revisited to additionally provide a simple way to extract common data from Anchore Enterprise:
anchorectl image add <my-image> --get vulnerabilities,content : get a summary of content and vulnerabilities to stdout
anchorectl image add <my-image> --get all=/path/to/store/results: get policy evaluation, vuln, and content results, and store all raw JSON files to /path/to/store/results
anchorectl image add <my-image> --get policy-evaluation: will get the policy evaluation results and set the return code to 1 if the policy evaluation is not passing (allowing use as a quality gate)
Added the ability to associate images and sources with an application name and version when adding into the system (e.g. anchorectl image add <my image> --application <name>@<version>).
The UI for all commands has been enhanced to convey intermediate progress and be transparent about actions taken to any result. For instance, using ANCHORECTL_DEBUG_API=true and increasing log levels to “debug” or “trace” (-vv or -vvv) will show individual API events and responses
The anchorectl.yaml application configuration has changed, use anchorectl --help to see the latest configuration schema
Added flag to switch output format for most commands to one of text, json, json-raw, or ID
Updated to using syft v0.52.0
13.3.41.11 - AnchoreCTL Release Notes - Version 0.2.0
The latest version of AnchoreCTL is 0.2.0.
AnchoreCTL is dependent on Syft v0.39.3 as a library.
The current features that are supported are as follows:
Ability to add sboms via anchorectl using stdin to provide an existing SBOM without re-creating it.
13.3.41.12 - AnchoreCTL Release Notes - Version 0.1.4
The latest version of AnchoreCTL is 0.1.4.
AnchoreCTL is dependent on Syft v0.39.3 as a library.
The current features that are supported are as follows:
Source Repository Management: Generate an SBOM and store the SBOM in Anchore’s database. Get information about the source repository, investigate vulnerability packages by requesting vulnerabilities for a single analyzed source repository, or get any policy evaluations.
Download full image SBOMs for images analyzed with Enterprise 4.0.0.
Compliance Reports: View and operate on runtime compliance reports, such as STIGs, created by the rem tool.
Corrections Management: View and modify corrections information to help reduce false positives in your vulnerability results.
Image Management: View, list, import local analysis, and request image analysis by the system.
Runtime Inventory Management: Add, update, and view cluster configurations for Anchore to scan, as well as for the inventory reports themselves.
System Operations: View and manage system information for your Enterprise deployment.
13.4 - Anchore Data Service
Release Notes
13.4.1 - Anchore Data Service Release Notes - Version 0.33.0 (2026-07-01)
Enable the alma provider which considers AlmaLinux-specific remediations that differ from RedHat Enterprise Linux when doing vulnerability matching. These will only be accounted for properly on Anchore Enterprise deployment versions 5.27.x and above.
Supports maven package remediations from Chainguard Libraries
13.4.3 - Anchore Data Service Release Notes - Version 0.31.0 (2026-06-04)
introduces a curated mapping of known CPEs to grype ecosystem/packages. This allows creating affected_package_handle rows for data where the only current source of matching data is a CPE-only source. [#3332]
Improvements
Improves interpretation of ignored state for the ubuntu provider. [#1123]
13.4.6 - Anchore Data Service Release Notes - Version 0.28.0 (2026-03-12)
Although these data providers are enabled, they will not be fully supported for vulnerability matching and policy evaluations in Anchore Enterprise until version 5.26.0.
13.4.8 - Anchore Data Service Release Notes - Version 0.26.0 (2026-02-10)
The following additional data sources have also been enabled and will be compiled into the vulnerability database; however, these will not currently be matched against by a released version of Anchore Enterprise. Matching support for these will be added in a future release.
13.4.31 - Anchore Data Service Release Notes - Version 0.9.0 (2025-02-05)
Anchore Data Service v0.9.0 - 2025-02-05
The Malware database now uses ClamAV version 1.0.8. This version includes the latest malware signatures and detection capabilities.
Added enhancements to the CISA KEV Database to fix certain inconsistencies in the data.
13.4.32 - Anchore Data Service Release Notes - Version 0.8.0 (2024-11-18)
Anchore Data Service v0.8.0 - 2024-11-18
The vulnerability database has been improved by providing the inferred NVD Fix Version for vulnerabilities when possible.
This data is used to provide information on the version of a package that contains the fix for a vulnerability.
Customers running Enterprise v5.10.0 and greater will automatically see this improved data on their next data sync.
This data is used in Vulnerabilities Policy Gate, Package Trigger with optional parameter of Fix Available.
This dataset can be used to provide a risk score for a vulnerability based on the likelihood that it will be exploited.
The EPSS dataset will be available to all Anchore customers once they upgrade to the future Enterprise v5.12.0 release
which is expected at the end of November 2024.
This data will be used in the Vulnerabilities Policy Gate and Package Trigger with optional parameters:
EPSS Score Comparison
EPSS Score
EPSS Percentile Comparison
EPSS Percentile
13.4.34 - Anchore Data Service Release Notes - Version 0.6.1 (2024-10-23)
Anchore Data Service v0.6.1 - 2024-10-23
Updated Grype DB v0.26.0 which includes the following changes:
Ability to handle symlink paths when found in the upstream vulnerability providers.
13.4.35 - Anchore Data Service Release Notes - Version 0.6.0 (2024-10-18)
Anchore Data Service v0.6.0 - 2024-10-18
Grype DB version has been incremented to 0.25.0. This brings in the following change:
Grype DB now fetches OS type records from the NVD database.
13.4.36 - Anchore Data Service Release Notes - Version 0.5.1 (2024-09-26)
Anchore Data Service v0.5.1 - 2024-09-26
Initial release of Anchore Data Service
Anchore Data Service is a hosted service by Anchore that provides various data to all Enterprise customers. The datasets served include:
Vulnerability Database (grypedb)
ClamAV Malware Database
CISA KEV (Known Exploited Vulnerabilities)
Your Anchore License is all that’s required to authenticate with this service. The data syncer service in your Enterprise installation will automatically sync this data to your installation.
13.5 - Kubernetes Admission Controller
Release Notes
13.5.1 - Kubernetes Admission Controller Release Notes - Version 0.8.4
Kubernetes Admission Controller v0.8.4
Recommendations
Make sure to use anchore-admission-controller helm chart v0.8.4 when deploying.
Improvements
The Go toolchain and various supporting packages have been updated in order to improve security.
13.6.6 - Kubernetes Inventory Release Notes - Version 1.7.7
Kubernetes Inventory v1.7.7
Improvements
Various supporting packages have been updated in order to improve security.
New limit payload-threshold-bytes will add Namespaces to a batch until the payload size exceeds the specified threshold. Once the payload threshold has been reached no new Namespaces will be included in the payload but it should be noted that the last Namespace added before the threshold was reached will be included. Therefore, it is possible that the actual payload size can exceed the threshold.
13.6.7 - Kubernetes Inventory Release Notes - Version 1.7.6
Kubernetes Inventory v1.7.6
Improvements
Various supporting packages have been updated in order to improve security.
Use the internal version of k8s-inventory when reporting the health status of the k8s-inventory pod to the Enterprise deployment. This
allows a more dynamic update of the k8s-inventory version when reporting status.
13.6.8 - Kubernetes Inventory Release Notes - Version 1.7.5
Kubernetes Inventory v1.7.5
Improvements
Various supporting packages have been updated in order to improve security.
Fixes
Fixes an issue detected when a restart of your k8s-inventory pod was incorrectly creating a new health registry entry within your Enterprise deployment.
13.6.12 - Kubernetes Inventory Release Notes - Version 1.7.1
Kubernetes Inventory v1.7.1
Requirements
Make sure to use k8s-inventory helm chart v0.5.0 when deploying on Kubernetes.
Use Enterprise v5.11.0 for the agent to enable integration health reporting. The
health reporting will otherwise be disabled until Enterprise is upgraded.
Improvements
Adds support for integration registration and health reporting.
13.8.6 - Harbor Scanner Adapter Release Notes - Version 1.4.1
Harbor Scanner Adapter v1.4.1
Fixes
The “Fixed in Version” field for vulnerabilities is no longer empty.
The scanner adapter v1.4.1 now provides the information so that Harbor can display it.
Further details regarding the “Fixed in version” field of vulnerabilities in Harbor and what can be expected from the bug fix in v1.4.1:
When an image is scanned for vulnerabilities, Harbor stores the detected vulnerabilities in a database table. Bindings between the image and its vulnerabilities are stored in another database table.
If another scanned image has some vulnerability that already exists in the database, that image is also bound to that existing vulnerability. Even if the new scan provides some updated information (like fixed in version)about the vulnerability, the vulnerability info in the Harbor database is not updated.
This has the consequence that the “fixed in version” field may still be unpopulated even if harbor-scanner-adapter v1.4.1 provides that value.
Example:
Image A has vulnerabilities X and Y and is scanned in a deployment with harbor-scanner-adapter v1.4.0 (or earlier). Result: Image A’s vulnerabilities X and Y will have an empty “fixed in version” value in Harbor.
The same deployment is later updated to use harbor-scanner-adapter v.1.4.1.
Image A is rescanned. Result: Image A’s vulnerabilities X and Y will still have an empty “fixed in version” value in Harbor. Image B, which has vulnerabilities X and Z, and is next scanned in Harbor. Result: Image B’s vulnerability X will have an empty “fixed in version” value.
Image B’s vulnerability Z will have “fixed in version” populated (if it had a non-empty value).
Anchore Enterprise is designed to run locally. It does not share data with Anchore Inc. or any third parties.
Anchore Enterprise can be configured to download vulnerability and other feed data by using the Anchore Data Service, a hosted endpoint that serves pre-built datasets. This data can be accessed by using the Anchore Air-Gapped Capability for isolated environments with no outside internet connectivity.
No data from your deployment is uploaded to Anchore Inc. or any third party.
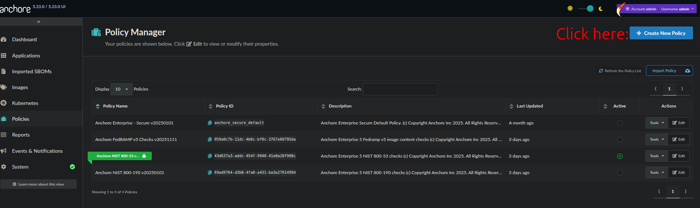
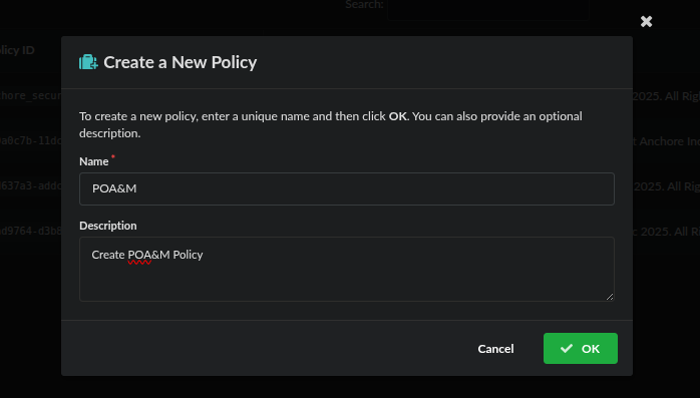
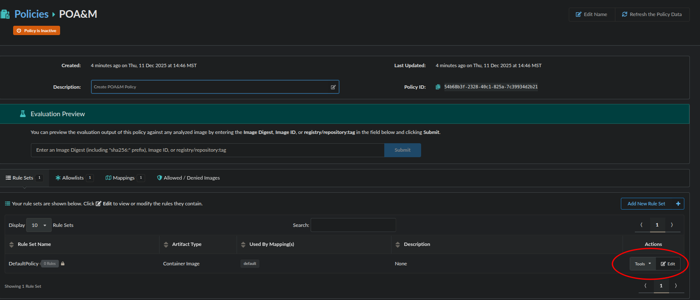
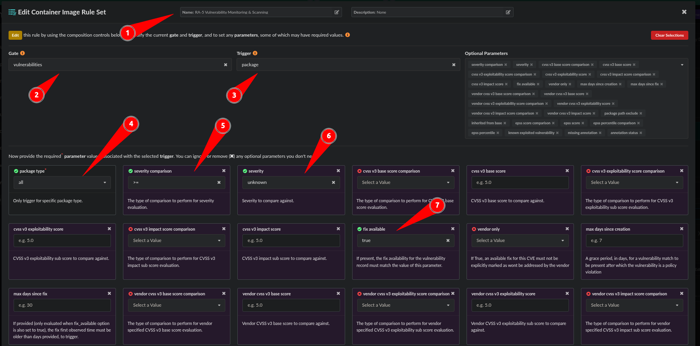
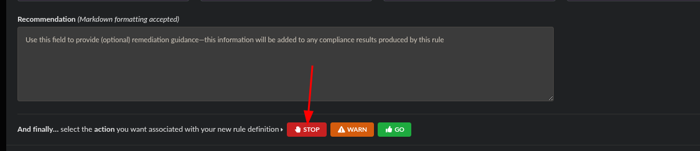
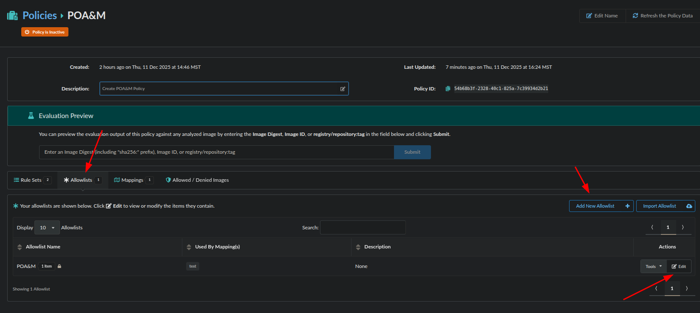
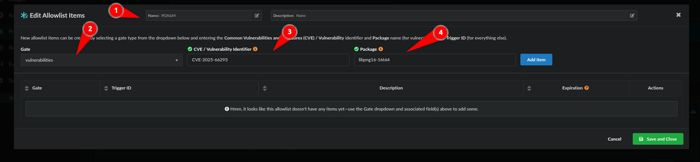
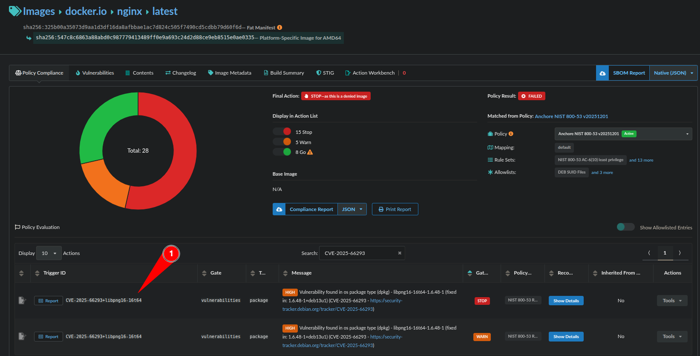
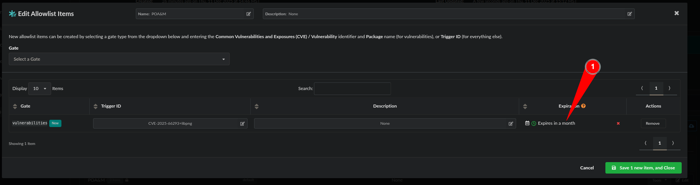
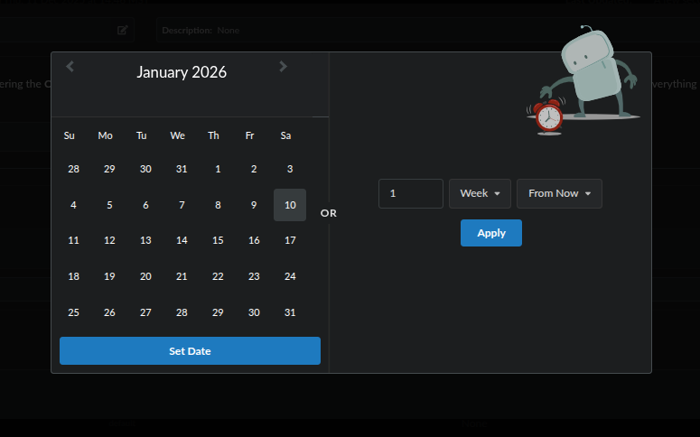
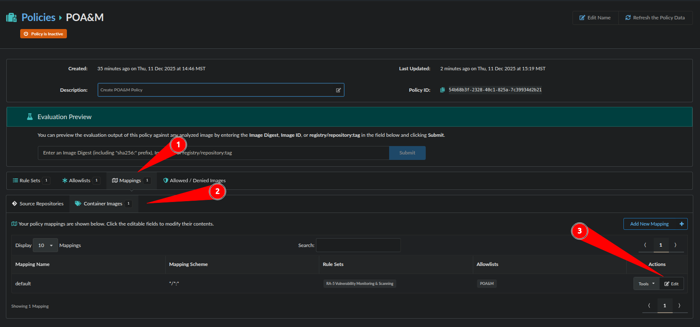
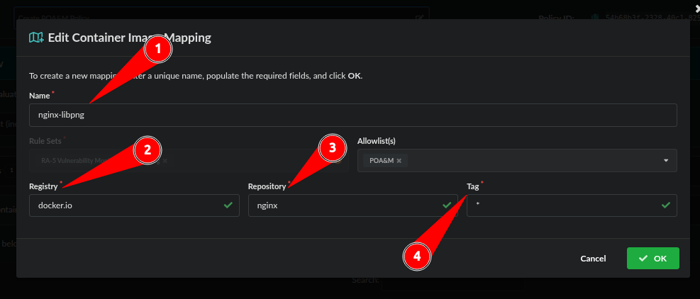
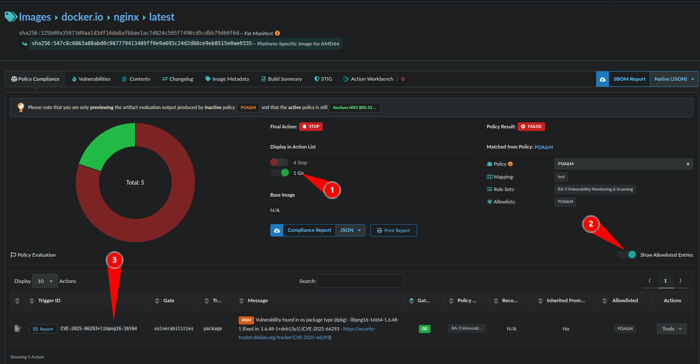
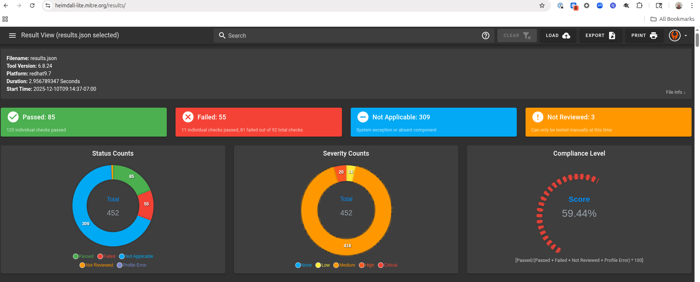
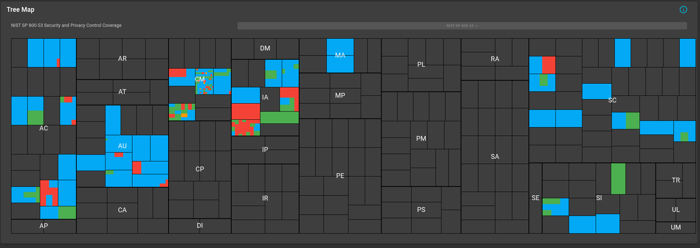
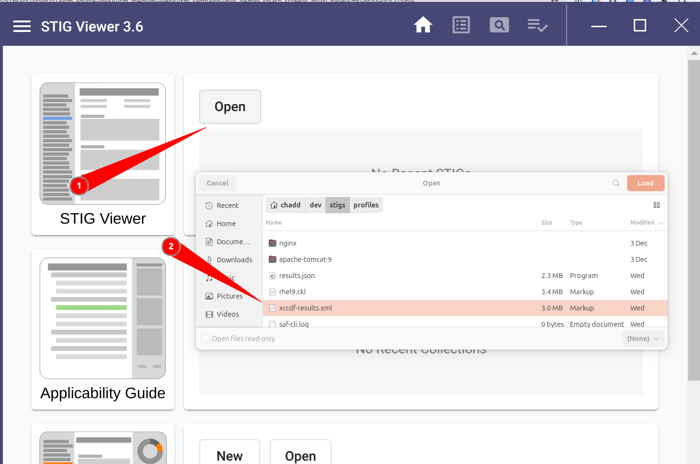
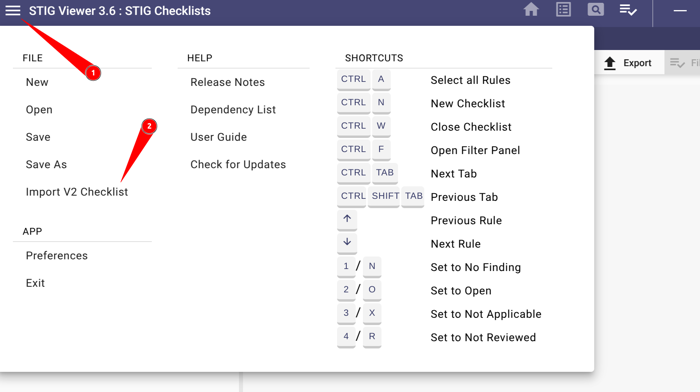
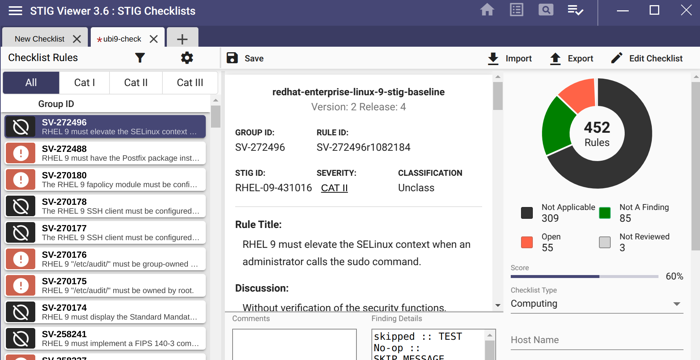
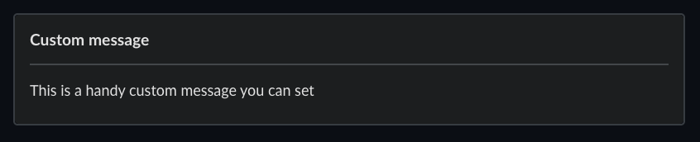

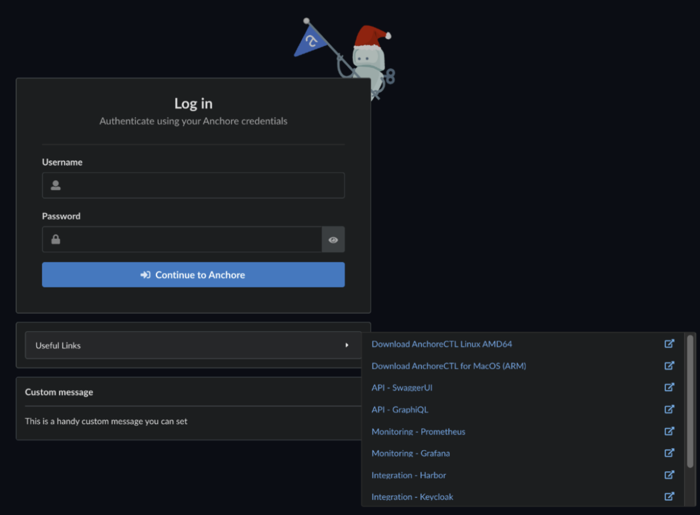
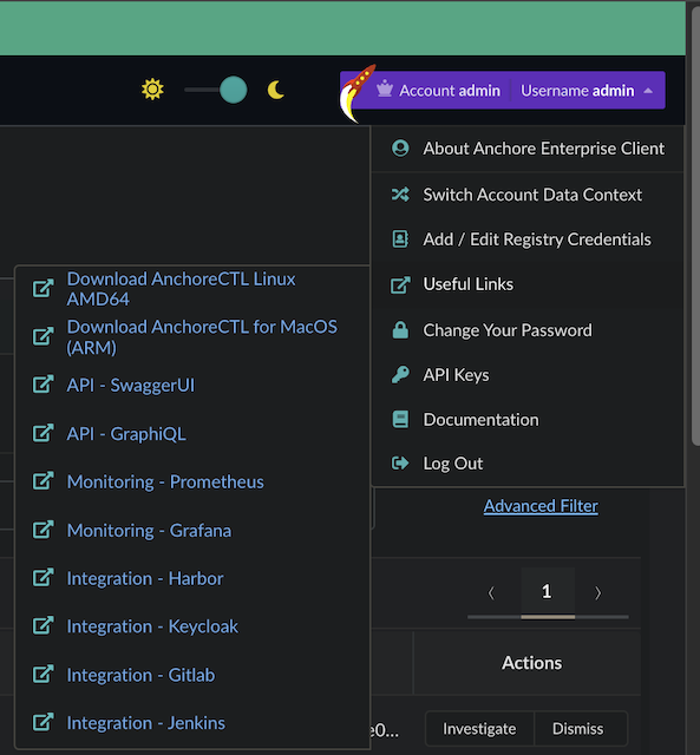
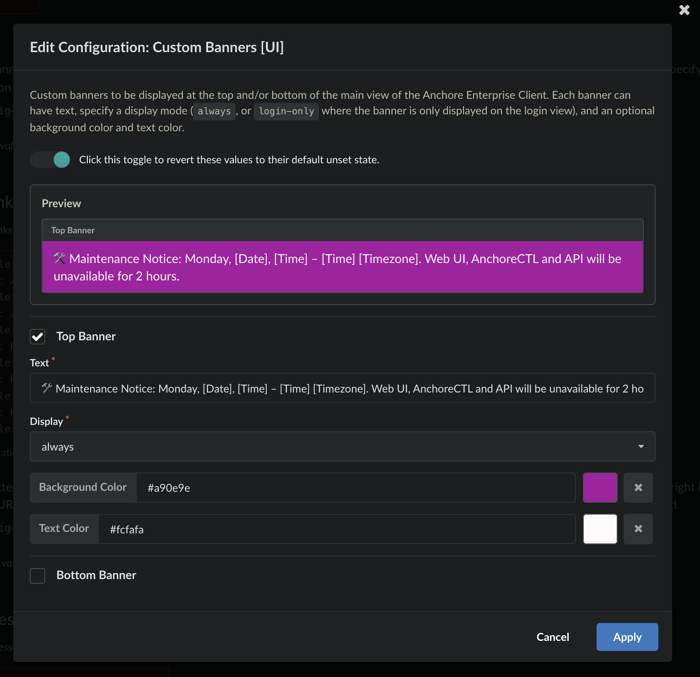
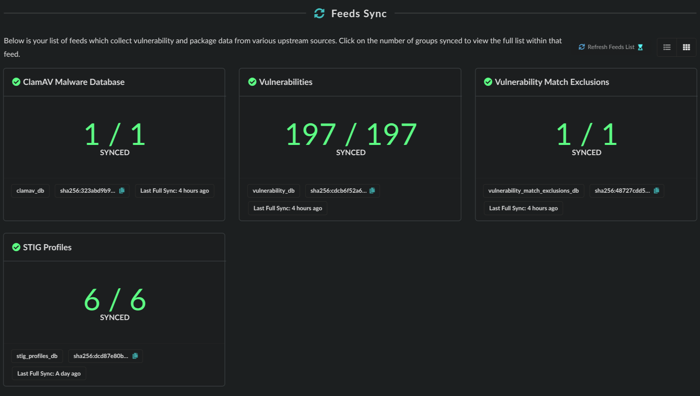
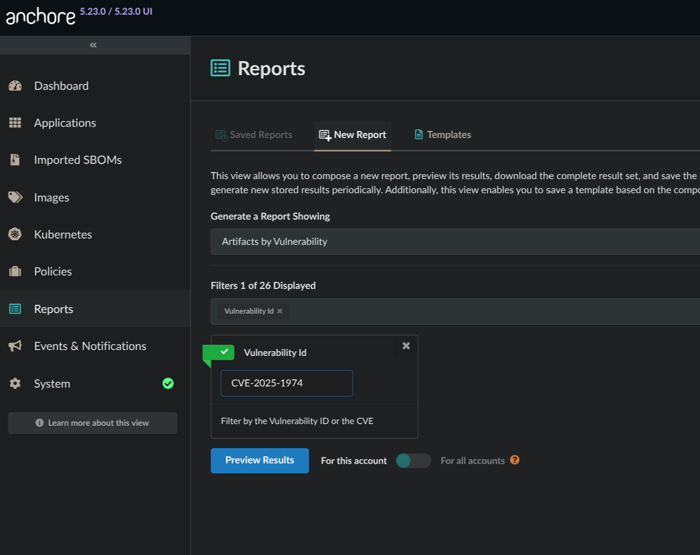
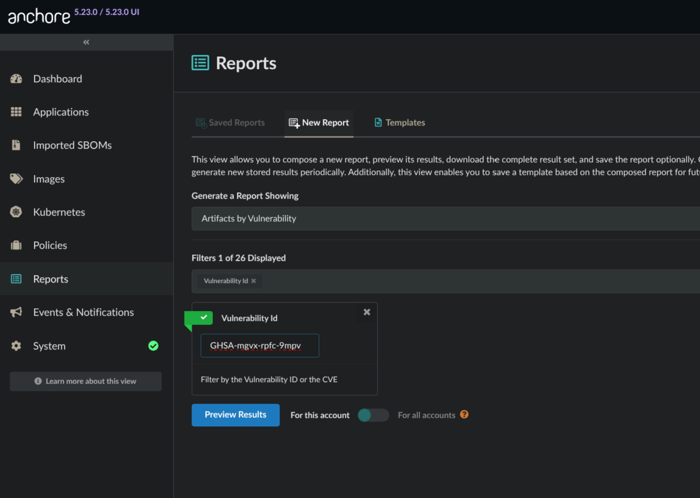
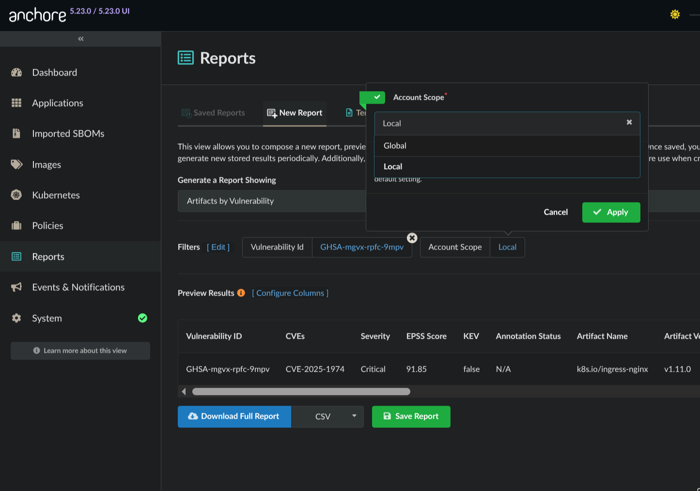
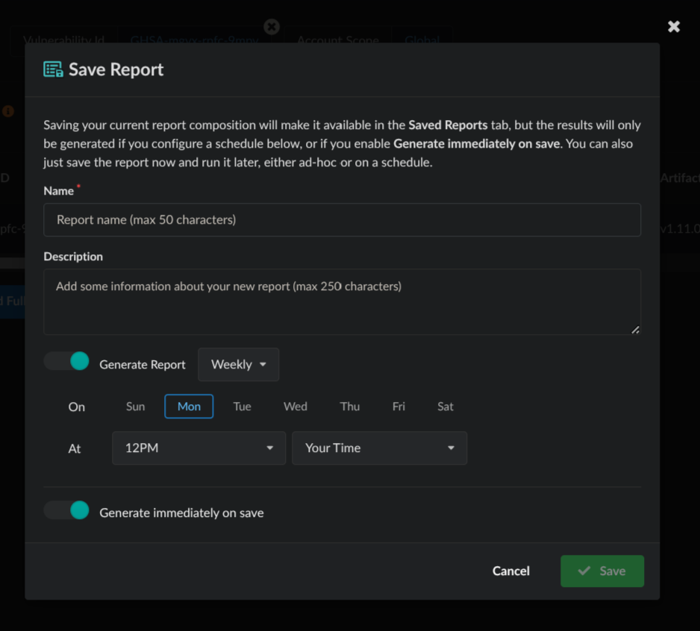
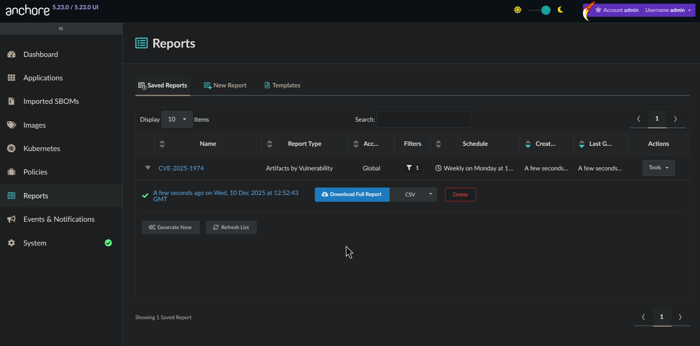
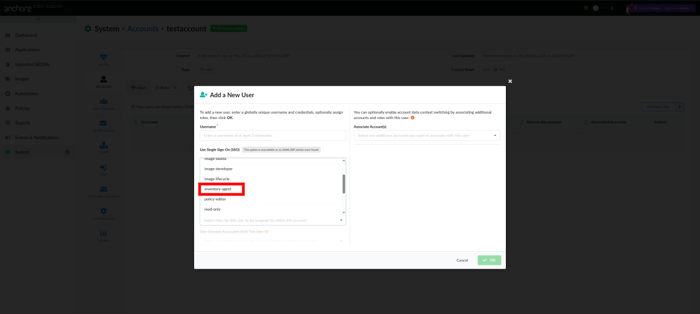
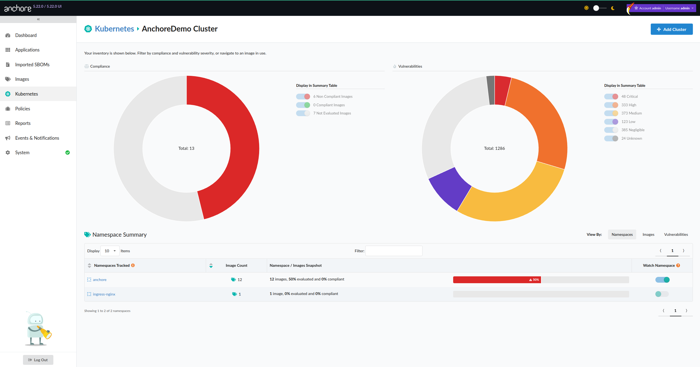
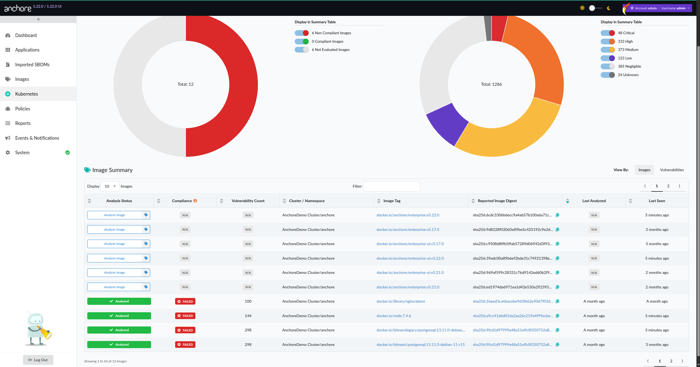


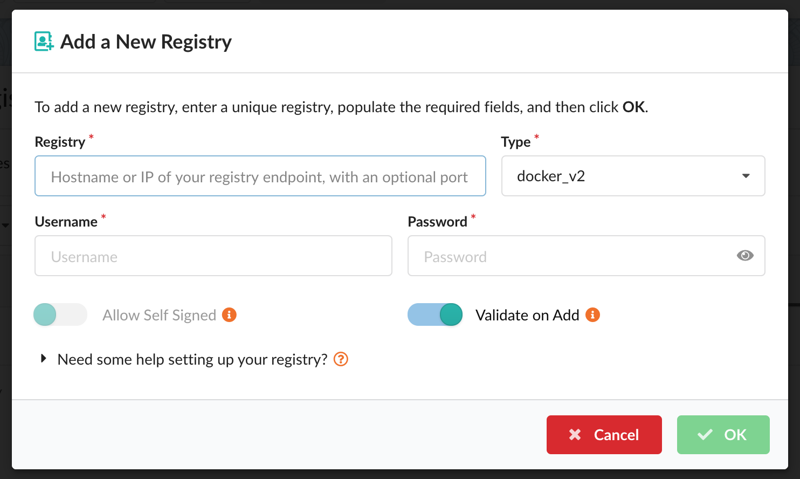
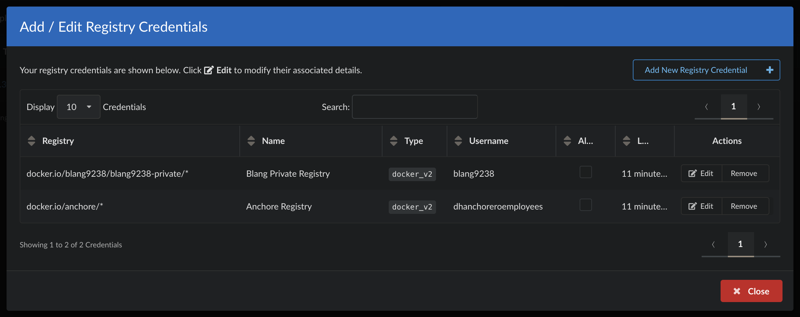
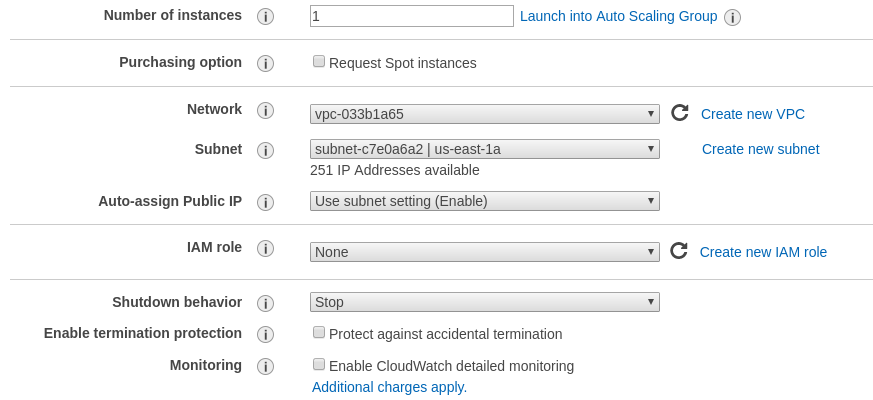
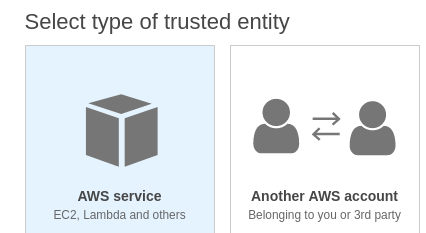
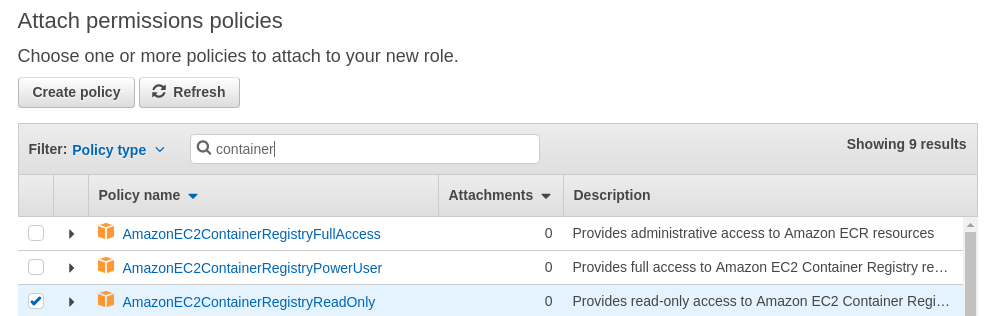


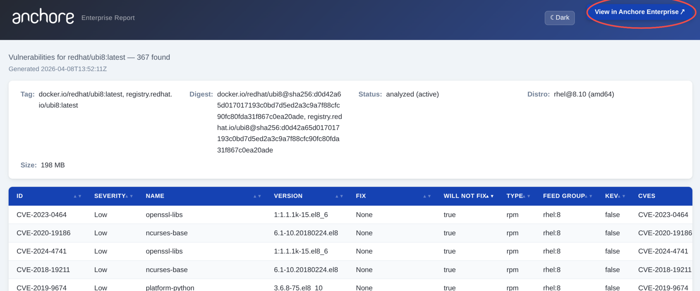


 The
URL should be something like:
The
URL should be something like: