Anchore Enterprise exposes an API that lets the software entities (agents, plugins, and
other components) integrating external systems with Enterprise be tracked and monitored.
Today this API is used by the Kubernetes Inventory agent; other integration instances
will adopt it over time. Existing agents and plugins continue to function whether or not
they participate in this API — participating instances simply gain the ability to be
tracked and monitored.
The API has two parts: integration registration and integration health reporting.
Both are described below.
Terminology
Integration instance: A software entity, like an agent or plugin, that integrates and
external system with Anchore Enterprise. A deployed Kubernetes Inventory agent, Kubernetes Admission
Controller, and ECS Inventory agent are all examples of integration instances.
Integration status: The (life-cycle) status of the integration instance as perceived
by Enterprise. After registration is completed, this status is determined based on if
health reports are received or not.
Reported status: The status of the integration instance as perceived by the integration
instance itself. This is determined from the contents of the health reports, if they contain
any errors or not.
Integration registration
When an integration instance that supports integration registration and health reporting
is started it will perform registration with Anchore Enterprise. This is a kind of
handshake where the integration instance introduces itself, declaring which type it is
and presenting various other information about itself. In response, Anchore Enterprise
provides the integration instance with the uuid that identifies the integration
instance from that point onwards.
The registration request includes two identifiers: registration_id and
registration_instance_id. Anchore Enterprise maintains a record of the association
between integration uuid and <registration_id, registration_instance_id>.
If an integration instance is restarted, it will perform registration again. Assuming the
<registration_id, registration_instance_id> pair in that re-registration remains the
same as in the original registration, Enterprise will consider the integration instance
to be the same (and thus provide the integration instance with the same uuid). Should
the <registration_id, registration_instance_id> pair be different, then Enterprise will
consider the integration instance to be different and assign it a new uuid.
Integrations deployed as multiple replicas
An integration can be deployed as multiple replicas. An example is the Kubernetes Inventory agent,
which helm chart deploys it as a K8s Deployment. That deployment can be specified to have
replicas > 1 (although it is not advisable as the agent is strictly speaking not
implemented to be executed as multiple replicas, it will work but only add unnecessary load).
In such a case, each replica will have identical configuration. They will register as
integration instances and be given their own uuid. By inspecting the registration_id and
registration_instance_id it is often possible to determine if they instances are part of
the same replica set. They will then have registered with identical registration_id but
different registration_instance_id. The exception is if each integration instance
self-generated a unique registration_id that they used during registration. In that case
they cannot be identified to belong to the same replica set this way.
Integration health reporting
Once registered, an integration instance can send periodic health reports to Anchore Enterprise
Enterprise. The interval between two health reports can be configured to be 30 to 600
seconds. A default values will typically be 60 seconds.
Each health report includes a uuid that identifies it and timestamp when it was sent.
These can be used when searching the integration instance’s log file during troubleshooting.
The health report also includes the uptime of the integration instance as well as an
’errors’ property that contains errors that the integration wants to make Anchore Enterprise
aware of. In addition to the above, health reports can also include data specific to the
type of integration.
Reported status derived from health reports
When Anchore Enterprise receives a health report that contains errors from an integration
instance, it will set that instance’s reportedStatus.state to unhealthy and the
reportedStatus.healthReportUuid is set to the uuid of the health report.
If subsequent health reports do no contain errors, the instance’s reportedStatus.state
is set to healthy and the reportedStatus.healthReportUuid is unset.
This is an example of what the reported status can look like from an integration instance
that sends health reports indicating errors:
{
    "reportedStatus": {
      "details": {
        "errors": [
          "unable to report Inventory to Anchore account account0: failed to report data to Anchore: \u0026{Status:4",
          "user account not found (account1) | ",
          "unable to report Inventory to Anchore account account2: failed to report data to Anchore: \u0026{Status:4",
          "user account not found (account3) | "
        ],
        "healthReportUuid": "d676f221-0cc7-485e-b909-a5a1dd8d244e"
      },
      "reason": "Health report included errors",
      "state": "unhealthy"
    }
}
The details.errors list indicates that there is some issues related to ‘account0’,
‘account1’, ‘account2’ and ‘account3’. To fully triage and troubleshoot these issues one
will typically have to search the log file for the integration instance.
This is an example of reported status for case without errors:
{
    "reportedStatus": {
      "state": "healthy"
    }
}
The below figure illustrates how the reportedStatus.state property will transition
between its states.
Integration status derived from health reports
When an integration instance registers with Anchore Enterprise, it will declare at what
interval it will send health reports. A typical value will be 60 seconds.
As long as health reports are received from an integration instance, Enterprise will consider
it to be active. This is reflected in the integration instance’s integrationStatus.state
which is set to active.
If three (3) consecutive health reports fail to be received by Anchore Enterprise, it will
set the integration instance’s integrationStatus.state to inactive.
This is an example of what the integration status can look like when health reports have
not been received from an integration instance:
{
  "integrationStatus": {
    "reason": "Integration last_seen timestamp is older than 2024-10-21 15:33:07.534974",
    "state": "inactive",
    "updatedAt": "2024-10-21T15:46:07Z"
    }
}
A next step to triage this could be to check if the integration instance is actually
running or if there is some network connectivity issue preventing health reports from
being received.
This is an example of integration status when health reports are received as expected:
The below figure illustrates how the integrationStatus.state will transition between
its (lifecycle) states.
Integration instance properties
An integration instance has the below properties. Some properties may not have a value.
accountName: The account that integration instance used during registration (and thus
belongs to).
accounts: List of account names that the integration instance handles. The list is
updated from information contained in health reports from the integration instance.
For the Kubernetes Inventory agent, this list holds all accounts that the agent has
recently attempted to send inventory reports for (regardless if the attempt
succeeded or not).
clusterName: The cluster where the integration instance executes. This will typically
be a Kubernetes cluster.
description: Short arbitrary text description of the integration instance.
explicitlyAccountBound: List of account names that the integration instance is
explicitly configured to handle. This does not include account names that an
integration instance could learn dynamically. For instance, the Kubernetes Inventory agent
can learn about account names to handle via a special label set on the namespaces.
Such account names are not included in this property.
healthReportInterval: Interval in seconds between health reports from the integration
instance.
integrationStatus: The (life cycle) status of the integration instance.
lastSeen: Timestamp when the last health report was received from the integration
instance.
name: Name of the integration instance.
namespace: The namespace where the integration executes. This will typically be a
Kubernetes namespace.
namespaces: List of namespaces that the integration is explicitly configured to handle.
registrationId: Registration id that the integration instance used during registration.
registrationInstanceId: Registration instance id that the integration instance used
during registration.
"reportedStatus: The health status of the integration instance derived from information
reported in the last health report.
startedAt: Timestamp when the integration instance was started.
type: The type of the integration instance. In Enterprise v5.11.0,
k8s_inventory_agent is the only value.
uptime: Uptime (in seconds) of the integration instance.
username: Username that the integration instance registered using.
uuid: The UUID of the integration instance. Used in REST API to specify instance.
version: Software version that the integration instance runs.
1 - Container Registries
Anchore Enterprise can analyze images from any Docker V2 compatible registry. A registry in Anchore Enterprise is a stored credential configuration: it tells the deployment how to authenticate to a registry host, and on its own it does not pull or analyze any images. (Repositories are the unit of analysis; see Watch a Repository.)
Anchore Enterprise attempts to download images from any registry without further configuration. You only need to define a registry when it requires authentication: once a registry and its credentials are defined, every pull for an image from that registry uses them.
A few options and behaviors apply to every registry, regardless of how you add it:
TLS certificate verification is on by default. Anchore Enterprise verifies the registry’s TLS certificate. You can turn verification off for a registry that presents a self-signed certificate or one signed by an unknown CA.
Credential validation is on by default. Anchore Enterprise validates the credential when a registry is added. Because validation methods for public registries change over time, you can skip the check, which is useful when a valid credential fails validation or when adding a credential before it is active at the registry.
Multiple credentials per host. You can store different credentials for different repositories on the same host (for example, two private repositories on docker.io) by qualifying each entry with a repository path.
Passwords are write-only. A registry’s password cannot be retrieved through the GUI, AnchoreCTL, or the API.
Most Docker V2 registries authenticate with a username and password. Amazon ECR, Google GCR, and Microsoft Azure also support their own native credentialing; see the registry-specific configuration below.
Manage Registries in the Anchore Enterprise GUI
Registry management lives under System → Configuration → Registries. Listing and creating registries requires a user in the admin account or a member of the read-write role for the account.
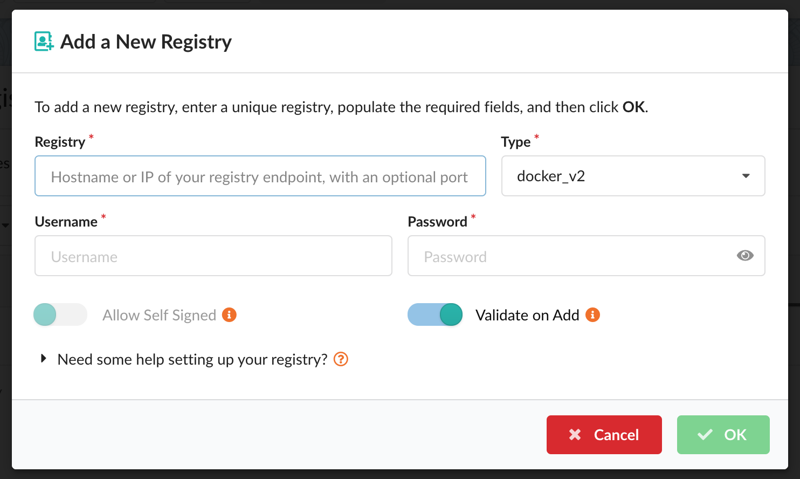
To add a registry, open the Registries tab and select Let’s add one! (or Add New Registry if registries already exist). In the modal, provide the Registry (hostname with optional port), the Type (for example docker_v2 or awsecr), and the Username and Password. Two toggles set the behavior described above: Allow Self Signed turns off TLS certificate verification, and Validate on Add skips credential validation.
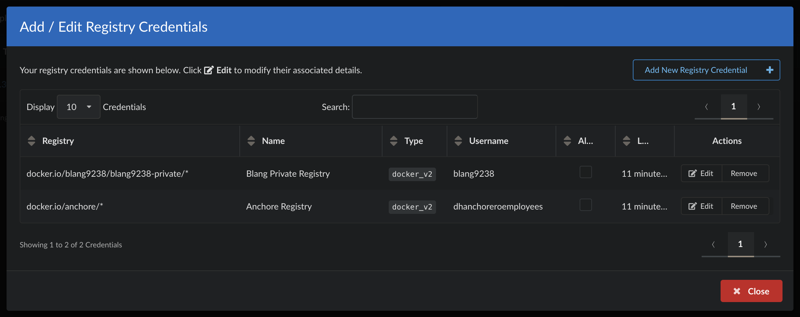
After a registry is added, edit its credentials and options from the Actions column. The setup help for each registry type is also available inline via “Need some help setting up your registry?” near the bottom of the modal.
To store different credentials for repositories on the same host, add each entry with a repository path (for example, docker.io/anchore/*).
Manage Registries with AnchoreCTL
List the defined registries:
anchorectl registry list
Add a registry. The registry argument is the fully qualified hostname and optional port (for example registry.example.com:5000):
Both registry add and registry update accept --secure-connection=<true|false> (TLS certificate verification) and --validate=<true|false> (credential validation at add time); each defaults to true.
Get the details of a specific registry (the password is never returned):
anchorectl registry get <registry>
Update a registry’s username, password, or connection options:
Delete a registry. Deleting a registry record does not delete the image or tag records associated with it:
anchorectl registry delete <registry>
Manage Registries with the API
Registry configuration is managed through the Registries endpoints:
Method
Endpoint
Description
GET
/registries
List configured registries (list_registries)
POST
/registries
Add a registry (create_registry)
GET
/registries/{registry}
Get a registry configuration (get_registry)
PUT
/registries/{registry}
Update a registry (update_registry)
DELETE
/registries/{registry}
Delete a registry (delete_registry)
The full request and response schemas are in the API browser; search for the Registries tag.
Registry-Specific Configuration
The credential fields are the same whether you add a registry through the GUI, AnchoreCTL, or the API. For registries with native credentialing, see the registry-specific guides:
Amazon AWS typically uses keys instead of traditional usernames & passwords. These keys consist of an access key ID and a secret access key. While it is possible to use the aws ecr get-login command to create an access token, this will expire after 12 hours so it is not appropriate for use with Anchore Enterprise, otherwise a user would need to update their registry credentials regularly. So when adding an Amazon ECR registry to Anchore Enterprise you should pass the aws_access_key_id and aws_secret_access_key.
The registry-type parameter instructs Anchore Enterprise to handle these credentials as AWS credentials rather than traditional usernames and passwords. Currently Anchore Enterprise supports two types of registry authentication standard username and password for most Docker V2 registries and Amazon ECR. In this example we specified the registry type on the command line however if this parameter is omitted then AnchoreCTL will attempt to guess the registry type from the URL which uses a standard format.
Anchore Enterprise will use the AWS access key and secret access keys to generate authentication tokens to access the Amazon ECR registry, Anchore Enterprise will manage regeneration of these tokens which typically expire after 12 hours.
In addition to supporting AWS access key credentials Anchore also supports the use of IAM roles for authenticating with Amazon ECR if Anchore Enterprise is run on an EC2 instance.
In this case you can configure Anchore Enterprise to inherit the IAM role from the EC2 instance hosting the system.
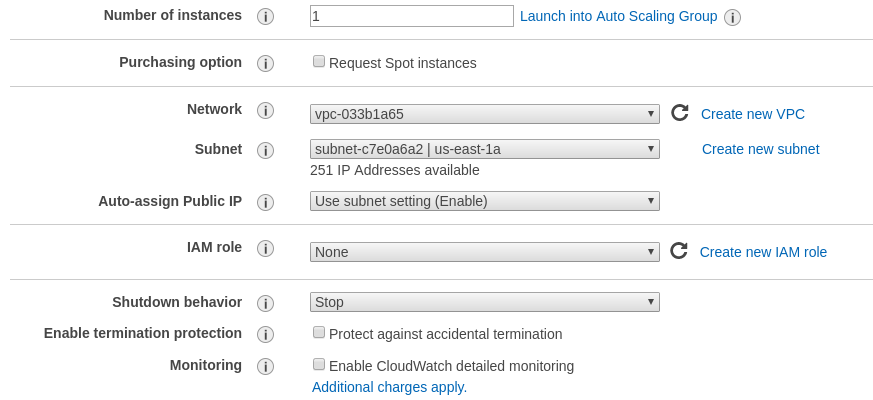
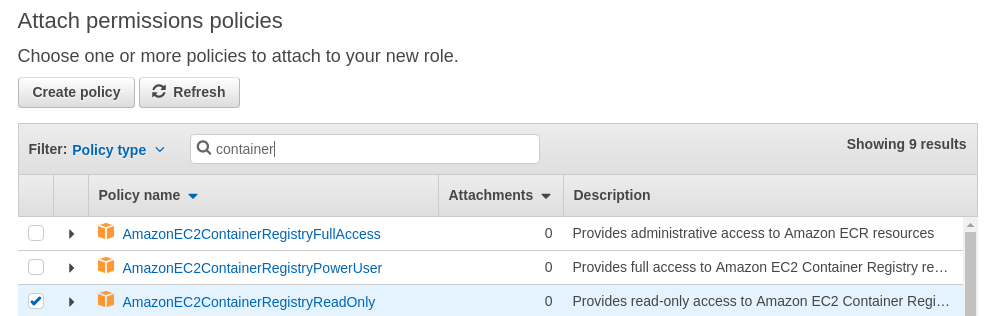
When launching the EC2 instance that will run Anchore Enterprise you need to specify a role that includes the AmazonEC2ContainerRegistryReadOnly policy.
While this is best performed using a CloudFormation template, you can manually configure from the launch instance wizard.
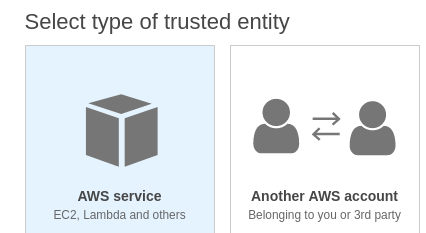
Step 1: Select Create new IAM role.
Step 2: Under type of trusted entity select EC2.
Ensure that the AmazonEC2ContainerRegistryReadOnly policy is selected.
Step 3: Attach Permissions to the Role.
Step 4: Name the role.
Give a name to the role and add this role to the Instance you are launching.
On the running EC2 instance you can manually verify that the instance has inherited the correct role by running the following command:
Step 5: Enable IAM Authentication in Anchore Enterprise.
By default the support for inheriting the IAM role is disabled.
To enable IAM based authentication add the following entry to the top of Anchore Enterprise config.yaml file:
allow_awsecr_iam_auto: True
Step 6: Add the Registry using the AWSAUTO user.
When IAM support is enabled instead of passing the access key and secret access key use “awsauto” for both username and password. This will instruct Anchore Enterprise to inherit the role from the underlying EC2 instance.
To use an Azure Registry, you can configure Anchore Enterprise to use either the admin credential(s) or a service principal. Refer to Azure documentation for differences and how to setup each. When you’ve chosen a credential type, use the following to determine which registry command options correspond to each value for your credential type
Admin Account
Registry: The login server (Ex. myregistry1.azurecr.io)
Username: The username in the ‘az acr credential show –name ’ output
Password: The password or password2 value from the ‘az acr credential show’ command result
Service Principal
Registry: The login server (Ex. myregistry1.azurecr.io)
Username: The service principal app id
Password: The service principal password Note: You can follow Microsoft Documentation for creating a Service Principal.
To add an azure registry credential, invoke anchorectl as follows:
Once a registry has been added, any image that is added (e.g. anchorectl image add <Registry>/some/repo:sometag) will use the provided credential to download/inspect and analyze the image.
1.3 - Google Container Registry
When working with Google Container Registry it is recommended that you use JSON keys rather than the short lived access tokens.
JSON key files are long-lived and are tightly scoped to individual projects and resources. You can read more about JSON credentials in Google’s documentation at the following URL: Google Container Registry advanced authentication
Once a JSON key file has been created with permissions to read from the container registry then the registry should be added with the username _json_key and the password should be the contents of the key file.
In the following example a file named key.json in the current directory contains the JSON key with readonly access to the my-repo repository within the my-project Google Cloud project.
Harbor is an open-source, cloud-native container registry. Anchore Enterprise integrates with Harbor in two ways: as a registry it pulls images from for analysis, and as a scanner that Harbor delegates its vulnerability scans to.
Use Harbor as a Registry
To let Anchore Enterprise pull and analyze images from Harbor, add it as a Docker V2 registry with your Harbor credentials:
Harbor URL — the base URL of your Harbor registry.
Harbor username — a Harbor account with access to the repositories you want analyzed (for example, the admin account).
Once the registry is added, any image you add (for example, anchorectl image add core.harbor.domain/some/repo:sometag) uses the stored credential to download, inspect, and analyze the image. See Container Registries for the full registry-management surface across the GUI, AnchoreCTL, and the API.
Harbor Scanner Adapter
For a deeper integration, the Harbor Scanner Adapter for Anchore lets Harbor issue scans to Anchore Enterprise directly. The adapter is a bridge between the two systems: Harbor schedules scans — on push, on a recurring schedule, or on demand — and the adapter forwards them to your Anchore Enterprise deployment, with results surfaced in both Harbor and the Anchore Enterprise GUI.
Using Harbor with Anchore — push images, run and schedule scans, gate on results, use Harbor as a proxy cache, and troubleshoot.
1.4.1 - Harbor Scanner Adapter Setup
Integrating Harbor
The Harbor Scanner Adapter for Anchore can be used to integrate Harbor with Anchore Enterprise. This scanner provides a gateway for Harbor to communicate with your Anchore Enterprise deployment thereby making it possible for jobs to be scheduled for scans through Harbor.
The adapter’s configuration can be customized using environment variables defined in the harbor-adapter-anchore.yaml.
You can edit this file to adjust the environment variables as needed to fit your deployment. You must configure how the adapter connects to Anchore Enterprise. The following variables are compulsory to be configured:
Note: It is highly recommended that you create a new account in the Anchore Enterprise deployment and a new user with credentials dedicated to the Harbor adapter. When using Enterprise 5+, you can also utilize api keys. Learn how to generate them here
For full Harbor Adapter configuration options, see here
Once you have edited the value file, use the updated file to deploy the Harbor Scanner Adapter by executing:
kubectl apply -f harbor-adapter-anchore.yaml
Once the adapter has been configured as shown above, you will need to add Anchore as the default scanner in Harbor.
Adding Anchore as default scanner
Setting Anchore as the default scanner in Harbor ensures that all image scans, unless specified otherwise, are automatically sent to your Anchore Enterprise deployment for scanning. Follow the steps below to add Anchore as a scanner and set it as the default:
In the Harbor UI login as an admin and navigate to Administration->Interrogation Services->Scanners and click “+ New Scanner”. In older versions of Harbor, this can be found under Configuration->Scanners.
In ‘Endpoint’, use the adapter hostname/url. The default is the following:
http://harbor-scanner-anchore:8080
Leave the authorization field empty, as no API key was set in the adapter deployment environment for this example.
Please untick use internal registry address. Anchore Enterprise could have issues accessing the Harbor registry otherwise
Click “Test Connection” to verify the connection. Then, click “Add” to add the scanner.
Now to ensure all projects in Harbor makes use of the newly configured Anchore scanner, you must make the Anchore scanner your default Scanner. In the Harbor UI, navigate to the project->scanner and click “Select Scanner” click on the radio button next to the selected Anchore Scanner to make it the default scanner.
Configuring Timeouts
Since Harbor and Anchore Enterprise are separate systems, an API call is needed for communication between them. As a result, configuring timeouts may be necessary depending on factors such as your network, the proximity of the two systems, and overall latency.
The ANCHORE_CLIENT_TIMEOUT_SECONDS setting determines the timeout duration (in seconds) for API calls from the Harbor Adapter to the Anchore Enterprise service. By default, it is set to 60 seconds. If the API call to Anchore exceeds this time, the scan may fail or be delayed. A shorter timeout can result in more frequent timeouts during scans, especially if the system is under heavy load or if Anchore’s response time is slower than expected.
The proximity of Anchore Enterprise to the registry also plays a crucial role in scan performance. If Anchore Enterprise is geographically distant or on a separate network from the registry, network latency could increase, leading to slower scan times or potential timeouts. Keeping Anchore Enterprise close to the registry in terms of network topology can reduce latency, improving scan efficiency and reducing the likelihood of timeouts.
To increase the ANCHORE_CLIENT_TIMEOUT_SECONDS, set the environment variable in your harbor-adapter-anchore.yaml file and reapply it.
You can now see the pushed image in the Harbor UI by Navigating to the project under the project menu
Initiate a Vulnerability Scan
To scan your image for vulnerabilities select the image from the repository list. Click SCAN VULNERABILITY under the Actions menu:
During integration you will have configured Anchore Enterprise as your default scanner. This means vulnerability scan requests will be sent to your Anchore Enterprise deployment. Once the scan is complete, the results will appear in both Harbor and the Anchore Enterprise GUI. You can view details about the vulnerabilities, including severity and remediation options.
Scheduling a Vulnerability Scan
Harbor allows you to schedule automated vulnerability scans on your container images. These scans can be performed using the configured scanner (Anchore Enterprise) and will help identify vulnerabilities within the images.
Navigate to Interrogation Services. Under the Vulnerability tab you will see options on scheduling scans (Hourly, daily, weekly or custom). You can also initiate scan of all your images immediately by clicking the SCAN NOW button.
Information regarding scan in progress will be provided on this page.
It is important to note that weekly scans can take time, especially if you have many images. Anchore Enterprise will fetch the latest vulnerability results only if it hasn’t scanned the image before since it caches images it has previously seen. This helps to reduce the overall time required for weekly scans. Additionally, number of analyzers, network latency and timeouts can impact the time taken for a weekly scan to complete.
Enable Image Scanning on Push
By enabling the Scan on Push option under the project’s configuration, Harbor will automatically scan any new images pushed to the project, helping you identify and manage potential security risks efficiently. To enable this. Navigate to the desired project -> configuration and look for the option vulnerability scanning as shown in the picture
Prevent vulnerable images from running
To prevent vulnerable images from being pulled and run, you can set up a policy which uses the last known vulnerability results.
Please note: Anchore Enterprise is still able to pull images to conduct scans.
To do this, navigate to the desired Project -> Configuration and enable the Vulnerability Scanning option
Locate the Deployment Security option, enable it, and choose the severity level to enforce.
Adding Proxy Registries
Harbor has the ability to act as a proxy registry linking to preconfigured upstream registries like DockerHub. This allows users to pull images from Harbor directly which in turn using pre configured credentials pulls and caches the images from an upstream source.
Use Case:
A common use case is that customers want to restrict registry access in a production and/or secure environment to only their Harbor registry and as such Anchore’s own Enterprise images are published and accessible via DockerHub and Iron Bank which might not be accessible. To resolve this, you can setup a proxy cache registry in Harbor and then pull the image from your Harbor deployment.
Don’t forget you can also configure your Anchore Enterprise values.yaml file so that your deployment will pull the images from your private Harbor registry
Finally, an added benefit is that you have a local copy of the Anchore Enterprise Images rather than relying on a public services such as DockerHub or Iron Bank.
Debugging scan issues
When image scanning fails in Harbor using Anchore, it’s important to review logs from three key components: Harbor, the Anchore Adapter, and Anchore Enterprise. Collecting these logs and generating a support bundle can help diagnose the issue. You can then share this information with the Anchore Customer Success team for further assistance.
For Anchore Enterprise, follow instructions here to generate a support bundle
2 - CI / CD Integration
Integrating Anchore Enterprise into your CI/CD pipeline enables fast shift-left feedback, so developers can identify and resolve security issues early in the software development lifecycle.
Platform-specific guides are available for GitHub, GitLab, Jenkins, Azure Pipelines, and AWS CodeBuild; see the subpages in this section. This page covers the requirements and the integration patterns common to all of them.
Requirements
Network access. Anchore Enterprise must be deployed so its API is reachable from your pipeline runners. For centralized analysis, the deployment must also be able to reach the container registries that host your images.
Authentication.API keys are recommended for authenticating from a pipeline, though username and password authentication is also supported.
AnchoreCTL.AnchoreCTL is the primary interface for CI/CD automation and should be version-aligned with your deployment. A common practice is to fetch it from your Anchore Enterprise deployment during the job so the client always matches the server.
Distributed analysis is the recommended default for CI. AnchoreCTL generates the SBOM on the runner and uploads it, so image content never leaves the pipeline. Give your runners fast CPU and I/O, and enable cataloger parallelism to speed up SBOM generation. See Using Distributed Analysis Mode for the AnchoreCTL configuration.
Centralized analysis is required only when you need malware scanning, which unpacks image layers server-side. The deployment pulls and analyzes the image itself.
Gate the Pipeline on Policy
Use the Anchore Enterprise policy engine to turn raw findings into a pass/fail decision the pipeline can act on. Both policy evaluation scopes expose --fail-based-on-results, which returns a non-zero exit code when the result is fail and so fails the CI step.
Evaluate a standalone image in the image catalog against the active policy:
Or check the status of an app version, which rolls up policy results across every asset attached to the version:
anchorectl app version policy status get <VERSION> --app <APP> --fail-based-on-results
On image check, --detail adds the gate, trigger, and remediation detail developers need to resolve violations; for an app version, list the findings behind the verdict with anchorectl app version policy findings list <VERSION> --app <APP>.
One-Time Scan (Stateless Evaluation)
When a pipeline only needs fast pass/fail feedback and does not need the build’s SBOM persisted in the deployment, use a stateless One-Time Scan:
For the full behavior, output options, and how it appears in usage reporting, see One-Time Scan.
2.1 - AWS CodeBuild
Image scanning can be integrated into your AWS CodeBuild pipeline using anchorectl. This guide provides an end-to-end example that creates all required AWS resources (ECR, CodeCommit, S3, IAM roles, CodeBuild, and CodePipeline) from scratch. If you already have an existing CodeBuild project and CodePipeline, the key integration points are the install phase (to install anchorectl), the post_build commands, and the artifacts section of the buildspec.yml in Step 5.
Requirements
Anchore Enterprise is deployed in your environment, with the API accessible from your AWS CodeBuild environment.
An AWS account with permissions to create ECR repositories, CodeCommit repositories, CodeBuild projects, CodePipeline pipelines, S3 buckets, and IAM roles.
The AWS CLI installed and configured with valid credentials.
1. Configure Variables
Set the following shell variables for use throughout the guide. Replace the placeholder values with your actual Anchore Enterprise deployment URL, username, and password. The ANCHORECTL_PASSWORD value should be treated as a secret to prevent exposure in logs.
Create an ECR repository to store your container images. Image tag immutability is enabled to ensure each build produces a unique, traceable image tag derived from the git commit hash.
Create an S3 bucket for CodePipeline to store build artifacts (including Anchore scan results). Versioning, encryption, and public access blocking are enabled for security best practices.
The CodeBuild project defines the build environment and passes Anchore Enterprise credentials as environment variables. The privilegedMode setting is required for Docker-in-Docker builds.
Note: The ANCHORECTL_PASSWORD is included as a PLAINTEXT environment variable here for simplicity. For production use, store it in AWS Secrets Manager or SSM Parameter Store and reference it with type: SECRETS_MANAGER or type: PARAMETER_STORE in the environmentVariables block.
This is the most easily scalable method for scanning images. Distributed scanning uses the anchorectl utility to build the SBOM directly on the CodeBuild runner and then pushes the SBOM to Anchore Enterprise through the API. This avoids the need to provide registry credentials in the Enterprise backend, since the image is loaded directly from the local Docker daemon.
Clone the CodeCommit repository and create a buildspec.yml with the following content. The buildspec installs anchorectl directly from your Anchore Enterprise deployment (ensuring version compatibility), builds and tags the Docker image using the git commit hash, scans the image with Anchore Enterprise, and exports all scan artifacts.
git clone "$(aws codecommit get-repository \
--region "$AWS_REGION"\
--repository-name "$CODECOMMIT_REPO_NAME"\
--query 'repositoryMetadata.cloneUrlHttp'\
--output text)"cd "$CODECOMMIT_REPO_NAME"git checkout -b main
cat > buildspec.yml <<'EOF'
version: 0.2
phases:
install:
commands:
### install anchorectl from your Anchore Enterprise deployment to ensure version compatibility
- curl -sSfL -u "${ANCHORECTL_USERNAME}:${ANCHORECTL_PASSWORD}" "${ANCHORECTL_URL}/v2/system/anchorectl?operating_system=linux&architecture=amd64" | tar -zx -C /usr/local/bin anchorectl
pre_build:
commands:
- AWS_ACCOUNT_ID=$(aws sts get-caller-identity --query Account --output text)
### use the short git commit hash as the image tag for traceability
- IMAGE_TAG=$(echo "$CODEBUILD_RESOLVED_SOURCE_VERSION" | cut -c1-7)
- IMAGE_URI=${AWS_ACCOUNT_ID}.dkr.ecr.${AWS_REGION}.amazonaws.com/${IMAGE_REPO_NAME}:${IMAGE_TAG}
- aws ecr get-login-password --region "$AWS_REGION" | docker login --username AWS --password-stdin ${AWS_ACCOUNT_ID}.dkr.ecr.${AWS_REGION}.amazonaws.com
build:
commands:
- |
docker build -t ${IMAGE_REPO_NAME}:${IMAGE_TAG} \
--build-arg CI=aws-codepipeline \
--build-arg REPO=${IMAGE_REPO_NAME} \
--build-arg COMMIT=${CODEBUILD_RESOLVED_SOURCE_VERSION} \
--build-arg COMMIT_SHORT=${IMAGE_TAG} \
--build-arg PIPELINE=${CODEBUILD_INITIATOR} \
--build-arg REGION=${AWS_REGION} \
.
- docker tag ${IMAGE_REPO_NAME}:${IMAGE_TAG} ${IMAGE_URI}
post_build:
commands:
### scan the image from the local Docker daemon (distributed mode) and wait for analysis to complete
### --get all=./ exports all scan artifacts (SBOMs, vulnerabilities, policy evaluation) to the working directory
- |
anchorectl image add ${IMAGE_URI} --dockerfile Dockerfile --from docker --dockerfile Dockerfile --no-auto-subscribe --wait --get all=./ \
--annotation "ci=aws-codepipeline" \
--annotation "repo=${IMAGE_REPO_NAME}" \
--annotation "commit=${CODEBUILD_RESOLVED_SOURCE_VERSION}" \
--annotation "commit_short=${IMAGE_TAG}" \
--annotation "pipeline=${CODEBUILD_INITIATOR}" \
--annotation "region=${AWS_REGION}"
### evaluate the image against your Anchore Enterprise policy
### set --fail-based-on-results to break the build if the policy evaluation returns FAIL
- anchorectl image check ${IMAGE_URI} --fail-based-on-results --detail
- docker push ${IMAGE_URI}
- printf '[{"name":"app","imageUri":"%s"}]' "${IMAGE_URI}" > imagedefinitions.json
artifacts:
files:
- imagedefinitions.json
- content.json
- image-metadata.json
- policy-evaluation.json
- sbom.json
- sbomcyclonedx.json
- sbomspdx.json
- vulnerability.json
EOFcat > Dockerfile <<'EOF'
FROM public.ecr.aws/ubuntu/ubuntu:latest
ARG CI
ARG REPO
ARG COMMIT
ARG COMMIT_SHORT
ARG PIPELINE
ARG REGION
LABEL org.opencontainers.image.source="${REPO}" \
org.opencontainers.image.revision="${COMMIT}" \
com.anchore.ci="${CI}" \
com.anchore.commit.short="${COMMIT_SHORT}" \
com.anchore.pipeline="${PIPELINE}" \
com.anchore.region="${REGION}"
ENV DEBIAN_FRONTEND=noninteractive
RUN apt-get update \
&& apt-get install -y --no-install-recommends \
python3 \
python3-pip \
&& rm -rf /var/lib/apt/lists/*
CMD ["python3", "--version"]
EOFgit add .
git commit -m "Initial commit"git push origin main
cd ..
The --get all=./ flag on anchorectl image add exports the following scan artifacts to the build directory, which are then stored as pipeline artifacts in S3:
Artifact
Description
sbom.json
Anchore-native SBOM format
sbomcyclonedx.json
CycloneDX SBOM (industry standard)
sbomspdx.json
SPDX SBOM (industry standard)
vulnerability.json
Full vulnerability report
policy-evaluation.json
Policy evaluation results
content.json
Package and file content listing
image-metadata.json
Image metadata (digest, distro, layers)
b) Centralized Mode
This method uses the “analyzer” pods in the Anchore Enterprise deployment to build the SBOM. This can create queuing if there are not enough analyzer processes, and this method will require the operator to provide ECR registry credentials in the Enterprise backend. This method may be preferred in cases where the Anchore Enterprise operator does not control the image build process (the analyzers can simply poll registries to look for new image builds as they are pushed), and this method also allows the operator to simply queue up the image for asynchronous scanning later if vulnerability and policy results are not required immediately. If the user wants malware scanning results from Anchore Enterprise’s clamav integration, the Centralized Scanning method is required.
To use centralized mode, replace the post_build commands in the buildspec above with the following. Note that --from docker is removed, so Anchore Enterprise will pull the image from the registry after it is pushed.
post_build:commands:### push the image first so Anchore Enterprise can pull it from the registry- docker push ${IMAGE_URI}### queue the image for scanning by Anchore Enterprise analyzers### --no-auto-subscribe prevents automatic re-scanning on future tag updates- | anchorectl image add ${IMAGE_URI} --no-auto-subscribe --wait --get all=./ \
--annotation "ci=aws-codepipeline" \
--annotation "repo=${IMAGE_REPO_NAME}" \
--annotation "commit=${CODEBUILD_RESOLVED_SOURCE_VERSION}" \
--annotation "commit_short=${IMAGE_TAG}" \
--annotation "pipeline=${CODEBUILD_INITIATOR}" \
--annotation "region=${AWS_REGION}"### evaluate the image against your Anchore Enterprise policy- anchorectl image check ${IMAGE_URI} --fail-based-on-results --detail- printf '[{"name":"app","imageUri":"%s"}]' "${IMAGE_URI}" > imagedefinitions.json
6. Create the CodePipeline
The pipeline has two stages: a Source stage that pulls from CodeCommit on each commit to the main branch, and a Build stage that runs the CodeBuild project.
When the pipeline completes, view the build results in the AWS Console under CodeBuild > Build history > select your build > Build logs. The logs will display the anchorectl output including vulnerability counts and policy evaluation results.
The scan artifacts (SBOMs, vulnerability report, policy evaluation) are stored as build artifacts in the S3 artifact bucket. You can download them from CodePipeline > select your pipeline > BuildOutput artifact, or directly from the S3 bucket.
2.2 - GitLab
Requirements
Anchore Enterprise is deployed in your environment, with the API accessible from your GitLab CI environment.
Credentials for your GitLab Container Registry are added to Anchore Enterprise, under the Anchore account that you intend to use with GitLab CI. See Container Registries. For information on what registry/credentials must be added to allow Anchore Enterprise to access your GitLab Container Registry, see https://docs.gitlab.com/ee/user/packages/container_registry/.
1. Configure Variables
Ensure that the following variables are set in your GitLab repository (settings -> CI/CD -> Variables -> Expand -> Add variable) or GitLab Group:
GitLab has a minimum length of 8 for masked variables. Please ensure both your username and password meet this requirement.
2. Create config file
Create a new file in your repository. Name the file .gitlab-ci.yml.
3. Configure scanning mode
a) Distributed Mode
This is the most easily scalable method for scanning images. Distributed scanning uses the anchorectl utility to build the SBOM directly on the build runner and then pushes the SBOM to Anchore Enterprise through the API. To use this scanning method, paste the following workflow script into your new .gitlab-ci.yml file. After building the image from your Dockerfile and scanning it with anchorectl, this workflow will display vulnerabilities and policy results in the build log. After pasting, click “Commit changes” to save the new file.
### Anchore Distributed Scan# you will need three variables defined:# ANCHORECTL_USERNAME# ANCHORECTL_PASSWORD# ANCHORECTL_URLimage:docker:latestservices:- docker:dindstages:- build- anchorevariables:### set this to true if you want the result of the policy check to determine whether the job succeeds or notANCHORECTL_FAIL_BASED_ON_RESULTS:"false"ANCHORE_IMAGE:${CI_REGISTRY_IMAGE}:${CI_COMMIT_REF_SLUG}Build:stage:buildscript:### build and push docker image- echo "$CI_REGISTRY_PASSWORD" | docker login $CI_REGISTRY -u $CI_REGISTRY_USER --password-stdin- docker build -t ${ANCHORE_IMAGE} .- docker push ${ANCHORE_IMAGE}Anchore:stage:anchorebefore_script:### install anchorectl binary- apk add --no-cache curl- 'curl "$ANCHORECTL_URL/v2/system/anchorectl?operating_system=linux&architecture=amd64" -H "accept: */*" | tar -zx anchorectl && mv -v anchorectl /usr/bin && chmod +x /usr/bin/anchorectl && /usr/bin/anchorectl version'- export PATH="${HOME}/.local/bin/:${PATH}"script:### provide registry credentials for anchorectl- export ANCHORECTL_REGISTRY_AUTH_AUTHORITY=$CI_REGISTRY- export ANCHORECTL_REGISTRY_AUTH_USERNAME="$CI_REGISTRY_USER"- export ANCHORECTL_REGISTRY_AUTH_PASSWORD="$CI_REGISTRY_PASSWORD"### scan image and push to anchore enterprise- anchorectl image add --no-auto-subscribe --wait --dockerfile ./Dockerfile --from registry ${ANCHORE_IMAGE}### then get the results:- anchorectl image vulnerabilities ${ANCHORE_IMAGE}- anchorectl image check --detail ${ANCHORE_IMAGE}
b) Centralized Mode
This method uses the “analyzer” pods in the Anchore Enterprise deployment to build the SBOM. This can create queuing if there are not enough analyzer processes, and this method will require the operator to provide registry credentials in the Enterprise backend (if the images to be scanned are in private registries). This method may be preferred in cases where the Anchore Enterprise operator does not control the image build process (the analyzers can simply poll registries to look for new image builds as they are pushed), and this method also allows the operator to simply queue up the image for asynchronous scanning later if vulnerability and policy results are not required immediately. If the user wants malware scanning results from Anchore Enterprise’s clamav integration, the Centralized Scanning method is required. To use this scanning method, paste the following workflow script into your new .gitlab-ci.yml file. After building the image from your Dockerfile,, this workflow will tell Anchore Enterprise to scan the image, then it will display the vulnerability and policy results in the build log. After pasting, click “Commit changes” to save the new file.
### Anchore Centralized Scan# you will need three variables defined:# ANCHORECTL_USERNAME# ANCHORECTL_PASSWORD# ANCHORECTL_URLimage:docker:latestservices:- docker:dindstages:- build- anchorevariables:ANCHORECTL_FAIL_BASED_ON_RESULTS:"false"ANCHORE_IMAGE:${CI_REGISTRY_IMAGE}:${CI_COMMIT_REF_SLUG}Build:stage:buildscript:### build and push docker image- echo "$CI_REGISTRY_PASSWORD" | docker login $CI_REGISTRY -u $CI_REGISTRY_USER --password-stdin- docker build -t ${ANCHORE_IMAGE} .- docker push ${ANCHORE_IMAGE}Anchore:stage:anchorebefore_script:### install anchorectl binary- apk add --no-cache curl- 'curl "$ANCHORECTL_URL/v2/system/anchorectl?operating_system=linux&architecture=amd64" -H "accept: */*" | tar -zx anchorectl && mv -v anchorectl /usr/bin && chmod +x /usr/bin/anchorectl && /usr/bin/anchorectl version'- export PATH="${HOME}/.local/bin/:${PATH}"script:### note that private registries will require registry credentials to be configured in your Anchore deployment### queue image for scanning- anchorectl image add --no-auto-subscribe --wait --dockerfile ./Dockerfile ${ANCHORE_IMAGE} ### then get the results:- anchorectl image vulnerabilities ${ANCHORE_IMAGE}- anchorectl image check --detail ${ANCHORE_IMAGE}
4. View pipeline
Gitlab will automatically start a pipeline. Navigate to “Build” -> “Pipelines” and then on your running pipeline.
5. View output
Once the build is complete, click on the “anchore” stage and view the output of the job. You will see the results of the vulnerability match and policy evaluation in the output.
2.3 - Azure Pipelines
Anchore Enterprise can be integrated into Azure DevOps pipelines to generate and analyze SBOMs, perform vulnerability scanning, and enforce policy evaluation as a pipeline gate. This page covers two integration approaches: distributed analysis and centralized analysis.
Prerequisites
The following are required for both integration approaches:
A running Anchore Enterprise instance. See Deployment for setup instructions.
An Azure DevOps pipeline.
An Azure Key Vault variable group named anchoreCredentials containing your Anchore Enterprise credentials. The following variables are required:
Variable
Description
anchore_url
The URL of your Anchore Enterprise instance
anchore_endpoint
The hostname of your Anchore Enterprise instance (used to download AnchoreCTL)
anchore_user
Your Anchore username, or _api_key if using an API key
anchore_pass
Your Anchore password or API key value
API keys are the recommended authentication method for CI/CD pipelines. They can be rotated and revoked independently of user accounts. See API Keys for setup instructions.
Distributed Analysis
In distributed analysis, AnchoreCTL generates the SBOM locally on the pipeline agent and uploads it to Anchore Enterprise for vulnerability matching and policy evaluation. The image is not required to be in a remote registry before scanning.
This is the recommended approach for most pipelines. It requires less infrastructure than centralized analysis and avoids the need for a staging registry.
Distributed analysis does not support malware scanning. If your workflow requires malware scanning via ClamAV, use Centralized Analysis instead.
How It Works
The anchorectl image add command accepts a --from flag that specifies the source from which AnchoreCTL should generate the SBOM:
--from docker:<image> — generates the SBOM from a locally available Docker image on the pipeline agent.
--from registry — pulls the image from a remote registry for local analysis. Use this when the image has already been pushed to a registry in a prior pipeline step, as it captures the registry-assigned digest, which remains consistent as the image moves through environments.
The first positional argument to image add is the tag Anchore Enterprise uses to identify the image in its database. This does not need to be a pullable registry path.
Distributed Pipeline
trigger:- masterresources:- repo:selfvariables:- name:imageRefvalue:'production/simpleserver:$(Build.BuildId)'- group:anchoreCredentialsstages:- stage:BuilddisplayName:Build stagejobs:- job:BuilddisplayName:Buildpool:vmImage:'ubuntu-latest'steps:- task:Docker@2displayName:Build imageinputs:command:buildrepository:simpleserverdockerfile:Dockerfiletags:| $(Build.BuildId)- stage:SecuritydisplayName:Security scan stagedependsOn:Buildjobs:- job:SecuritydisplayName:Securitypool:vmImage:'ubuntu-latest'steps:- script:curl -X GET "https://$(anchore_endpoint)/v2/system/anchorectl?operating_system=linux&architecture=amd64" -H "accept: */*" | tar -zx anchorectldisplayName:Install AnchoreCTL- script:| export PATH=$PATH:$HOME/.local/bin
export ANCHORECTL_URL=$(anchore_url)
export ANCHORECTL_USERNAME=$(anchore_user)
export ANCHORECTL_PASSWORD=$(anchore_pass)
# To authenticate with an API key instead:
# export ANCHORECTL_USERNAME=_api_key
# export ANCHORECTL_PASSWORD=$(api_token)
./anchorectl image add $(imageRef) --from docker:simpleserver:$(Build.BuildId) --dockerfile Dockerfile --wait
./anchorectl image vulnerabilities $(imageRef)
./anchorectl image check $(imageRef) --fail-based-on-resultsdisplayName:Anchore Security Scan- stage:ProductiondisplayName:Production stagedependsOn:Security# Push the image to your production registry and deploy
Centralized Analysis
In centralized analysis, the image is pushed to a staging registry and Anchore Enterprise pulls and analyzes it directly using the analyzer service. The SBOM is stored in Anchore Enterprise and available for post-scan reporting, compliance auditing, and policy justification.
This approach is required when malware scanning is enabled. See Malware Scanning for configuration details. Note that enabling malware scanning increases overall scan time.
Providing the Dockerfile via --dockerfile also enables Dockerfile-specific policy checks, such as validating the effective user ID or flagging exposed ports.
A staging registry. Images are pushed here before scanning and promoted to production only after passing policy evaluation. The example below provisions an Azure Container Registry using Terraform:
Note:admin_enabled = true enables the ACR built-in admin account, which uses a single shared credential and cannot be scoped or audited per consumer. For production use, set admin_enabled = false and grant access using a service principal or managed identity with the AcrPull and AcrPush roles as appropriate. See Azure Container Registry authentication options for details.
An Azure DevOps service connection. Required for the pipeline to push images to the staging registry. Configure a Docker Registry service connection targeting your Azure Container Registry. See Azure DevOps service connections for instructions.
Registry credentials in Anchore Enterprise. Anchore Enterprise must be able to pull images from the staging registry. See Container Registries for instructions.
Centralized Pipeline
trigger:- masterresources:- repo:selfvariables:- name:stagedImagevalue:'staging/simpleserver:$(Build.BuildId)'- name:productionImagevalue:'production/simpleserver:$(Build.BuildId)'- group:anchoreCredentialsstages:- stage:BuilddisplayName:Build and push to staging# Build and push the image to the staging registry- stage:SecuritydisplayName:Security scan stagedependsOn:Buildjobs:- job:SecuritydisplayName:Securitypool:vmImage:'ubuntu-latest'steps:- script:curl -X GET "https://$(anchore_endpoint)/v2/system/anchorectl?operating_system=linux&architecture=amd64" -H "accept: */*" | tar -zx anchorectldisplayName:Install AnchoreCTL- script:| export PATH=$PATH:$HOME/.local/bin
export ANCHORECTL_URL=$(anchore_url)
export ANCHORECTL_USERNAME=$(anchore_user)
export ANCHORECTL_PASSWORD=$(anchore_pass)
./anchorectl image add $(stagedImage) --dockerfile Dockerfile --wait
./anchorectl image vulnerabilities $(stagedImage)
./anchorectl image check $(stagedImage) --fail-based-on-resultsdisplayName:Anchore Security Scan- stage:ProductiondisplayName:Production stagedependsOn:Security# Push the image to your production registry and deploy
Failing a Pipeline on Policy Evaluation
The --fail-based-on-results flag (shorthand: -f) on anchorectl image check causes AnchoreCTL to return a non-zero exit code when the policy evaluation result is stop. This fails the pipeline stage and prevents the image from being promoted.
✔ Evaluated against policy [failed]Tag: docker.io/anchore/test_images:convertigo-7.9.2
Digest: sha256:b649023ebd9751db65d2f9934e3cfeeee54a010d4ba90ebaab736100a1c34d7d
Policy ID: anchore_secure_default
Last Evaluation: 2026-02-20T17:19:26Z
Evaluation: fail
Final Action: stop
Reason: policy_evaluation
error: 1 error occurred:
* failed policies:
One-Time Analysis
Anchore Enterprise supports one-time analysis, which performs vulnerability scanning and policy evaluation without storing the SBOM. This is useful for quick feedback during development before pushing to a registry.
Image Scanning can be easily integrated into your GitHub Actions pipeline using anchorectl.
1. Configure Variables
Ensure that the following variables/secrets are set in your GitHub repository (repository settings -> secrets and variables -> actions):
Variable ANCHORECTL_URL
Variable ANCHORECTL_USERNAME
Secret ANCHORECTL_PASSWORD
These are necessary for the integration to access your Anchore Enterprise deployment. The ANCHORECTL_PASSWORD value should be created as a repository secret to prevent exposure of the value in job logs, while ANCHORECTL_URL and ANCHORECTL_USERNAME can be created as repository variables.
2. Configure Permissions
(“Settings” -> “Actions” -> “General” -> “Workflow permissions”) select “Read and write permissions” and click “Save”.
3. Create config file
In your repository, create a new file ( “Add file” -> “Create new file”) and name it .github/workflows/anchorectl.yaml.
4. Set scanning mode
a) Distributed Mode
This is the most easily scalable method for scanning images. Distributed scanning uses the anchorectl utility to build the SBOM directly on the build runner and then pushes the SBOM to Anchore Enterprise through the API. To use this scanning method, paste the following workflow script into your new anchorectl.yaml file. After building the image from your Dockerfile and scanning it with anchorectl, this workflow will display vulnerabilities and policy results in the build log.
name:Anchore Enterprise Distributed Scanon:workflow_dispatch:inputs:mode:description:'On-Demand Build'env:ANCHORECTL_URL:${{ vars.ANCHORECTL_URL }}ANCHORECTL_USERNAME:${{ vars.ANCHORECTL_USERNAME }}ANCHORECTL_PASSWORD:${{ secrets.ANCHORECTL_PASSWORD }}## set ANCHORECTL_FAIL_BASED_ON_RESULTS to true if you want to break the pipeline based on the evaluationANCHORECTL_FAIL_BASED_ON_RESULTS:falseREGISTRY:ghcr.iojobs:Build:runs-on:ubuntu-lateststeps:- name:"Set IMAGE environmental variables"run:| echo "IMAGE=${REGISTRY}/${GITHUB_REPOSITORY}:${GITHUB_REF_NAME}" >> $GITHUB_ENV
- name:Checkout Codeuses:actions/checkout@v3- name:Log in to the Container registryuses:docker/login-action@v2with:registry:${{ env.REGISTRY }}username:${{ github.actor }}password:${{ secrets.GITHUB_TOKEN }} - name:Set up Docker Buildxuses:docker/setup-buildx-action@v2- name:build local containeruses:docker/build-push-action@v3with:tags:${{ env.IMAGE }}push:trueload:falseAnchore:runs-on:ubuntu-latestneeds:Buildsteps:- name:"Set IMAGE environmental variables"run:| echo "IMAGE=${REGISTRY}/${GITHUB_REPOSITORY}:${GITHUB_REF_NAME}" >> $GITHUB_ENV
- name:Checkout Code### only need to do this if you want to pass the dockerfile to Anchore during scanninguses:actions/checkout@v3- name:Install Latest anchorectl Binaryrun:| mkdir -p $HOME/.local/bin
curl -sSfL "${ANCHORECTL_URL}/v2/system/anchorectl?operating_system=linux&architecture=amd64" \
-H "accept: /" | tar -zx -C $HOME/.local/bin anchorectl
echo "$HOME/.local/bin" >> $GITHUB_PATH
- name:Generate SBOM and Push to Anchorerun:| anchorectl image add --no-auto-subscribe --wait --from registry --dockerfile Dockerfile ${IMAGE}- name:Pull Vulnerability Listrun:| anchorectl image vulnerabilities ${IMAGE}
- name:Pull Policy Evaluationrun:| # set "ANCHORECTL_FAIL_BASED_ON_RESULTS=true" (see above in the "env:" section) to break the pipeline here if the
# policy evaluation returns FAIL or add -f, --fail-based-on-results to this command for the same result
#
anchorectl image check --detail ${IMAGE}
b) Centralized Mode
This method uses the “analyzer” pods in the Anchore Enterprise deployment to build the SBOM. This can create queuing if there are not enough analyzer processes, and this method may require the operator to provide registry credentials in the Enterprise backend (if the images to be scanned are in private registries). This method may be preferred in cases where the Anchore Enterprise operator does not control the image build process (the analyzers can simply poll registries to look for new image builds as they are pushed), and this method also allows the operator to simply queue up the image for asynchronous scanning later if vulnerability and policy results are not required immediately. If the user wants malware scanning results from Anchore Enterprise’s clamav integration, the Centralized Scanning method is required. To use this scanning method, paste the following workflow script into your new anchorectl.yaml file. After building the image from your Dockerfile,, this workflow will tell Anchore Enterprise to scan the image, then it will display the vulnerability and policy results in the build log.
name:Anchore Enterprise Centralized Scanon:workflow_dispatch:inputs:mode:description:'On-Demand Build'env:ANCHORECTL_URL:${{ vars.ANCHORECTL_URL }}ANCHORECTL_USERNAME:${{ vars.ANCHORECTL_USERNAME }}ANCHORECTL_PASSWORD:${{ secrets.ANCHORECTL_PASSWORD }}## set ANCHORECTL_FAIL_BASED_ON_RESULTS to true if you want to break the pipeline based on the evaluationANCHORECTL_FAIL_BASED_ON_RESULTS:falseREGISTRY:ghcr.iojobs:Build:runs-on:ubuntu-lateststeps:- name:"Set IMAGE environmental variables"run:| echo "IMAGE=${REGISTRY}/${GITHUB_REPOSITORY}:${GITHUB_REF_NAME}" >> $GITHUB_ENV
- name:Checkout Codeuses:actions/checkout@v3- name:Log in to the Container registryuses:docker/login-action@v2with:registry:${{ env.REGISTRY }}username:${{ github.actor }}password:${{ secrets.GITHUB_TOKEN }} - name:Set up Docker Buildxuses:docker/setup-buildx-action@v2- name:build local containeruses:docker/build-push-action@v3with:tags:${{ env.IMAGE }}push:trueload:falseAnchore:runs-on:ubuntu-latestneeds:Buildsteps:- name:"Set IMAGE environmental variables"run:| echo "IMAGE=${REGISTRY}/${GITHUB_REPOSITORY}:${GITHUB_REF_NAME}" >> $GITHUB_ENV
- name:Checkout Codeuses:actions/checkout@v3- name:Install Latest anchorectl Binaryrun:| mkdir -p $HOME/.local/bin
curl -sSfL "${ANCHORECTL_URL}/v2/system/anchorectl?operating_system=linux&architecture=amd64" \
-H "accept: /" | tar -zx -C $HOME/.local/bin anchorectl
echo "$HOME/.local/bin" >> $GITHUB_PATH- name:Queue Image for Scanning by Anchore Enterpriserun:| anchorectl image add --no-auto-subscribe --wait --dockerfile ./Dockerfile ${IMAGE} - name:Pull Vulnerability Listrun:| anchorectl image vulnerabilities ${IMAGE}
- name:Pull Policy Evaluationrun:| # set "ANCHORECTL_FAIL_BASED_ON_RESULTS=true" (see above in the "env:" section) to break the pipeline here if the
# policy evaluation returns FAIL or add -f, --fail-based-on-results to this command for the same result
#
anchorectl image check --detail ${IMAGE}
5. Run Workflow
Go to “Actions” -> “Anchore Enterprise with anchorectl” and hit “Run workflow”.
6. View Results
When the workflow completes, view the results by clicking on the workflow name (“Anchore Enterprise with anchorectl”), then on the job (“Anchore”), then expand the “Pull Vulnerability List” and/or “Pull Policy Evaluation” steps to see the details.
7. Notifications
You can also integrate your Anchore Enterprise deployment with the GitHub API so that Anchore Enterprise notifications are sent to GitHub Notifications as new issues in a repository.
Before getting started, you need to configure your Jenkins instance with the required credentials. Make sure the following values are added under Dashboard → Manage Jenkins → Credentials as credentials of type Secret text:
These are necessary for the integration to access your Anchore Enterprise deployment. The ANCHORECTL_PASSWORD value should be created as a repository secret to prevent exposure of the value in job logs, while ANCHORECTL_URL and ANCHORECTL_USERNAME can be created as repository variables.
Configure scanning mode
Below are examples of the two types of image scans. For a detailed explanation of their differences, refer to the Images concept page.
a) Distributed
This is the most easily scalable method for scanning images. Distributed scanning uses the anchorectl utility to build the SBOM directly on the build runner and then pushes the SBOM to Anchore Enterprise through the API. The example below demonstrates how to automate distributed analysis within a pipeline.
pipeline {// Define parameters for user input
parameters { string(name:'REGISTRY',defaultValue:'docker.io',description:'The container registry to use.',trim:true) string(name:'REPOSITORY',defaultValue:'library/nginx',description:'The image repository path.',trim:true) string(name:'TAG',defaultValue:'latest',description:'The image tag to analyze.',trim:true) choice(name:'ANCHORECTL_QUIET',choices:['true','false'],description:'Suppress anchorectl informational messages.') choice(name:'ANCHORECTL_FORMAT',choices:['json','csv'],description:'The output format for anchorectl (e.g., json, csv).') choice(name:'ANCHORECTL_FAIL_BASED_ON_RESULTS',choices:['true','false'],description:'How to handle fail signals (e.g., policy check outcomes)')} stages { stage('Anchore Image Scan'){ environment {// This is the AnchoreCTL service endpoint (fetched securely from Jenkins credentials)
ANCHORECTL_URL = credentials('ANCHORECTL_URL')// Define the Anchore account username
ANCHORECTL_USERNAME = credentials('ANCHORECTL_USERNAME')// Define the Anchore account password
ANCHORECTL_PASSWORD = credentials('ANCHORECTL_PASSWORD')// Whether to fail the pipeline based on AnchoreCTL scan results (controlled by Jenkins parameter)
ANCHORECTL_FAIL_BASED_ON_RESULTS ="${params.ANCHORECTL_FAIL_BASED_ON_RESULTS}"// You can also choose to Suppress unnecessary output logs
ANCHORECTL_QUIET ="${params.ANCHORECTL_QUIET}"// Define the Output format for AnchoreCTL results
ANCHORECTL_FORMAT ="${params.ANCHORECTL_FORMAT}"} steps { script { echo 'Starting image analysis pipeline.'// Download and configure the Anchore CLI
sh '''
mkdir -p $HOME/.local/bin
curl -sSfL "${ANCHORECTL_URL}v2/system/anchorectl?operating_system=linux&architecture=amd64" \\
-H "accept: /" | tar -zx -C $HOME/.local/bin anchorectl
export PATH="$HOME/.local/bin:$PATH"
'''// Add the image to Anchore and wait for analysis to complete
sh "anchorectl image add --wait --from registry ${params.REGISTRY}/${params.REPOSITORY}:${params.TAG}"// Retrieve and archive vulnerability report
sh "anchorectl image vulnerabilities ${params.REGISTRY}/${params.REPOSITORY}:${params.TAG} | tee vulnerabilities.${ANCHORECTL_FORMAT}" archiveArtifacts artifacts:"vulnerabilities.${env.ANCHORECTL_FORMAT}"// Run and archive the policy check
sh """#!/bin/bash
set -o pipefail
anchorectl image check --detail ${params.REGISTRY}/${params.REPOSITORY}:${params.TAG} | tee policy-check.${ANCHORECTL_FORMAT}
""" archiveArtifacts artifacts:"policy-check.${env.ANCHORECTL_FORMAT}"// Post-build action to handle policy failure, if configured
if(env.ANCHORECTL_FAIL_BASED_ON_RESULTS =='true'){def policyCheckResult = sh(script:"grep -q 'Policy Evaluation: PASS' policy-check.${ANCHORECTL_FORMAT}",returnStatus:true)if(policyCheckResult !=0){ error('Policy check failed based on results.')}}}}}}}
b) Centralized
Centralized Scanning uses analyzer pods in Anchore Enterprise to generate the SBOM. This method is ideal when the operator does not control the image build process, supports asynchronous scanning, and is required for malware detection through ClamAV. After your container image is built, you can trigger a scan by adding the provided stage to your pipeline, which will instruct Anchore Enterprise to analyze the image and display vulnerability and policy results in the build log. Below is an example of how to achieve centralized scanning in your pipeline
pipeline {// Define parameters for user input
parameters { string(name:'REGISTRY',defaultValue:'docker.io',description:'The container registry to use.',trim:true) string(name:'REPOSITORY',defaultValue:'library/nginx',description:'The image repository path.',trim:true) string(name:'TAG',defaultValue:'latest',description:'The image tag to analyze.',trim:true) choice(name:'ANCHORECTL_QUIET',choices:['true','false'],description:'Suppress anchorectl informational messages.') choice(name:'ANCHORECTL_FORMAT',choices:['json','csv'],description:'The output format for anchorectl (e.g., json, csv).') choice(name:'ANCHORECTL_FAIL_BASED_ON_RESULTS',choices:['true','false'],description:'How to handle fail signals (e.g., policy check outcomes)')} stages { stage('Anchore Image Scan'){ environment {// This is the AnchoreCTL service endpoint (fetched securely from Jenkins credentials)
ANCHORECTL_URL = credentials('ANCHORECTL_URL')// Define the Anchore account username
ANCHORECTL_USERNAME = credentials('ANCHORECTL_USERNAME')// Define the Anchore account password
ANCHORECTL_PASSWORD = credentials('ANCHORECTL_PASSWORD')// Whether to fail the pipeline based on AnchoreCTL scan results (controlled by Jenkins parameter)
ANCHORECTL_FAIL_BASED_ON_RESULTS ="${params.ANCHORECTL_FAIL_BASED_ON_RESULTS}"// You can also choose to Suppress unnecessary output logs
ANCHORECTL_QUIET ="${params.ANCHORECTL_QUIET}"// Define the Output format for AnchoreCTL results
ANCHORECTL_FORMAT ="${params.ANCHORECTL_FORMAT}"} steps { script { echo "Starting image analysis for: ${params.REGISTRY}/${params.REPOSITORY}:${params.TAG}"// Download and configure the Anchore CLI
sh '''
mkdir -p $HOME/.local/bin
curl -sSfL "${ANCHORECTL_URL}v2/system/anchorectl?operating_system=linux&architecture=amd64" \\
-H "accept: /" | tar -zx -C $HOME/.local/bin anchorectl
export PATH="$HOME/.local/bin:$PATH"
'''// Add the image to Anchore and wait for analysis to complete
sh "anchorectl image add --wait ${params.REGISTRY}/${params.REPOSITORY}:${params.TAG}"// Retrieve and archive vulnerability report
sh "anchorectl image vulnerabilities ${params.REGISTRY}/${params.REPOSITORY}:${params.TAG} | tee vulnerabilities.${ANCHORECTL_FORMAT}" archiveArtifacts artifacts:"vulnerabilities.${env.ANCHORECTL_FORMAT}"// Run and archive the policy check
sh """#!/bin/bash
set -o pipefail
anchorectl image check --detail ${params.REGISTRY}/${params.REPOSITORY}:${params.TAG} | tee policy-check.${ANCHORECTL_FORMAT}
""" archiveArtifacts artifacts:"policy-check.${env.ANCHORECTL_FORMAT}"// Post-build action to handle policy failure, if configured
if(env.ANCHORECTL_FAIL_BASED_ON_RESULTS =='true'){def policyCheckResult = sh(script:"grep -q 'Policy Evaluation: PASS' policy-check.${ANCHORECTL_FORMAT}",returnStatus:true)if(policyCheckResult !=0){ error('Policy check failed based on results.')}}}}}}}
Visualize Vulnerabilities with the Warnings NG Plugin
The Jenkins Warnings Next Generation plugin (warnings-ng) can parse anchorectl vulnerability output and surface findings as tracked issues directly in the Jenkins UI — complete with trend graphs, per-build issue counts, and configurable quality gates.
Prerequisites
Jenkins Warnings Next Generation plugin installed (Manage Jenkins → Plugins → Available plugins, search for “Warnings Next Generation”)
Vulnerability report (snake_case keys) from a previously analyzed image
a) One-Time Scan
Use anchorectl image one-time-scan to analyze an image against Anchore Enterprise policies without adding it to the image inventory.
pipeline { agent any
stages { stage('Anchore One-Time Scan'){ environment { ANCHORECTL_URL = credentials('ANCHORECTL_URL') ANCHORECTL_USERNAME = credentials('ANCHORECTL_USERNAME') ANCHORECTL_PASSWORD = credentials('ANCHORECTL_PASSWORD')} steps { script { sh '''
mkdir -p $HOME/.local/bin
curl -sSfL "${ANCHORECTL_URL}v2/system/anchorectl?operating_system=linux&architecture=amd64" \
-H "accept: /" | tar -zx -C $HOME/.local/bin anchorectl
export PATH="$HOME/.local/bin:$PATH"
''' sh 'anchorectl image one-time-scan -o json docker.io/library/nginx:latest | tee vulnerabilities.json'}}}} post { always { recordIssues(tools:[anchoreCtl()])}}}
b) Image Add and Vulnerabilities
Use anchorectl image add to submit an image to Anchore Enterprise for centralized analysis. Once analysis is complete, retrieve the vulnerability report with anchorectl image vulnerabilities and save it to a file the plugin can detect.
Anchore severity levels are mapped to Jenkins issue severities as follows:
Anchore Severity
Jenkins Severity
Critical
ERROR
High
WARNING_HIGH
Medium
WARNING_NORMAL
Low, Negligible
WARNING_LOW
To fail the build when a severity threshold is exceeded, add a qualityGates parameter to the recordIssues step. See the Warnings NG plugin documentation for details.
Kubernetes can be configured to use an Admission Controller to validate that the container image is compliant with the user’s policy before allowing or preventing deployment.
Anchore Enterprise can be integrated with Kubernetes to ensure that only certified images are started within a cluster. The admission controller can be configured to make a webhook call into Anchore Enterprise. Anchore Enterprise exports a Kubernetes-specific API endpoint and will return the pass or fail response in the form of an ImageReview response. This approach allows the Kubernetes system to make the final decision on running a container image and does not require installation of any per-node plugins into Kubernetes.
Using native Kubernetes features allows the admission controller approach to be used in both on-prem and cloud-hosted Kubernetes environments.
Getting Started
Full information on installation and configuration of the Anchore Kubernetes Admission Controller can be found here.
The Anchore Kubernetes Admission Controller is a licensed add-on, please make sure you have a valid runtime license entitlement.
Modes of Operation
The Anchore admission controller supports 3 different modes of operation allowing you to tune the tradeoff between control and intrusiveness for your environments.
Strict Policy-Based Admission Gating Mode
This is the strictest mode, and will admit only images that are already analyzed by Anchore Enterprise and receive a “pass” on policy evaluation. This enables you to ensure, for example, that no image is deployed into the cluster that has a known high-severity CVE with an available fix, or any of several other conditions. The Anchore Enterprise policy language supports sophisticated conditions on the properties of images, vulnerabilities, and metadata.
Analysis-Based Admission Gating Mode
Admit only images that are analyzed and known to Anchore, but do not execute or require a policy evaluation. This is useful in cases where you’d like to enforce requirement that all images be deployed via a CI/CD pipeline, for example, that itself manages the image scanning with Anchore, but allowing the CI/CD process to determine what should run based on other factors outside the context of the image or k8s itself.
Passive Analysis Trigger Mode
Trigger an Anchore analysis of images, but to no block execution on analysis completion or policy evaluation of the image. This is a way to ensure that all images that make it to deployment (test, staging, or prod) are guaranteed to have some form of analysis audit trail available and a presence in reports and notifications that are managed by Anchore. Image records in Anchore are given an annotation of “requestor=anchore-admission-controller” to help track their provenance.
3.2 - Kubernetes Runtime Inventory
Overview
The Anchore Kubernetes Inventory Agent is a licensed add-on, please make sure you have a valid runtime license entitlement.
Using Anchore’s runtime inventory agents provides Anchore Enterprise access to what images are being used
in your deployments. This can help give insight into where vulnerabilities or policy violations are in your
production workloads.
Anchore uses a go binary called anchore-k8s-inventory that leverages the Kubernetes Go SDK
to reach out and list containers in a configurable set of namespaces to determine which images are running.
anchore-k8s-inventory can be deployed via its helm chart, embedded within your Kubernetes cluster as an agent. It will require access to the Anchore Enterprise API.
General Runtime Configuration
Getting Started
The most common way to track inventory is to install anchore-k8s-inventory as an agent in your cluster. To do this you will need to configure credentials
and information about your deployment in the values file. It is recommended to first configure a specific robot user
for the account where you’ll want to track your Kubernetes inventory.
As an agent anchore-k8s-inventory is installed using helm and the helm chart is hosted as part of the https://charts.anchore.io repo.
It is based on the anchore/k8s-inventory docker image.
To install the helm chart, follow these steps:
Configure your username, password, Anchore account, Anchore URL and cluster name in the values file.
k8sInventory:# Path should not be changed, cluster value is used to tell Anchore which cluster this inventory is coming fromkubeconfig:cluster:<unique-name-for-your-cluster>anchoreRegistration:#RegistrationId: ""IntegrationName:"<unique-name-for-your-cluster>"IntegrationDescription:""anchore:url:<URL for your># Note: recommend using the inventory-agent roleuser:<user>password:<password>account:<account>
Run helm install in the cluster(s) you wish to track
anchore-k8s-inventory must be able to resolve the Anchore URL and requires API credentials. Review the anchore-k8s-inventory logs if you are not able to see the inventory results in the UI.
Note: the Anchore Enterprise API Password can be provided via a Kubernetes secret, or injected into the environment of the anchore-k8s-inventory container
For injecting the environment variable, see: injectSecretsViaEnv
For providing your own secret for the Anchore Enterprise API Password, see: useExistingSecret. K8s Inventory creates it’s own secret based on your values.yaml file for key k8sInventory.anchore.password, but the k8sInventory.useExistingSecret key allows you to create your own secret and provide it in the values file. See the K8s Inventory repo for more information about the K8s Inventory specific configuration
Usage
To verify that you are tracking Kubernetes Inventory you can access inventory results with the command anchorectl inventory list and look for results where the TYPE is kubernetes.
The UI also displays the Kubernetes Inventory and allows operators to visually navigate the images, vulnerability results, and see the results of the policy evaluation.
For more details about watching clusters, and reviewing policy results see the Using Kubernetes Inventory section.
Inventory Time-To-Live
As part of reporting on your runtime environment, Anchore Enterprise maintains an active record of the containers, the images they run,
and other related metadata based on time they were last reported by an inventory agent.
The configuration setting below allow you to specify how long inventory should remain part of the Catalog Service’s working set.
These are the default settings found in the values file.
For each cluster/namespace reported from the inventory agent, the system will delete any previously reported
containers and images and replace it with the new inventory.
Note: The inventory_ttl_days is still needed to remove any cluster/namespaces that are no longer reported as well as
some of the supporting metadata (ie. pods, nodes). This value should be configured to be long enough that inventory isn’t incorrectly removed in case of an outage from the reporting agent.
The exact value depends on each deployment, but 7 days is a reasonable value here.
This will delete any container and image that has not been reported by an agent in the last 14 days. This includes its supporting metadata (ie. pods, nodes).
This will keep any containers, images, and supporting metadata reported by an inventory agent indefinitely.
Deleting Inventory via API
Where it is not desirable to wait for the Image TTL to remove runtime inventory images it is possible to manually delete inventory items via the API by issuing a DELETE to /v2/inventories with the following query parameters.
inventory_type (required) - either ecs or kubernetes
context (required) - it must match a context as seen by the output of anchorectl inventory list
Kubernetes - this is a combination of cluster name (as defined by the anchore-k8s-inventory config) and a namespace containing running containers e.g. cluster1/default.
ECS - this is the cluster ARN e.g. arn:aws:ecs:eu-west-2:123456789012:cluster/myclustername
image_digest (optional) - set if you only want to remove a specific image
e.g. DELETE /v2/inventories?inventory_type=<string>&context=<string>&image_digest=<string>
Using curl: curl -X DELETE -u username:password "http://<servername:port>/v2/inventories?inventory_type=&context=&image_digest=
Agents
Anchore Enterprise provides agents for collecting the inventory of different container runtime environments:
Anchore uses a go binary called anchore-ecs-inventory that leverages the AWS Go SDK
to gather an inventory of containers and their images running on Amazon ECS and report back to Anchore Enterprise.
The Amazon ECS Inventory Agent can be installed via Helm Chart or as an ECS Service on AWS Fargate.
The Anchore Amazon ECS Inventory Agent is a licensed add-on, please make sure you have a valid runtime license entitlement.
Deploying via Helm on Kubernetes
You can install the chart via the Anchore Enterprise repository:
Follow the AWS instructions found here to assign your IAM role to a Kubernetes service account in your cluster where the Anchore ECS Inventory Agent will be running. Then configure the following in your values.yaml to ensure the agent has access to the ECS service API:
serviceAccountName:"service_account_name"
Using existing secrets
For those users unable to use IAM roles (e.g. the ECS Inventory Agent is not running on Kubernetes or ECS), the (ecsInventory.useExistingSecret and ecsInventory.existingSecretName) or ecsInventory.injectSecretsViaEnv keys allows you to create your own secret and provide it in the values file or place the required secret into the pod via different means such as injecting the secrets into the pod using hashicorp vault. For example:
You can deploy the ecs-inventory container as an ECS Service on AWS Fargate. Running the agent as a service ensures that ECS automatically restarts the task if it stops, maintaining continuous inventory reporting to Anchore Enterprise.
Deploying as an ECS Service is recommended over running a standalone task. A service maintains the desired task count and automatically replaces unhealthy tasks, ensuring uninterrupted inventory collection.
Set Environment Variables
Set the following environment variables before running the commands below. Replace the placeholder values with your own.
The security group must allow outbound access to your Anchore Enterprise deployment. No inbound rules are required as the agent only makes outbound connections.
Create IAM Roles and Policies
Create the IAM policy, roles, and permissions required by the ECS task.
To verify that you are tracking Amazon ECS inventory in your Anchore Enterprise deployment you can access inventory results with the command anchorectl inventory list and look for results where the TYPE is ecs.
Auto analyze new inventory
It is possible to create a subscription to watch for new Amazon ECS inventory that is reported to Anchore Enterprise and automatically schedule those images for
analysis. The subscription_key can be set to any part of an Amazon ECS ClusterARN. For example setting the subscription_key to the:
full ClusterARN arn:aws:ecs:us-east-1:012345678910:cluster/telemetry will create a subscription that only watches this cluster
partial ClusterARN arn:aws:ecs:eu-west-2:988505687240 will result in a subscription that watches every cluster within the account 988505687240
All ECS clusters arn:aws:ecs effectively auto-subscribes all ECS runtime agents.
For AWS GovCloud regions, the ARN partition is aws-us-gov instead of aws. For example, use arn:aws-us-gov:ecs to subscribe to all GovCloud ECS clusters, or arn:aws-us-gov:ecs:us-gov-west-1:012345678910:cluster/telemetry for a specific cluster.
This documentation serves as a comprehensive reference for integrating Anchore Enterprise with ServiceNow’s Container Vulnerability Response (CVR) module. This integration enables organizations to “hydrate” ServiceNow with Anchore security data, allowing teams to utilize their established vulnerability grouping, reporting, and remediation workflows for containerized assets.
Overview and Release Information
Anchore provides a dedicated plugin that bridges the gap between Anchore Enterprise scans and ServiceNow Security Operations (SecOps).
Availability: Accessible via GitHub for licensed Anchore customers. Version Support: Anchore Enterprise v5.x and later. Source Code:https://github.com/anchore/servicenow (private)
Anchore SNOW Integrations
Anchore currently focuses on the Security Operations (SecOps) side of the ServiceNow platform:
ServiceNow Container Vulnerability Response (CVR) Vulnerabilities identified in container images are pulled into ServiceNow CVR via the Anchore CVR plugin.
ServiceNow IT Service Management (ITSM) Anchore does not currently provide a native SNOW ITSM integration for automatic ticket generation.
Installation and Setup
Prerequisites
Ensure the following ServiceNow applications are active before installation:
Vulnerability Response
Vulnerability Response and Configuration Compliance for Containers
Vulnerability Response Integration with NVD
Deployment Steps
The integration is installed directly from GitHub into the ServiceNow Studio application:
Select Import from Source Control
URL: https://github.com/anchore/servicenow/
Branch: snow_import (fully bundled application)
Credentials:
Create a GitHub Personal Access Token
In ServiceNow, navigate to Connections & Credentials > Credentials
DefectDojo is an open source application vulnerability management platform that streamlines the handling of security findings from various tools, including seamless integration with Anchore Enterprise.
Anchore Enterprise vulnerability and policy reports, whether obtained through the UI or using anchorectl, can be seamlessly parsed and imported into DefectDojo for centralized vulnerability management.
Importing Anchore Enterprise analysis Data into DefectDojo
Data from Anchore Enterprise can be ingested into DefectDojo in a number of ways:
The upload of vulnerability or policy reports obtained via the Anchore Enterprise GUI
The upload of vulnerability or policy reports obtained via anchorectl
By utilizing the Anchore Enterprise API to automatical pull vulnerability and policy reports from Anchore Enterprise
Downloaded reports from Anchore Enterprise GUI or anchorectl can be uploaded to DefectDojo by selecting the appropriate parser during the import process. For more details on available DefectDojo and Anchore parsers, see: DefectDojo Integration.
Downloading Vulnerability report from Anchore Enterprise GUI
To download vulnerability report data from Anchore Enterprise GUI
Click on the “Images” icon
Select the image tag for which you want to download the vulnerability data.
Now navigate to the “Vulnerabilities” section, Click on “Vulnerability Report” to download the report.
Download the report in JSON format, then proceed to import it into DefectDojo.
Downloading Vulnerability and Policy report via anchorectl
To download vulnerability report using anchorectl run the following:
For more details on how to automate this process using DefectDojo API, see: DefectDojo API usage.
7 - Data Stream
Overview
The Anchore Data Stream provides a mechanism to stream security data from Anchore Enterprise to external systems
for further processing, analysis, and long-term storage. As image vulnerability scans and policy evaluations occur
within Anchore Enterprise, the data is captured and written to files. These files are monitored by a sidecar
service (such as Fluent Bit). The sidecar service reads the data from the files and forwards the events
to external destinations like Splunk, Elasticsearch, or other SIEM platforms.
This feature enables you to integrate:
Real-time Security Monitoring: Stream vulnerability discoveries and policy violations as they occur
Centralized Log Management: Aggregate Anchore Enterprise security data with other infrastructure logs
Custom Dashboards: Build security dashboards in your preferred analytics platform
Compliance Reporting: Maintain audit trails of security events for compliance requirements
Alerting Integration: Trigger alerts based on critical vulnerability discoveries or policy failures
Architecture
The data streaming pipeline consists of three components:
Anchore Enterprise (Reports Worker) → Data Event Files → Fluent Bit Sidecar → External Destination
Reports Worker: Security data to NDJSON (newline-delimited JSON) files
Data Event Files: Rotating log files stored on a shared volume, with automatic cleanup of processed files
Fluent Bit: A lightweight log forwarder that tails the data event files and forwards them to your destination
Data Event Types
The following system data events are streamed:
Data Event Type
Description
Image Vulnerability Scan Results
Changes to the vulnerability scan results including CVE IDs, severity, fix availability, and affected packages
Image Policy Evaluation Findings
Changes to the policy evaluation results including pass/fail status, triggered gates, and findings
The Data Event Stream feature is configured through the Anchore Enterprise configuration file or Helm values. This page covers the configuration options for enabling event streaming and customizing its behavior.
Prerequisites
Before enabling the event stream:
Ensure you have a valid license with the Data Stream entitlement
Plan your shared volume strategy for the data event files. Maximum file size and count will impact storage requirements.
Determine your destination system (Splunk, Elasticsearch, etc.)
Configuration
Ports
Component
Port
Purpose
Fluent Bit Health
2020
Health checks and metrics endpoint
(example) Splunk HEC
8088
HTTP Event Collector ingestion
Shard Data Files
Path
Description
/var/log/anchore/events/
Default directory for data event files
/var/log/anchore/events/events.json.*
Rotating data event files (timestamped)
/var/log/anchore/events/offsets.db
Fluent Bit file position tracking database
Helm Values (Kubernetes)
To enable event streaming in a Kubernetes deployment using Helm, add the following to your values.yaml:
The event_stream_health cycle timer must be configured for proper operation. Without it processed files will not be cleaned up.
Volume Configuration
The Reports Worker and the Fluent Bit sidecar must have read/write access to the data event directory.
Kubernetes
Create a shared volume between the Reports Worker and Fluent Bit:
# In your Helm values or deployment manifestvolumes:- name:anchore-eventsemptyDir:{}# Reports Worker containervolumeMounts:- name:anchore-eventsmountPath:/var/log/anchore# Fluent Bit containervolumeMounts:- name:anchore-eventsmountPath:/var/log/anchore
Data event files are rotated based on the max_file_size_mb setting. When a file reaches the maximum size, a new file
is created with a timestamp suffix:
The max_file_count setting determines how many files are retained. Older files are deleted after they have been
processed by Fluent Bit (tracked via the position database).
Health Monitoring
The data stream health watcher runs at the interval specified by event_stream_health and performs the following tasks:
Cleanup: Removes event files that have been fully processed by Fluent Bit
Emitter Resume Detection: Detects when the data_stream has been suspended and allows it to resumes processing when possible
Viewing Integration Status
The system event notification system provides events related to the data stream health. You can view these events via the API or UI.
Filter on event type system.event_stream.suspend and system.event_stream.resume to see suspension and resumption events.
Verification
After enabling event streaming, verify it is working:
Step 1: Analyze an Image
Analyze a new image to generate vulnerability and policy events:
Step 2: Check Data Event Files
You should see one or more event files with the pattern events.json.*.
Examples below:
# Kuberneteskubectl exec -it <reports-worker-pod> -- ls -la /var/log/anchore/events/
Defaulted container "enterprise-reportsworker" out of: enterprise-reportsworker, fluent-bit (init)total 51680drwxrwsrwx. 2 root anchore 104 Jan 10 18:17 .
drwxrwxr-x. 1 anchore root 113 Jan 10 15:15 ..
-rw-r--r--. 1 anchore anchore 35440931 Jan 10 18:41 events.json.20260110T181643Z
-rw-r--r--. 1 anchore anchore 8192 Jan 10 18:02 offsets.db
-rw-r--r--. 1 anchore anchore 32768 Jan 10 18:41 offsets.db-shm
-rw-r--r--. 1 anchore anchore 4120032 Jan 10 18:41 offsets.db-wal
# Dockerdocker exec <reports-worker-container> ls -la /var/log/anchore/events/
total 5092drwxr-xr-x 2 root root 4096 Jan 10 18:29 .
drwxrwxr-x 3 anchore root 4096 Jan 10 15:21 ..
-rw-r--r-- 1 root root 5163541 Jan 10 15:26 events.json.20260110T152612Z
-rw-r--r-- 1 root root 8192 Jan 10 17:53 offsets.db
-rw-r--r-- 1 root root 32768 Jan 10 18:29 offsets.db-shm
-rw-r--r-- 1 root root 0 Jan 10 18:29 offsets.db-wal
****
Troubleshooting
No Event Files Created
Verify enabled: true is set in the configuration
Check that the Reports Worker has write permissions to the directory
Ensure the event_stream_health cycle timer is configured
Check Reports Worker logs for errors
Events Not Being Processed
Verify Fluent Bit is running and can read the event files
Check the position database (offsets.db) exists and is being updated
Review Fluent Bit logs for connection or parsing errors
Data Stream is Suspended
If the data stream becomes suspended due to unprocessed files accumulating, consider:
Increase max_file_size_mb to buffer more date and allow fluent bit to catch up
Increase max_file_count to retain more files during high-volume periods
Ensure Fluent Bit is keeping up with event production
Fluent Bit is a lightweight, high-performance log processor and forwarder that serves as the bridge between Anchore Enterprise
Enterprise event files and your destination system. This guide covers deploying Fluent Bit as a sidecar container to
forward events to external systems.
Add a Fluent Bit sidecar to your Anchore Enterprise deployment by modifying your Helm values:
reportsWorker:extraVolumes:- name:anchore-eventsemptyDir:{}- name:fluent-bit-configconfigMap:name:fluent-bit-configdefaultMode:0644# A LUA script can be added for ETL but the script is not provided#- name: fluent-bit-lua-helpers# configMap:# name: fluent-bit-lua-helpers# defaultMode: 0644extraVolumeMounts:- name:anchore-eventsmountPath:/var/log/anchore/eventsinitContainers:- name:fluent-bitimage:fluent/fluent-bit:latestimagePullPolicy:IfNotPresentrestartPolicy:Alwaysports:- containerPort:2020name:metricsprotocol:TCPvolumeMounts:- name:fluent-bit-configmountPath:/fluent-bit/etc/fluent-bit.confsubPath:fluent-bit.confreadOnly:true- name:fluent-bit-configmountPath:/fluent-bit/etc/parsers.confsubPath:parsers.confreadOnly:true# A LUA script can be added for ETL but the script is not provided#- name: fluent-bit-lua-helpers# mountPath: /fluent-bit/etc/anchore_helpers.lua# subPath: anchore_helpers.lua- name:anchore-eventsmountPath:/var/log/anchore/events
Create a ConfigMap for Fluent Bit configuration:
apiVersion:v1kind:ConfigMapmetadata:name:fluent-bit-configdata:fluent-bit.conf:| [SERVICE]
Flush 1
Daemon Off
Log_Level info
Parsers_File parsers.conf
HTTP_Server On
HTTP_Listen 0.0.0.0
HTTP_Port 2020
[INPUT]
Name tail
Path /var/log/anchore/events/events.json.*
Tag anchore.events
Parser json
DB /var/log/anchore/events/offsets.db
Mem_Buf_Limit 64MB
Buffer_Chunk_Size 32MB
Buffer_Max_Size 64MB
Skip_Long_Lines Off
Refresh_Interval 10
Rotate_Wait 5
Read_from_Head On
[FILTER]
Name modify
Match anchore.events
Add anchore_service reports_worker
# A LUA script can be added for ETL but the script is not provided
#[FILTER]
# Name lua
# Match anchore.events
# Script /fluent-bit/etc/anchore_helpers.lua
# Call split_and_wrap
[OUTPUT]
Name splunk
Match anchore.events
Host ${SPLUNK_HEC_HOST}
Port ${SPLUNK_HEC_PORT}
TLS On
TLS.Verify On
Splunk_Token ${SPLUNK_HEC_TOKEN}
Splunk_Send_Raw Off
Event_Host anchore-enterprise
Event_Sourcetype anchore:events
Retry_Limit 5parsers.conf:| [PARSER]
Name json
Format json
Time_Key timestamp
Time_Format %Y-%m-%dT%H:%M:%S.%LZ
Time_Keep On
Docker Compose
Add Fluent Bit to your Docker Compose configuration:
Create the configuration files in a fluent-bit/ directory:
fluent-bit/fluent-bit.conf:
[SERVICE]
    Flush           1
    Daemon          Off
    Log_Level       info
    Parsers_File    parsers.conf
    HTTP_Server     On
    HTTP_Listen     0.0.0.0
    HTTP_Port       2020

[INPUT]
    Name            tail
    Path            /var/log/anchore/events/events.json.*
    Tag             anchore.events
    Parser          json
    DB              /var/log/anchore/events/offsets.db
    Mem_Buf_Limit   64MB
    Buffer_Chunk_Size 32MB
    Buffer_Max_Size 64MB
    Skip_Long_Lines Off
    Refresh_Interval 10
    Rotate_Wait     5
    Read_from_Head  On

[FILTER]
    Name            modify
    Match           anchore.events
    Add             anchore_service reports_worker

[OUTPUT]
    Name            splunk
    Match           anchore.events
    Host            ${SPLUNK_HEC_HOST}
    Port            ${SPLUNK_HEC_PORT}
    TLS             On
    TLS.Verify      On
    Splunk_Token    ${SPLUNK_HEC_TOKEN}
    Splunk_Send_Raw Off
    Event_Host      anchore-enterprise
    Event_Sourcetype anchore:events
    Retry_Limit     5
fluent-bit/parsers.conf:
[PARSER]
    Name        json
    Format      json
    Time_Key    timestamp
    Time_Format %Y-%m-%dT%H:%M:%S.%LZ
    Time_Keep   On
Configuration Reference
Input Configuration
The tail input plugin monitors event files and tracks read positions:
Parameter
Value
Description
Name
tail
Use the tail input plugin
Path
/var/log/anchore/events/events.json.*
Pattern matching event files
Tag
anchore.events
Tag for routing to outputs
Parser
json
Parse each line as JSON
DB
/var/log/anchore/events/offsets.db
SQLite database for position tracking
Mem_Buf_Limit
64MB
Memory buffer limit
Buffer_Chunk_Size
32MB
Buffer chunk size for reading
Buffer_Max_Size
64MB
Maximum buffer size per file
Read_from_Head
On
Read from beginning for new files
Refresh_Interval
10
Seconds between file checks
Rotate_Wait
5
Seconds to wait before processing rotated files
Buffer Sizing
Vulnerability reports can be large (10-100+ KB per event). The buffer settings should accommodate your largest expected events:
Event Type
Typical Size
Recommended Buffer
Vulnerability Report (few CVEs)
10-50 KB
32 MB
Vulnerability Report (many CVEs)
100-500 KB
64 MB
Vulnerability Report (large image)
500 KB - 2 MB
128 MB
Policy Evaluation
5-20 KB
32 MB
For large images with many vulnerabilities, increase the buffer settings:
[OUTPUT]
    Name            splunk
    Match           anchore.events
    Host            ${SPLUNK_HEC_HOST}
    Port            ${SPLUNK_HEC_PORT}
    TLS             On
    TLS.Verify      On
    Splunk_Token    ${SPLUNK_HEC_TOKEN}
Elasticsearch
[OUTPUT]
    Name            es
    Match           anchore.events
    Host            elasticsearch.example.com
    Port            9200
    Index           anchore-events
    Type            _doc
    TLS             On
    TLS.Verify      On
    HTTP_User       ${ES_USER}
    HTTP_Passwd     ${ES_PASSWORD}
HTTP (Generic Webhook)
[OUTPUT]
    Name            http
    Match           anchore.events
    Host            webhook.example.com
    Port            443
    URI             /api/events
    Format          json
    TLS             On
    TLS.Verify      On
    Header          Authorization Bearer ${API_TOKEN}
Stdout (Debugging)
For troubleshooting, add stdout output to see events in container logs:
[OUTPUT]
    Name            stdout
    Match           anchore.events
    Format          json_lines
Filtering and Transformation
Adding Metadata
Add custom fields to all events:
[FILTER]
    Name            modify
    Match           anchore.events
    Add             environment production
    Add             cluster_name my-cluster
    Add             anchore_service reports_worker
Filtering by Event Type
Route different event types to different outputs:
[FILTER]
    Name            rewrite_tag
    Match           anchore.events
    Rule            $event ^(image\.vulnerability_report)$ vuln.$1 false
    Rule            $event ^(tag\.policy_evaluation)$ policy.$1 false

[OUTPUT]
    Name            splunk
    Match           vuln.*
    Host            ${SPLUNK_HEC_HOST}
    Splunk_Token    ${VULN_TOKEN}
    Event_Index     vulnerabilities

[OUTPUT]
    Name            splunk
    Match           policy.*
    Host            ${SPLUNK_HEC_HOST}
    Splunk_Token    ${POLICY_TOKEN}
    Event_Index     policy_evaluations
This guide covers integrating Anchore Enterprise data streaming with Splunk using the HTTP Event Collector (HEC). Once configured, vulnerability reports and policy evaluations will flow into Splunk for search, alerting, and dashboard visualization.
Configure Fluent Bit to forward events to Splunk HEC:
[OUTPUT]
    Name            splunk
    Match           anchore.events
    Host            ${SPLUNK_HEC_HOST}
    Port            ${SPLUNK_HEC_PORT}
    TLS             On
    TLS.Verify      On
    Splunk_Token    ${SPLUNK_HEC_TOKEN}
    Splunk_Send_Raw Off
    Event_Host      anchore-enterprise
    Event_Sourcetype anchore:events
    Event_Index     anchore_events
    Retry_Limit     5
Configuration Options
Parameter
Description
Example
Host
Splunk HEC hostname
splunk.example.com
Port
Splunk HEC port
8088
TLS
Enable TLS encryption
On
TLS.Verify
Verify TLS certificates
On
Splunk_Token
HEC authentication token
your-token-here
Splunk_Send_Raw
Send raw JSON events
Off
Event_Host
Host field value in Splunk
anchore-enterprise
Event_Sourcetype
Sourcetype for events
anchore:events
Event_Index
Target Splunk index
anchore_events
Retry_Limit
Number of retry attempts
5
Environment Variables
Set these environment variables for Fluent Bit:
Variable
Description
Example
SPLUNK_HEC_HOST
Splunk HEC hostname
splunk.example.com
SPLUNK_HEC_PORT
Splunk HEC port
8088
SPLUNK_HEC_TOKEN
HEC authentication token
your-hec-token
Store the HEC token securely using Kubernetes Secrets or environment variable injection. Never commit tokens to version control.
TLS Configuration
For production deployments, always enable TLS verification:
[OUTPUT]
    Name            splunk
    ...
    TLS             On
    TLS.Verify      On
    TLS.CA_File     /path/to/ca-bundle.crt
If using self-signed certificates (not recommended for production):
[OUTPUT]
    Name            splunk
    ...
    TLS             On
    TLS.Verify      Off
Verification
Step 1: Test HEC Connectivity
Test the HEC endpoint directly:
curl -k -X POST "https://<splunk-host>:8088/services/collector/event"\
-H "Authorization: Splunk <your-token>"\
-d '{"event": "test event from anchore"}'