This is the multi-page printable view of this section. Click here to print.
Quickstarts
Get to business value quickly with our step-by-step guides.
1 - Achieve Federal ATO
How Anchore Enterprise can help obtain an ATO
Summary
Anchore Enterprise plays a crucial part in meeting Federal Authorization to Operate (ATO) requirements and Risk Management Framework (RMF). From implementation, assessment, to monitoring, Anchore Enterprise bakes in security compliance, vulnerability & malware scanning by constantly checking registries and running images to protect and enhance security posture. As industry continues to migrate to containerization and microservices, Anchore Enterprise supports multiple regulatory requirements using software bill of materials (SBOM) and policy as code to meet the demands through automated policy enforcement and continuous monitoring. SBOMs are vital to comply with Executive Order (EO) 14028 and understanding software inventory (NIST 800-53, 800-171, 800-218, and 800-190). As software delivery changes so should the ATO process by using code to ensure secure, quality, and reproducible results. Anchore Enterprise allows organizations to shift left, start secure, bake in compliance, and standardize security across the container, filesystem, virtual machine (VM), and SBOM landscape.
Security Controls
The security controls are described below with hyperlinks to the applicable documentation.
- Software Bill of Materials (SBOM)
- SBOM is essentially the ingredient list for a software product allowing the consumer to understand and manage the associated risks. Anchore Enterprise generates SBOMs during analysis and accepts externally supplied SBOMs as assets attached to app versions. SBOMs are used to maintain compliance with CM-8 Information System Component Inventory.
- Vulnerability Scanning
- Generating a vulnerability report of container images, virtual machine files, and externally supplied SBOMs that map to CVEs (Common Vulnerabilities & Exposures), KEV (Known Exploited Vulnerabilities) and EPSS (Exploit Prediction Scoring System) data. The reports reflect all applicable CVEs, if there are known exploits and the probability of a CVE being exploited.
- Secure Policy Enforcement
- Create policies for images and SBOMs to ensure that only authorized software and containers meet ATO requirements.
- DISA STIGs
- Use DISA STIGs for container images to establish and document configuration settings for images. Container images can be scanned against DISA STIGS in heimdall json format which can be easily converted using MITRE SAF™ into XCCDF and CKL files to import within STIG Viewer.
- Plan of Action & Milestones (POA&M)
- Using policies, gates, mappings and allowlists the POA&M is now enforced with dates to ensure compliance.
- CI/CD Gate Checks
- Use CI/CD pipelines to not only automate deployment but to ensure your security posture requirements are met each time, every time. Gates can be configured to only allow certain packages installed or be denied if there is a known exploit in a vulnerability.
- Role Based Access Controls (RBAC)
- Robust role based access controls using least-privilege and need-to-know.
- Kubernetes Runtime Inventory
- Always know what images are running in your kubernetes clusters and ensure they meet organizational requirements for vulnerability and policy compliance.
- Kubernetes Admission Controller
- Ensure that all container images meet policy before deployment into production.
The links below show how Anchore Enterprise helps maintain a secure posture with policy mappings to regulatory requirements.
Policy Mappings
The Anchore Enterprise policy bundles are updated annually. The current revision is v2026.1, which adds SBOM rule-set mappings to NIST 800-53, CMMC, FedRAMP, and the Secure Default policy, plus a new STOP gate for vulnerabilities on the CISA KEV list under NIST 800-53 SI-2 (Flaw Remediation). See the policy pack reference for what each bundle covers.
1.1 - POA&M
Use Anchore Enterprise to enforce a POA&M
This guide provides examples of how to setup a policy gate to enforce development teams to comply with organizational Plan of Actions & Milestones (POA&M).
The Anchore Enterprise NIST 800-53 policy bundle (revision v2026.1) ships a configurable POA&M allowlist as part of PM-4 (Plan of Action and Milestones). You can use it as-is or follow this guide to author an allowlist for your own image and CVE — the two approaches use the same rule + allowlist + expiration pattern.
The POA&M Challenge
POA&Ms can easily become an administrative nightmare to track, maintain and update. With Anchore Enterprise, POA&Ms can now be done via code configuring CI/CD policy gates that enforce compliance.
POA&M Solution
Generate an Enforceable POA&M Using Policy as Code
The example is shown using a policy from scratch but these directions could be used to add to an existing policy.
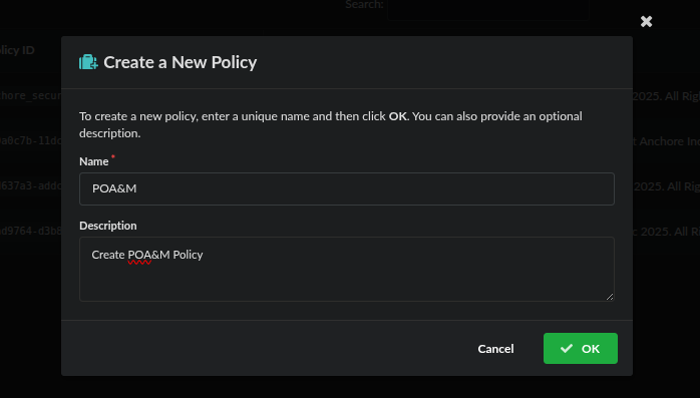
Create a new policy
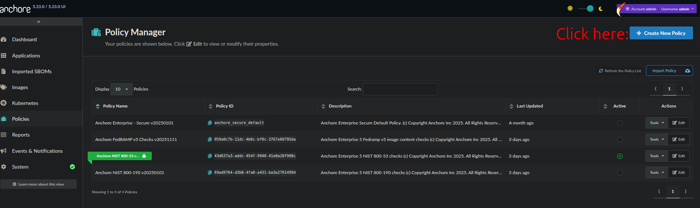
Name and describe your policy, then click save
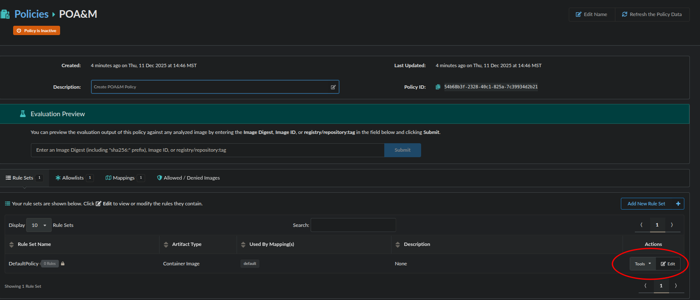
Now we will add a rule to the rule set, by clicking edit:
From here we will configure a rule:
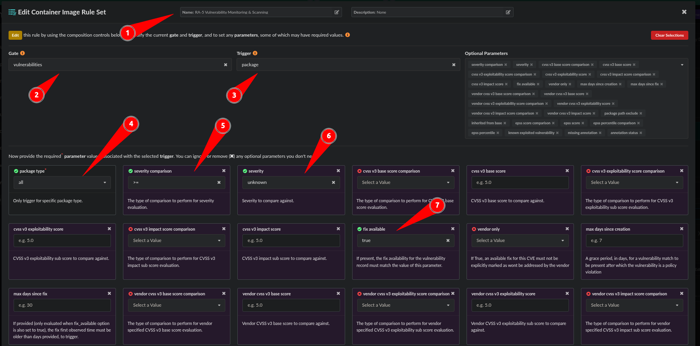
- Name the rule: RA-5 Vulnerability Monitoring & Scanning
- Gate: Vulnerabilities
- Trigger: Package
- package type: all
- severity comparison: >=
- severity: unknown
- fix available: true
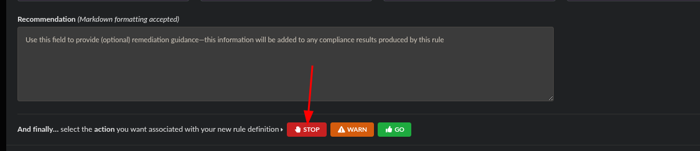
Scroll down to the bottom and click the action of STOP and click Save and Close.
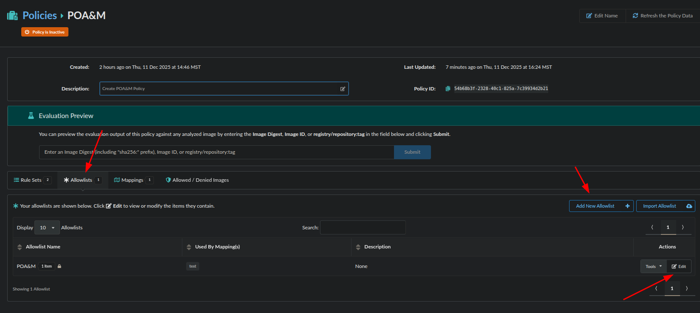
Next, we will make an Allowlists for the item we want to POA&M by editing a default Allowlist or adding a New Allowlist:
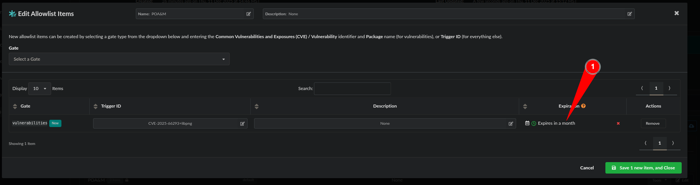
Now we will edit the Allowlist:
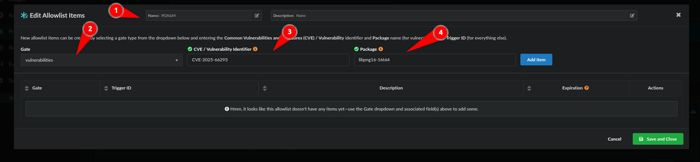
- Name the Allowlist: POA&M
- Gate: Vulnerabilities
- CVE/Vulnerability Identifier: CVE-2025-66293
- Package: libpng16-16t64
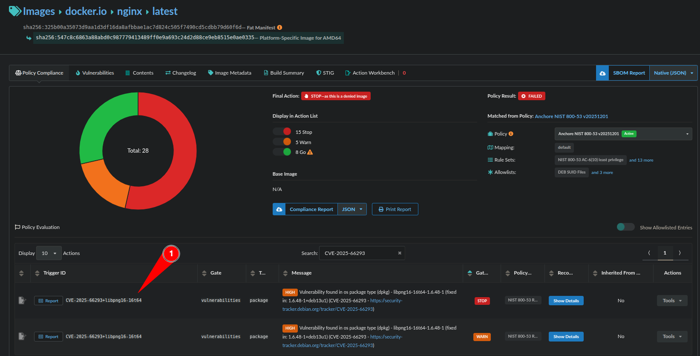
Note: Another way to get the CVE and Package information is to obtain the Trigger ID on the Policy Compliance Tab which is CVE ID+package as seen in image below:
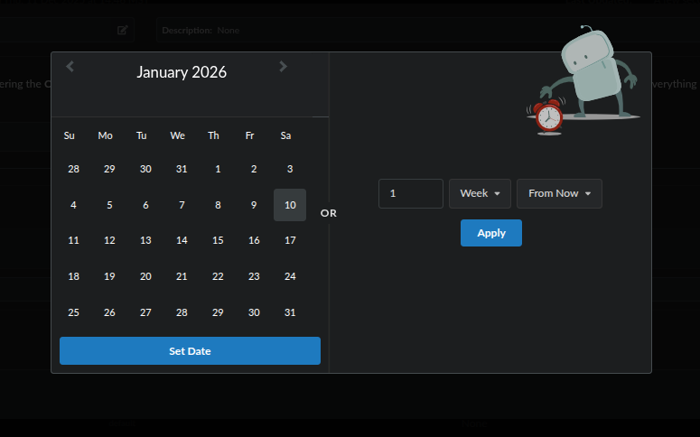
We have a rule and an Allowlist but we want to make this a POA&M item that expires so lets make an expiration by clicking on the calendar:
A calendar will pop-up and you can select a date or or a time frame of days, weeks or months:
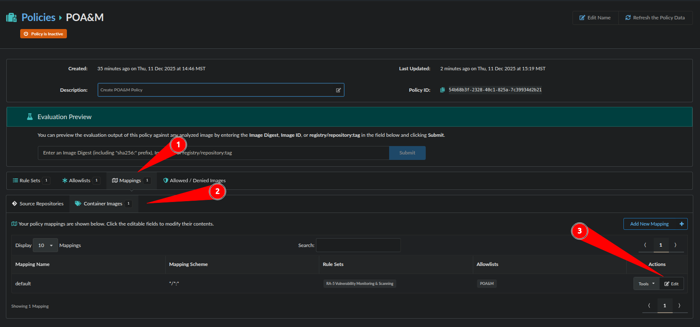
Next we will make a mapping to limit where this specific POA&M or Allowlist is applied by clicking Mappings, Container Images and Edit:
Next we will associate a Registry, Repository and Tag with the POA&M Allowlist we just made.
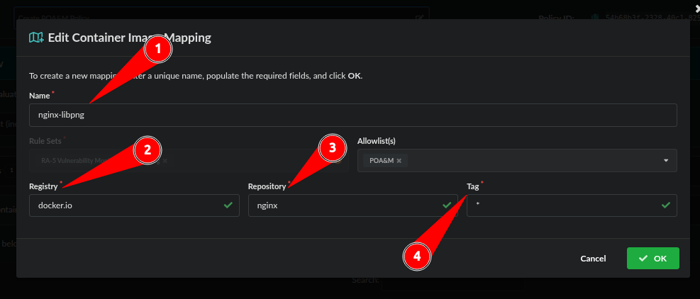
- Name the Mapping: nginx-libpng
- Registry: docker.io
- Repository: nginx
- Tag: *
Note: Wildcards “*” can be used for Registry, Repository, and Tag
Our POA&M via an Allowlist with an expiration has been created. Let’s validate:
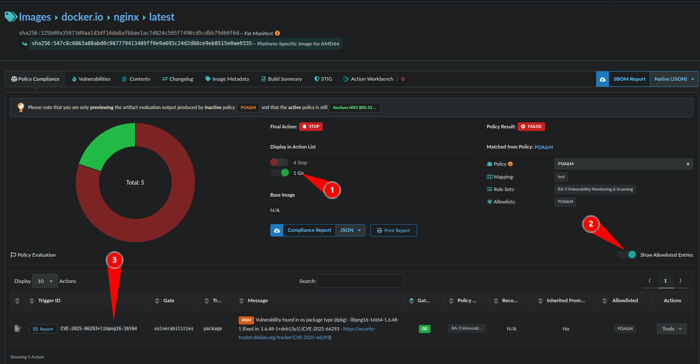
- Toggle on Go
- Show Allowlisted Entries
- The TriggerID matches what was put in the Allowlist
You have now created a POA&M enforced by code.
1.2 - STIG
Use Anchore Enterprise to STIG a container image
This guide provides examples of how to scan a container with DISA STIGs and import the data into Heimdall for a visualization or STIGViewer to create a checklist to provide as an ATO artifact.
This guide requires the dependencies located here to be installed along with the dependency below.
SAF CLI - Install Docs
Once these dependencies are installed, the STIG profiles are written as indicated in the here link and a STIG evaluation has been completed, you are ready to begin.
We will assume that the output of the scan is located in our working directory for the examples below and the STIG --stig-output-dir was saved in /tmp like the example below:
anchorectl image add registry.access.redhat.com/ubi9/ubi:latest --stig --stig-profile ./rhel9/rhel9.tar.gz --stig-output-dir /tmp
AnchoreCTL v6 exposes a dedicated
anchorectl stig docker image command tree (add, delete, download, execute, list) as the v6-canonical path for container image STIG operations. stig docker image execute is the focused alternative to the inline image add --stig flag shown above. The legacy anchorectl image stig tree is deprecated in v6 in favor of stig docker image. See Anchore STIG for Container Images for the full command reference.Work with Heimdall
The native format for STIG output in Anchore Enterprise is OASIS Heimdall Data Format (OHDF) and can be easily uploaded to heimdall-lite.mitre.org
From here, you can upload the
results.jsonfile and obtain charts and a map of the NIST 800-53 controls like the images below: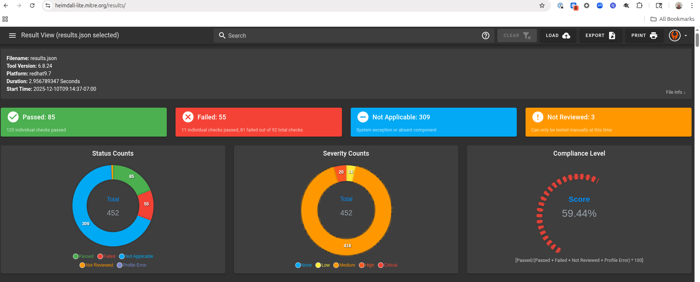
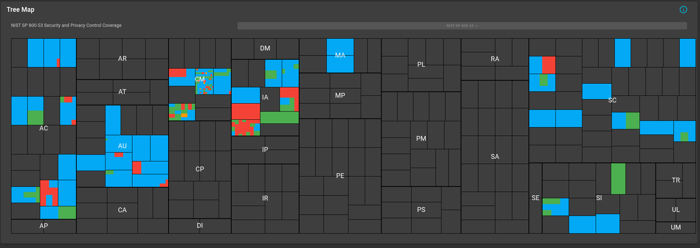
You can easily filter what passed, failed, not reviewed and not applicable. The data can be exported as a DISA Checklist or as XCCDF Results as indicated in the picture below:
The data can be imported back into STIGViewer to audit a checklist as indicated in Step 4 under Work with STIGViewer.
Work with STIGViewer
- With safcli installed run the following command to convert the
results.jsonto XCCDF:
saf convert hdf2xccdf -i results.json -o xccdf-results.xml
- Now we want to convert the same
results.jsonto a ckl file:
saf convert hdf2ckl -i results.json -o ubi9-check.ckl
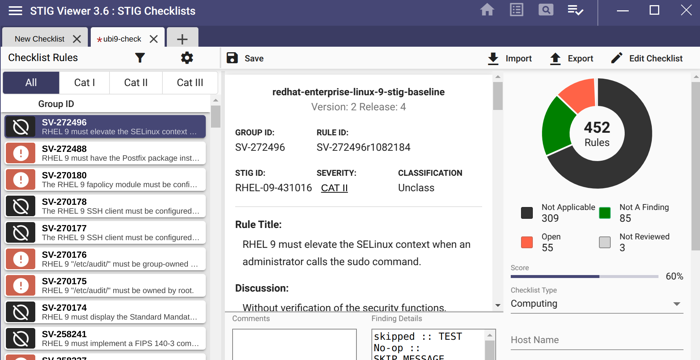
Let’s open STIGViewer and import the
xccdf-results.xmlfile we created in step 1.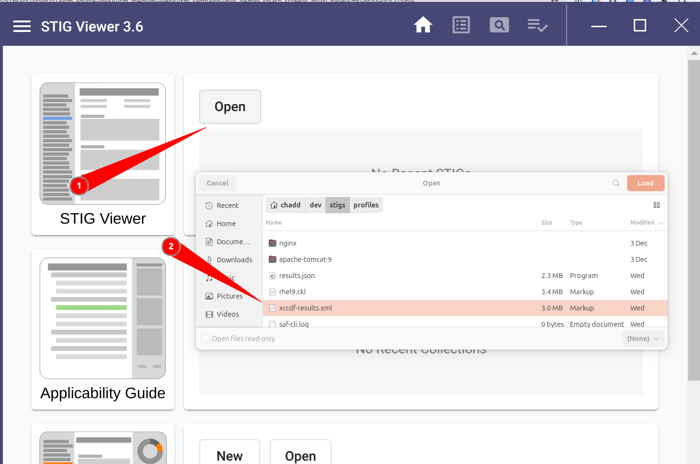
Now we can click the Home Icon and load our checklist:
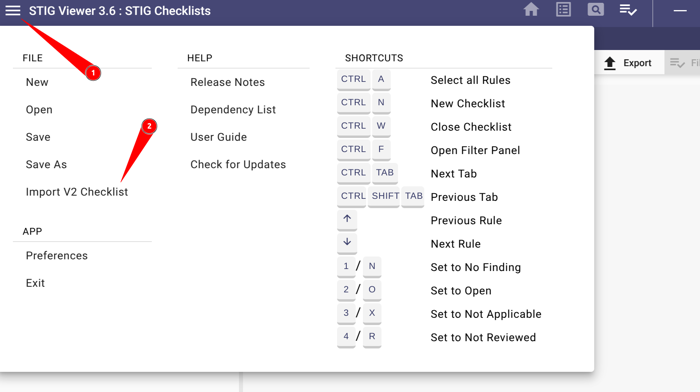
- Click the hamburger menu
- Click Import V2 Checklist and upload
ubi9-check.ckl
The container STIG checklist can now be saved once the findings as either Open, Not a Finding, Not Applicable and submitted with the applicable Body of Evidence (BOE) documentation.
You have now STIG’d a container image and created a checklist.
2 - Creating SBOMs from Virtual Machines
Generate SBOMs from virtual machine filesystems and disk images using AnchoreCTL
Containers are not the only software you ship. Many organizations run virtual machines — on cloud providers, on-prem hypervisors, edge appliances, or air-gapped environments — and the workloads inside those VMs need the same SBOM-based security analysis that containerized workloads receive. This quickstart shows two practical ways to bring a virtual machine’s contents into Anchore Enterprise for vulnerability and policy analysis: by analyzing the live filesystem of a running VM, or by analyzing a VM disk image offline against a loopback mount.
When This Approach Fits
Filesystem-based analysis with AnchoreCTL fills the gap between “I have a container image” and “I have a software inventory” for workloads that don’t fit the container model:
- Cloud or on-prem virtual machines running services that predate containerization, or that depend on kernel modules, system services, or installed packages that aren’t easily containerized.
- Air-gapped or appliance environments where VM images are shipped as the unit of distribution and need to be analyzed before deployment.
- Forensic or audit workflows where a disk image needs to be analyzed offline without booting the VM.
- Build-time analysis of “golden image” VM templates before they’re cloned out across a fleet.
In each case, AnchoreCTL produces an SBOM from a directory tree and uploads it as an asset on an app version, where the result aggregates alongside any other assets (container images, filesystems, externally supplied SBOMs) attached to the same release.
Before You Start
- An Anchore Enterprise deployment.
- AnchoreCTL installed and configured to talk to your deployment.
- For the running-VM approach: SSH access to the VM and the ability to install or copy in the AnchoreCTL binary.
- For the disk-image approach: a Linux host with the QEMU utilities (
qemu-utilson Debian/Ubuntu,qemu-imgon RHEL/Fedora) and the NBD kernel module loaded. The module is a one-timesudo modprobe nbd max_part=8on most distributions. Other VM disk formats (raw, vmdk, vdi) can be converted to qcow2 withqemu-img convertfirst.
Create the App and Version
Attach the resulting SBOM to an app version. Create the app and an initial version once — either ahead of time as part of release setup, or on-demand the first time you run the analysis:
anchorectl app add my-vm-fleet --contact-name "Platform Team"
anchorectl app version add 2026-06-01 --app my-vm-fleet
For the full app and version reference, see Creating and Managing Apps and Creating and Managing App Versions.
Approach A — Analyze a Running VM
Install AnchoreCTL inside the VM, then point it at the filesystem you want to analyze. Analyzing the root path is the broadest coverage; narrower paths (/usr, /opt, /srv) are faster if you only care about installed software:
# On the VM — install AnchoreCTL
curl -X GET "https://my-anchore.example.com/v2/system/anchorectl?operating_system=linux&architecture=amd64" \
  -H "accept: */*" | tar -zx anchorectl

# Configure connection to Anchore Enterprise
export ANCHORECTL_URL=https://my-anchore.example.com
export ANCHORECTL_USERNAME=<your-user>
export ANCHORECTL_PASSWORD=<your-password>

# Analyze the root filesystem and attach as an asset on the target app version
./anchorectl app version asset add filesystem / \
  --app my-vm-fleet \
  --version 2026-06-01 \
  --asset web-server-vm \
  --type virtual_machine_disk \
  --wait
For production workflows, use an API key instead of username and password. API keys are particularly useful when AnchoreCTL runs inside a VM, since they’re easier to rotate and scope to specific operations.
The --type virtual_machine_disk flag tags the asset with the virtual_machine_disk type so it’s distinguishable from other filesystem-derived assets in the same version. The --wait flag blocks until the asset-add job reaches a terminal state.
AnchoreCTL’s filesystem analyzer skips pseudo-filesystems like
/proc and /sys by default, so analyzing / is safe. If you want to narrow the scope further, point at a specific directory and pass that path in place of /.Approach B — Analyze a VM Disk Image Offline
With QEMU utilities installed and the NBD module loaded (see Before You Start), mount the VM disk image read-only and run AnchoreCTL against the mount point. This walkthrough uses a qcow2 image — the most common Linux VM format.
# Connect the qcow2 image as a read-only network block device
sudo qemu-nbd --read-only --connect=/dev/nbd0 disk.qcow2

# Mount the root partition (adjust the partition number to match your image)
sudo mkdir -p /mnt/vm
sudo mount -o ro /dev/nbd0p1 /mnt/vm

# Analyze the mounted filesystem and attach as an asset
anchorectl app version asset add filesystem /mnt/vm \
  --app my-vm-fleet \
  --version 2026-06-01 \
  --asset web-server-vm-image \
  --type virtual_machine_disk \
  --wait

# Clean up
sudo umount /mnt/vm
sudo qemu-nbd --disconnect /dev/nbd0
This pattern is particularly useful for forensic or pre-deployment workflows — the VM never has to boot, no agent needs to be installed inside it, and the disk stays read-only throughout.
View Results in Anchore Enterprise
Once the asset-add job completes, open the app version detail page in the Anchore Enterprise GUI (Apps → my-vm-fleet → 2026-06-01) to see the analysis in context:
- Summary tab — high-level asset and finding counts for the version.
- Contents tab — every package discovered across the version’s assets, including the VM disk you just attached.
- Vulnerabilities tab — every vulnerability surfaced from the version’s assets, sortable by Anchore Score.
- Compliance tab — policy evaluation results, including findings that originate from the VM disk asset.
The same data is available programmatically:
# List the assets attached to the version (the VM asset should appear)
anchorectl app version asset list 2026-06-01 --app my-vm-fleet

# List vulnerabilities aggregated across the version
anchorectl app version vuln list 2026-06-01 --app my-vm-fleet

# Download the SBOM for a specific asset
anchorectl app version asset sbom get web-server-vm \
  --app my-vm-fleet \
  --version 2026-06-01 \
  --file web-server-vm.sbom.json
For package pivots, see Viewing an App Version’s SBOM. For cross-asset vulnerability lookups, see Scan an App Version.
Conclusion
You’ve now extended Anchore Enterprise’s SBOM-based analysis to virtual machines — either live (running VM) or offline (mounted disk image) — and attached the result to an app version where it sits alongside any other release artifacts. Repeat the same pattern for additional VMs in your fleet, or fold the disk-image variant into your VM build pipeline to catch issues before image distribution.
3 - Customize the Anchore Enterprise GUI
Customize the Anchore Enterprise GUI
When managing a complex security platform like Anchore Enterprise, communication and accessibility are key. Whether you’re alerting your security and development teams to upcoming maintenance or providing quick access to API documentation, the ability to customize your Anchore Enterprise deployment makes for a better user experience, that is tailored to your organization and use case.
These customizations are outlined below and can be easily made through the GUI System Configuration or programmatically via Helm values or Manual Config. Let’s run through what and how you can configure these.
Custom Message
A Custom Message can be displayed on the Anchore Enterprise GUI login view. You can specify a title and a message, both of which support Markdown formatting with any HTML tags removed.
Below is an example of a custom message title with a handy message below.
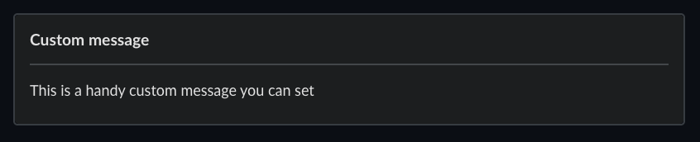
Custom Message
Recommendation: This can be a useful place to display messages, such as Legal Disclaimers. You can utilize Unicode characters, such as emojis, to help draw attention if required.
Configuration: Edit the config-ui.yaml file under the key custom_message and if you are using Helm tweak your values for anchoreConfig.ui.custom_message. Below is an example yaml configuration:
custom_message:
  title: "Custom message"
  message: "This is a handy custom message you can set"
Custom Banners
Custom Banners can be displayed on the Anchore Enterprise GUI across the top and/or bottom of the view. Each banner can have its own text, display mode (always, or login-only, where the banner is only displayed on the login view), as well as an optional background color and text color.
Below is an example of a top banner with always display mode, green background with white text 🚨🚨 ENVIRONMENT: DEMO 🚨🚨

Custom Banner
Recommendation: This can be a useful place to signpost users towards gaining access or displaying suitable messages, such as an upcoming maintenance window. You can utilize Unicode characters, such as emojis, to help draw attention if required.
Configuration: You can simply configure your Custom Banner via the GUI. Alternatively, edit the config-ui.yaml file under the key banners and if you are using Helm tweak your values for anchoreConfig.ui.banners. Below is an example yaml configuration:
banners:
  top:
    text: "🚨🚨 ENVIRONMENT: DEMO 🚨🚨"
    text_color: "white"
    background_color: "#32a883"
    display: "always"
  bottom:
    text: "Here is an example login only banner"
    text_color: "white"
    background_color: "#1e6ee6"
    display: "login-only"
Custom Links
Custom links can be displayed on the Anchore Enterprise GUI on the login page and also within the system dropdown menu (top-right in the main view). You can specify a title and up to 10 links with their own titles and URIs. This feature is only enabled if a main title and at least one link and associated title are provided. HTML tags will be removed.
An example below shows how the custom links section on mouse click/hover can be expanded on both the login page:
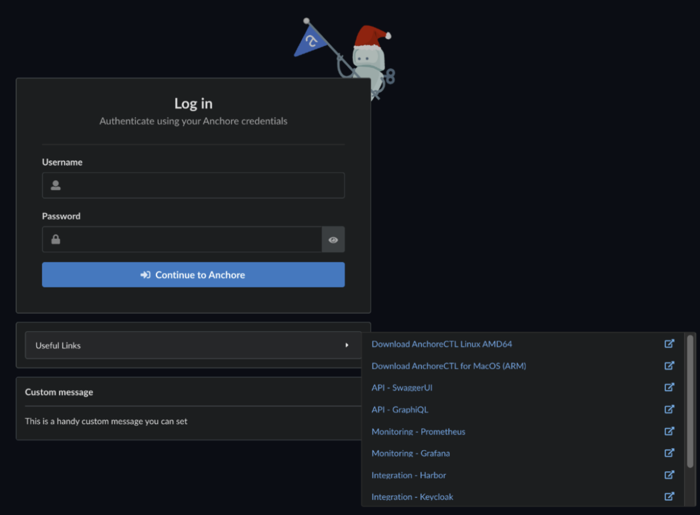
Login Links
and the system dropdown menu:
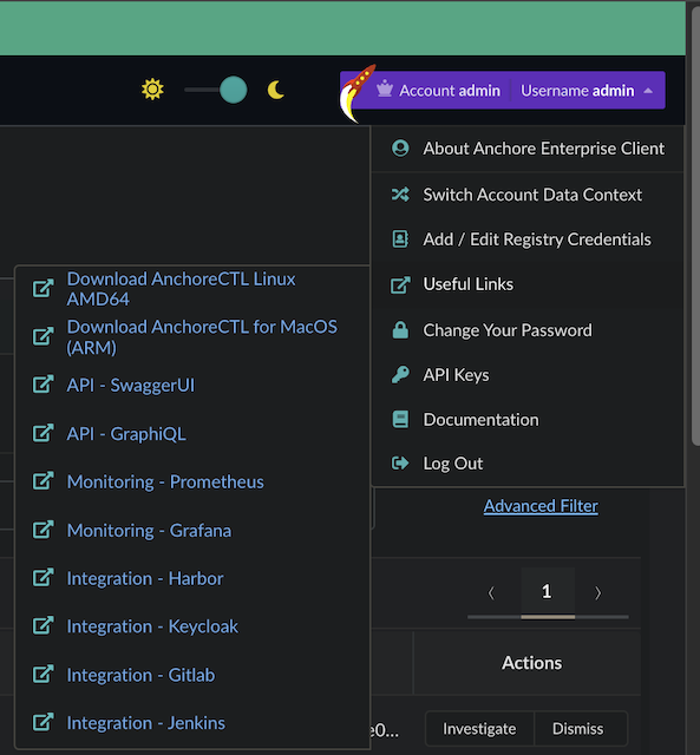
Top Nav links
Recommendation: This might be a useful place to link to your deployments copies of AnchoreCTL for the distributions used in your organisation (Windows, Linux, MacOS). This allows users to quickly find and download AnchoreCTL, and importantly, it will download the latest compatible version of AnchoreCTL. Developers also find having links to the Anchore Enterprise Swagger API docs useful.
Configuration: You can simply configure your Custom Links via the GUI. Alternatively, edit the config-ui.yaml file under the key custom_links and if you are using Helm, tweak your values under anchoreConfig.ui.custom_links. Below is an example Helm yaml configuration:
custom_links:
  title: "Internal Resources"
  links:
  - title: "Download AnchoreCTL Linux AMD64"
    uri: "/v2/system/anchorectl?operating_system=linux&architecture=amd64"
  - title: "API - SwaggerUI"
    uri: "/swagger/"
  - title: "API - GraphiQL"
    uri: "/v2/reports/graphql"
  - title: "Integration - Gitlab"
    uri: "https://gitlab.anchoredemo.com/"
Configuration Changes via the GUI
Users with an Administrator role can configure Custom Message, Custom Banners and Custom Links directly through the Anchore Enterprise GUI by navigating to System > Configuration.
You can make these changes, without the need to change Helm or application values requiring a redeployment of Anchore Enterprise. However, configuring these custom elements within the GUI, only works if you have NOT already defined the relevant custom values via config-ui.yaml, Helm values or environment variables.
The Web UI offers a helpful WYSIWYG editor allowing you to make changes instantly. Once you click ‘apply’ and then click ‘save’ on the configuration, refresh the page to see your custom changes. The example below shows adding a Top Custom Banner that has its display mode set to always appear.
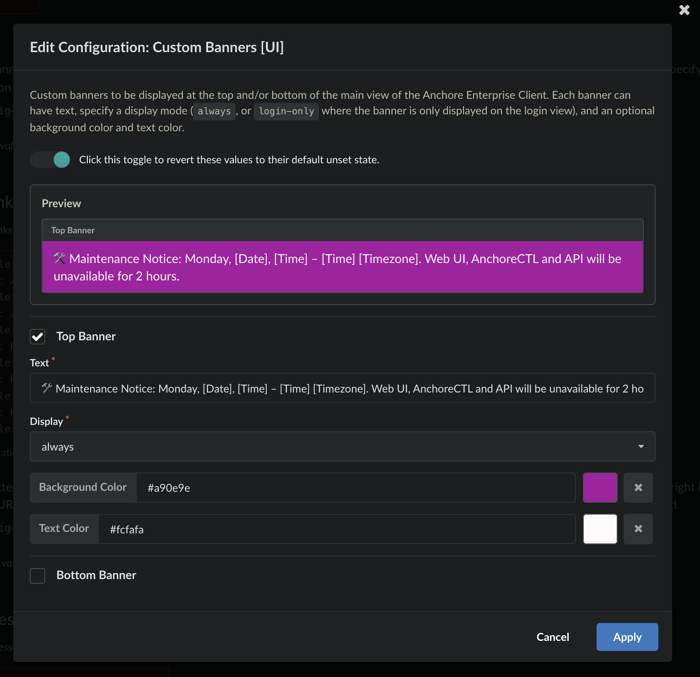
Custom Banner Config
4 - Find Zero-day Vulnerabilities
Find vulnerabilities across your inventory of SBOMs.
This page outlines the workflow for locating zero-day vulnerabilities using Anchore Enterprise’s capabilities, most notably the GUI, reports, and API queries, by both package and vulnerability ID.
When a zero-day vulnerability is disclosed, your first response will be to try and understand your exposure: where in your software supply chain are the affected packages and versions used? In such situations, the Common Vulnerabilities and Exposures (CVE) record may not be fully published yet. This means that you might be searching for specific package versions and by vulnerability identifier, such as a GitHub Security Advisory (GHSA) number.
This quickstart covers image-scoped zero-day triage — both the Reports view and the Query API used here operate over the image catalog. App-version-scoped search and reporting is on the roadmap; in the meantime, see Scan an App Version for per-version vulnerability lookups.
Check Your Feeds
Anchore Enterprise relies on a large number of vulnerability data sources to bring you the most accurate vulnerability matching as possible. It could be that upstream sources already have knowledge of the vulnerability. Your first step should be to quickly check whether Anchore Enterprise has the latest vulnerability dataset.
In environments talking directly to the Anchore Data Service, you can force a feed sync by running the following command as the Anchore Enterprise administrator:
anchorectl feed sync
You can verify the latest feed updates using the following command:
anchorectl feed list
If you are using Anchore Enterprise in an air-gapped environment, you may need to refresh the vulnerability database (grypeDB) by sneaker-copying a bundle into the high-side environment or through the use of a Cross Domain Solution (CDS). See Air-gapped for further guidance.
Feed sync status can also be found in the Anchore Enterprise GUI under System and Feeds Sync.
Note that the Last Full Sync timestamp will reflect when the last necessary update was performed, by default Anchore Enterprise will check to determine whether an update is required every hour.
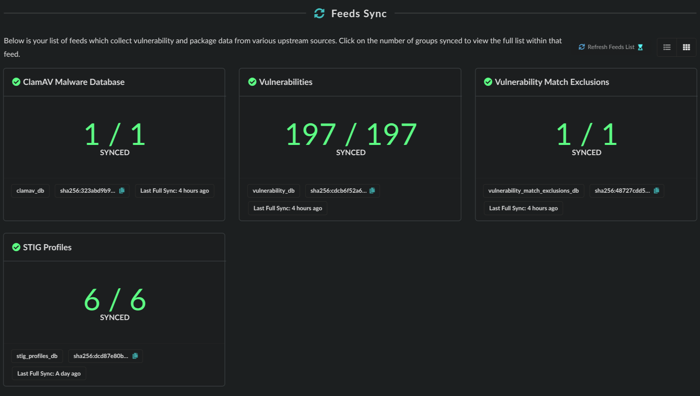
Feed sync status.
Search by Vulnerability ID
You can also use the Query API to list information about a given vulnerability ID, which can be a useful way to determine if your system is aware of the vulnerability. See
/query/vulnerabilities in the API ReferenceIf you know the vulnerability ID, which could be either a CVE, GHSA, or other identifier, you can utilize the native reporting capability in Anchore Enterprise.
- Click the Reports menu item
- Choose a new report of Artifacts by Vulnerability.
- Choose the Vulnerability Id filter and enter the appropriate identifier.
For example, if searching for the NGINX IngressNightmare (https://kubernetes.io/blog/2025/03/24/ingress-nginx-cve-2025-1974/), you could use the CVE ID or GHSA for coverage:
- GHSA:
GHSA-mgvx-rpfc-9mpv - CVE:
CVE-2025-1974
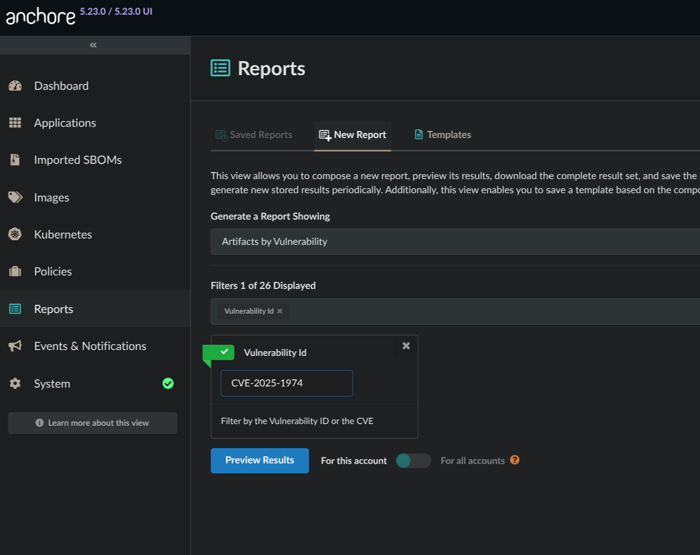
Search by CVE example.
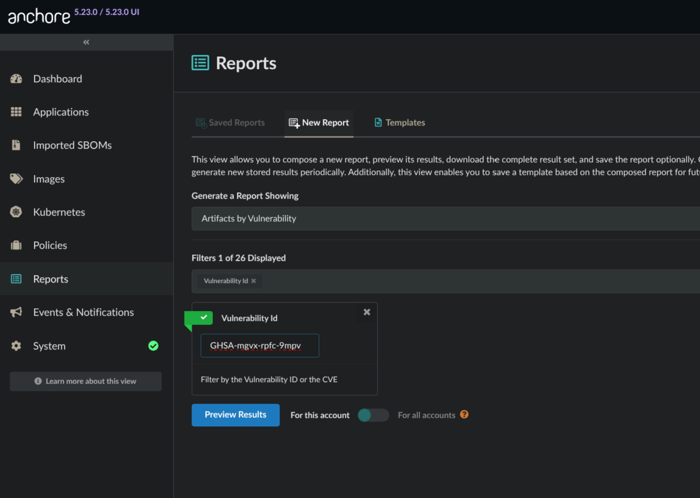
Search by GHSA example.
As you preview results, you can toggle the report scope. If you are the administrator you can run the report against all assets across all accounts.
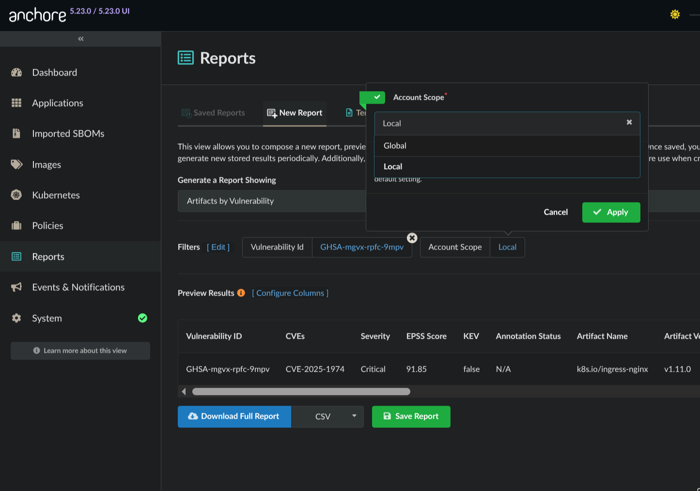
Changing account scope: local or global
Once you have validated the desired outcome in the report preview, you can opt to Save Report, provide some details, and tick the option to Generate immediately on save.
You can also use this panel to schedule report generation for future dates and times, see Reporting & Remediation
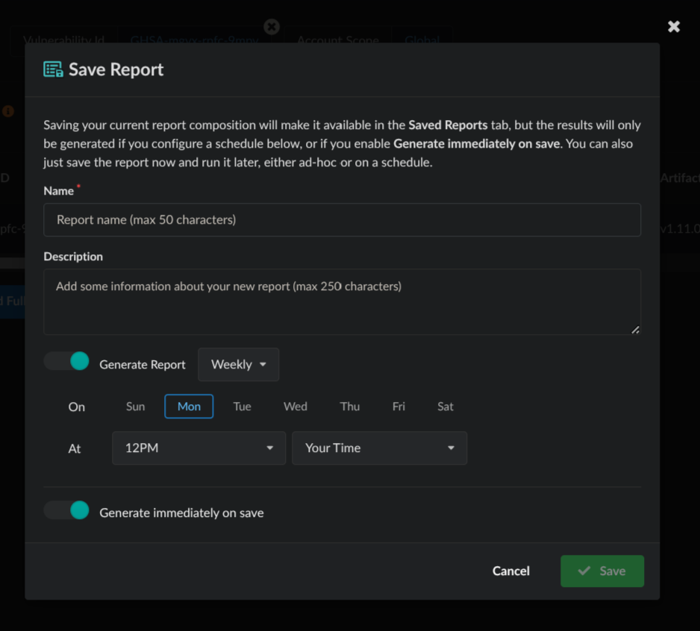
Saving the report.
The report will then be generated in order to provide you results across the SBOMs for all of your assets. Once complete, the results are ready for download.
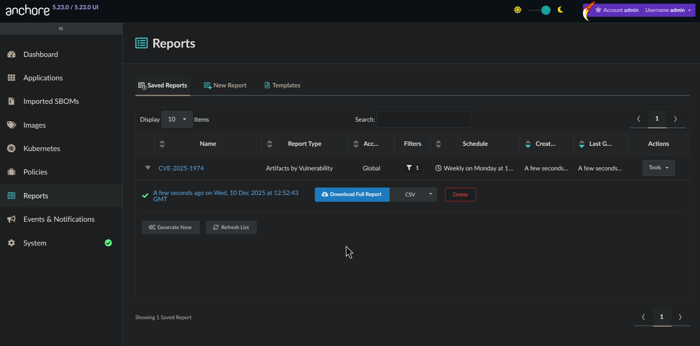
Ready for download!
You now have an understanding of where in your software supply chain this vulnerability can be found. Go remediate!
Search for Affected Packages
Sometimes you won’t have a vulnerability record available because it has not been created or appropriately updated. Another way to assess impact during a zero-day is to search for the specific package or library version known to be vulnerable. Fortunately, this can be done via the Anchore Enterprise API.
Use the Query API to look for specific package versions. In the case of CVE-2025-1974 (GHSA-mgvx-rpfc-9mpv), the impacted packages were k8s.io/ingress-nginx with versions v1.11.0 - 1.11.4.
The following query would be used to look for a particular version:
curl -X 'GET' \
  'https://anchoredemo.com/v2/query/images/by-package?name=k8s.io%2Fingress-nginx&package_type=go&version=v1.11.0' \
  -H 'accept: application/json'
This would yield a response similar to that found below, revealing an impacted asset:
{
  "images": [
    {
      "image": {
        "image_digest": "sha256:4db2297322e827ae13892be1480800471ec83726edea921bd45af0f8ed35e094",
        "image_id": "bcb840ba02d3eb300b1c13876604e4286794e5873eacbb86ba81139e2ad66a86",
        "analyzed_at": "2025-11-18T12:04:27Z",
        "tag_history": [
          {
            "registry": "registry.k8s.io",
            "repo": "ingress-nginx/controller",
            "tag": "v1.11.0",
            "full_tag": "registry.k8s.io/ingress-nginx/controller:v1.11.0",
            "tag_detected_at": "2025-11-18T11:50:03Z"
          }
        ]
      },
      "packages": [
        {
          "name": "k8s.io/ingress-nginx",
          "version": "v1.11.0",
          "type": "go"
        }
      ]
    }
  ],
  "page": "1",
  "returned_count": 1,
  "total_count": 1
}
With this information, you can now remediate the impacted asset!
5 - Identify & Evaluate Images in Kubernetes Clusters
Identifying and analyzing images running in a Kubernetes cluster
Summary
This quickstart page outlines how Anchore Enterprise integrates directly with Kubernetes environments to support continuous security and operational assurance. By connecting the Kubernetes Inventory Agent and running it in your cluster, Anchore Enterprise collects a real-time software inventory of running workloads, aligning containerized operations with vulnerability detection, configuration assessment, and policy controls.
As organizations scale Kubernetes deployments, Anchore Enterprise enables continuous monitoring of runtime images, automated policy evaluation, and actionable reporting to strengthen workload hardening and operational compliance. Through runtime inventory and policy enforcement, teams can standardize security across clusters, surface risk early, and ensure that live container images meet organizational and regulatory requirements.
This quickstart is the fast path to a working agent. For deeper operational coverage:
- Kubernetes Runtime Inventory — full agent installation reference, including all
values.yamloptions. - Kubernetes Inventory — day-to-day operations: watching namespaces, navigating the GUI view, policy and account scoping.
- Runtime Inventory configuration — deployment-wide inventory time-to-live and shared options across Kubernetes and ECS agents.
Prerequisites
- Anchore Enterprise deployed and accessible.
kubectlconfigured for your target Kubernetes cluster.- Cluster access with sufficient privileges to deploy agents.
- Helm (optional, for easier deployment of the agent).
You will find the agent and relevant configuration files in our official Kubernetes Inventory Agent Github Repo here.
Connect the Kubernetes Inventory Agent
The Anchore Kubernetes Inventory Agent gathers information about running images and resources via an agent running inside your cluster.
To deploy the agent and begin monitoring your cluster;
- Add Anchore’s Helm repository:
helm repo add anchore https://charts.anchore.io
helm repo update
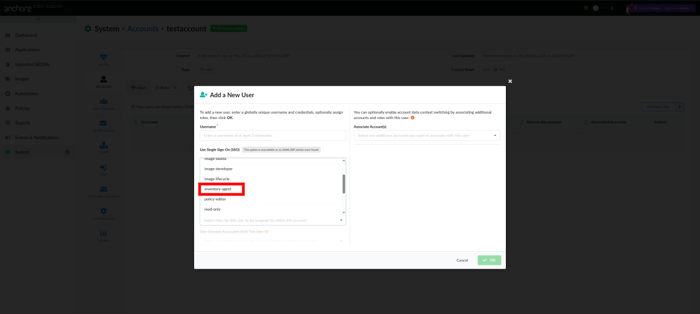
- Create a native user in Anchore Enterprise that uses the
inventory-agentrole permissions.
Create a
values.yamlfor the chart, setting your cluster name, Anchore Enterprise URL, and the credentials and account for theinventory-agentuser you created above. See Kubernetes Runtime Inventory for the full values reference, including secret handling and inventory-retention options.Install the Kubernetes Inventory Agent using Helm and the values file you built:
helm install <release> -f <values.yaml> anchore/k8s-inventory
After deployment, verify the pod is up and running:
kubectl get pods -n anchore
The agent will automatically:
- Discover all running pods and containers.
- Collect image metadata and digest information.
- Submit inventory to Anchore Enterprise.
To have Anchore Enterprise automatically analyze the images the agent reports from a given cluster or namespace, activate a runtime_inventory subscription against the relevant key:
anchorectl inventory watch activate <cluster-name>/<namespace>
See Runtime Inventory Subscriptions for the full subscription-management surface.
Verification & Best Practices
Once your cluster is connected, verify agent connectivity by checking the logs to confirm it’s reporting inventory and status as expected:
kubectl logs -n anchore <inventory-agent-pod>
View the Vulnerability Results of Running Images
Log in to the Anchore Enterprise GUI.
Navigate to the
Kubernetestab to access your running cluster data. Be aware that you may need to wait for a brief period for discovered data to appear.
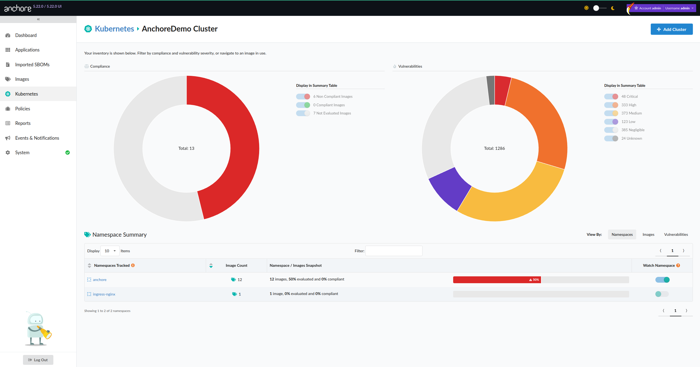
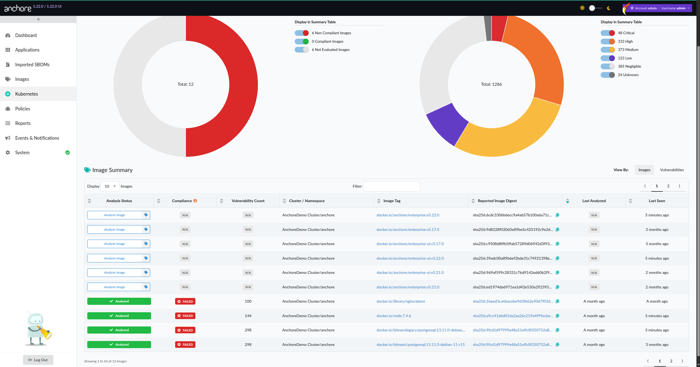
- Select your desired cluster. From here, You will get a real-time snapshot of what images are running and also be able to view:
The complete list of the running container images currently in use.
Vulnerabilities associated with each image, mapped to known CVEs.
CVSS scoring, severity distribution, and other helpful risk indicators so you can quickly spot anything that needs attention.
View and Enforce Policy Evaluations
Anchore Enterprise also lets you apply and enforce security policies directly against your running images—so you’re not just observing problems, you’re controlling them.
In the UI, go to Policies → Evaluation.
Choose the policy bundle you want to assess or enforce (for example, minimum CVSS severity thresholds, banned packages, or disallowed images).
Review the results, including:
- Pass/Fail status for each image or cluster.
- Detailed reasoning for policy violations, helping to guide remediation.
- Optionally - if you want to take things a step further, configure notifications or enforcement actions (e.g., blocking deployment of non-compliant workloads) to keep risky images out of production.
Notes:
Confirm version compatibility between Anchore Enterprise and the Kubernetes Inventory Agent—mismatched versions can cause subtle reporting gaps or failed collections.
Keep the agent and policy bundles current, so you’re always scanning against the latest CVE data and enforcement rules rather than working off stale definitions.
Consider using role-based access control(RBAC) in Anchore Enterprise to protect sensitive results, ensuring that only authorized users can view vulnerability and policy data—especially in environments where findings may have compliance or confidentiality implications.
6 - Best Practices for Using Anchore Enterprise in CI
Integrating Anchore Enterprise into CI systems
This quickstart will walk you through the typical steps required to integrate Anchore Enterprise policy checks and vulnerability scans into your CI jobs.
Before You Start
In order to start instrumenting your CI pipelines with AnchoreCTL, you need to ensure the following:
- You have access to a fully operational Anchore Enterprise deployment, with a provisioned account/tenant for your use.
- The Anchore Enterprise API should be accessible from your CI runner(s).
- Your Anchore Enterprise deployment and your CI runner(s) can reach any relevant container registries from which to source images.
Get AnchoreCTL
Anchore Enterprise can be integrated into various CI systems in a vendor-agnostic manner using the AnchoreCTL tool. AnchoreCTL is a golang binary which can be used to interact with an Anchore Enterprise deployment. To ensure compatibility and simplify runner configuration, AnchoreCTL should always be version-aligned with your Anchore Enterprise deployment.
A recommended practice is to fetch AnchoreCTL directly from your Anchore Enterprise installation during the CI job. This guarantees the client version matches the server. Insert a command such as the following into your job before you want to conduct a scan and evaluation:
curl -X GET "https://my-anchore.example.com/v2/system/anchorectl?operating_system=linux&architecture=amd64" \
  -H "accept: */*" | tar -zx anchorectl
For more details, see Deploying AnchoreCTL.
Access via API Keys
AnchoreCTL can talk to an Anchore Enterprise deployment using username and password for authentication, or via API keys. The latter is recommended and otherwise commonly used if you are signing into Anchore Enterprise via SSO.
Configure an API key so your job can talk to the Anchore Enterprise API, see Using API keys for instructions.
Add Environment Variables
You’ll typically want to store AnchoreCTL configuration such as connection details in environment variables for your CI job. At a minimum, you will want to set or configure the following in your CI job specification:
ANCHORECTL_URLANCHORECTL_USERNAMEANCHORECTL_PASSWORDANCHORECTL_UI_URL
The ANCHORECTL_UI_URL variable ensures that HTML outputs from anchorectl commands will contain deep links to the Anchore Enterprise GUI for assets.
Alternatively, you could also construct an AnchoreCTL configuration file and use that. See Configuring AnchoreCTL for further details on possible parameters.
You can also run
anchorectl –help | grep ANCHORECTL_ to see a list of common environment variablesChoose Your Pathway
Two CI integration shapes are supported in Anchore Enterprise v6. Pick the one that matches what your CI job is already doing — both work with any CI system and both use AnchoreCTL, but the Anchore Enterprise step in your pipeline is different in each case.
| Pathway | When to use | What the Anchore Enterprise step does |
|---|---|---|
| (A) SBOM Upload to an App Version | Your CI already produces an SBOM and you want the result aggregated against an app version for release tracking, search, and evidence export | AnchoreCTL uploads the pre-existing SBOM as an asset on the target app version, then reads per-version results back |
| (B) Image Analysis | Your CI builds container images and you want fast pass/fail gating on vulnerabilities and policy, without binding the result to a release | AnchoreCTL adds the image to the image catalog, then reads vulnerability and policy results back inline |
Pathway A fits teams who have standardized on producing SBOMs upstream and treat Anchore Enterprise as the evaluation, aggregation, and evidence layer over those SBOMs. Pathway B is a straightforward entry point for CI jobs that build container images — image in, results out, no app or version bookkeeping.
The rest of this quickstart documents both pathways. Click into the one that matches your situation and follow it through to the conclusion — the two pathways are independent.
Pathway A — SBOM Upload to an App Version
In this pathway your CI job has already produced an SBOM in an earlier step. Any supported SBOM format — CycloneDX, SPDX, or Syft-native JSON — can be uploaded. The Anchore Enterprise step then attaches the SBOM to an app version as an asset, and reads vulnerability and policy results back at the version level.
App and Version Setup
Pathway A presumes the target app and version already exist in Anchore Enterprise. You can create them once during release setup, or as part of the CI job itself:
anchorectl app add my-service --contact-name "Platform Team"
anchorectl app version add 1.4.0 --app my-service
For the full app and version reference, see Creating and Managing Apps and Creating and Managing App Versions.
Construct Your Workflow
A Pathway A CI job typically does the following:
- Builds the artifact and produces an SBOM via the user’s chosen tool
- Downloads AnchoreCTL from Anchore Enterprise
- Uploads the SBOM as an asset on the target app version
- Reads vulnerability and policy results back at the version level
- Fails the CI job step if the policy evaluation result is
fail
The sequence of commands looks something like this (simplified):
# Earlier step has produced ./api.sbom.json — any CycloneDX / SPDX / Syft JSON document

# Download AnchoreCTL
curl -X GET "https://my-anchore.example.com/v2/system/anchorectl?operating_system=linux&architecture=amd64" \
  -H "accept: */*" | tar -zx anchorectl

# Upload the SBOM as an asset on the target app version
anchorectl app version asset add sbom ./api.sbom.json \
  --app my-service \
  --version 1.4.0 \
  --asset api-image \
  --type container \
  --wait

# Get vulnerability results for the app version
anchorectl app version vuln list 1.4.0 --app my-service

# Get the per-finding detail — specific gates, triggers, and remediation recommendations behind the verdict
anchorectl app version policy findings list 1.4.0 --app my-service

# Check policy status
anchorectl app version policy status get 1.4.0 --app my-service -f
The --type flag on the asset-add declares what the SBOM describes — set container for a container image SBOM, filesystem for a directory analysis, library for a single library binary, and so on. See Asset Types for the full enum.
The --wait flag blocks until the asset-add job reaches a terminal state, so the subsequent vuln list and policy commands operate on fully processed data.
The -f flag — shorthand for --fail-based-on-results — gives the policy status get command a return code of 1 when the policy evaluation result is fail. The non-zero exit is what fails the CI job step.
Customize Artifacts
The app version vuln, app version policy, and app version export command trees all expose -o for output format selection. Common patterns:
app version vuln list ... -o json— programmatic vulnerability results for downstream tooling.app version policy findings list ... -o json— programmatic policy results for build-gating logic.app version export vulnerabilitiesandapp version export vexproduce formal documents (CSV vulnerability report and CycloneDX VEX, respectively) that you can attach as build artifacts. See Evidence for the full export surface.
Use Policy Checks
Pathway A’s policy gating operates at the app-version level. Use the following command to retrieve the app version’s policy status and fail the CI job if it does not meet compliance requirements:
anchorectl app version policy status get 1.4.0 --app my-service -f
For the per-finding detail — the specific gates, triggers, and remediation recommendations behind a failing result — list the findings:
anchorectl app version policy findings list 1.4.0 --app my-service
For the full policy evaluation surface, see Evaluate an App Version.
Notes on Optimization and Stateless Scans
- Performance tuning happens upstream. Because the SBOM is generated by your CI’s chosen tool before the Anchore Enterprise step, SBOM-generation performance is determined by that tool’s settings rather than by AnchoreCTL. The
ANCHORECTL_SYFT_PARALLELISMknob covered in Pathway B’s Optimize Performance section applies only when AnchoreCTL is the SBOM generator. - No app-version equivalent of One-Time Scan. Pathway A currently has no stateless mode — every uploaded SBOM is stored against the app version. If you need a stateless evaluation flow,
anchorectl image one-time-scanin Pathway B is the only path today.
Pathway B — Image Analysis
In this pathway your CI job builds a container image and asks Anchore Enterprise to analyze it directly. The image and its findings live in the image catalog; no app or app version is involved.
Choose Your Method of Analysis
Anchore Enterprise supports two primary modes of operation for image analysis in CI pipelines: Distributed Analysis or Centralized Analysis.
Both modes work with any CI/CD system as long as the AnchoreCTL binary can be installed and run, and you can access the Enterprise APIs directly.
Distributed Analysis (Recommended)
In Distributed Analysis, SBOM generation happens locally on the runner and is then sent to Anchore Enterprise for evaluation.
It is the recommended approach because it offers maximum flexibility in resourcing. You can potentially reduce the time to generate an SBOM by customising your AnchoreCTL configuration and providing more CPU and fast I/O to your pipeline runners.
Distributed analysis does not currently support malware scanning. If malware scanning is required, use Centralized Analysis below.
To use distributed analysis, construct your CI job to use AnchoreCTL with the --from parameter, for example:
anchorectl image add <DOCKER_USERNAME>/getting-started-todo-app --from registry --wait
This will cause AnchoreCTL in your job to download the image from the given source and generate the SBOM locally on the runner.
Centralized Analysis
In Centralized Analysis, the AnchoreCTL command is used to ask your Anchore Enterprise deployment to download and analyze the image content. This is necessary if you require the malware scanning service to unpack and scan container layers.
If you are using Centralized Analysis for Malware support, you may need to enable this in your deployment configuration, see Malware Scanning.
To use centralized analysis, omit the --from parameter, for example:
anchorectl image add ghcr.io/place/thing:v0.1.0 --wait
Centralized analysis will have a different performance profile for SBOM generation, since you may not have direct control over resourcing of your Anchore Enterprise shared service.
Construct Your Workflow
You’re now ready to put AnchoreCTL commands into your CI jobs. For a container-focused use-case, you will generally construct a job which:
- Builds a container image and pushes to a staging registry
- Downloads AnchoreCTL from Anchore Enterprise
- Generates an SBOM of the container image
- Conducts a vulnerability analysis, returning results
- Conducts a policy check, returning the evaluation result
The sequence of commands looks something like this (simplified):
# Build a docker image for your project
docker build -t <DOCKER_USERNAME>/getting-started-todo-app .

# Push the image to a staging registry (you can also skip this step by using --from docker in the next command)
docker push <DOCKER_USERNAME>/getting-started-todo-app

# Download AnchoreCTL
curl -X GET "https://my-anchore.example.com/v2/system/anchorectl?operating_system=linux&architecture=amd64" \
  -H "accept: */*" | tar -zx anchorectl

# Generate the SBOM for the image (distributed in this example) and wait for analysis to complete
anchorectl image add <DOCKER_USERNAME>/getting-started-todo-app --from registry --wait

# Get vulnerability results for the image
anchorectl image vulnerabilities <DOCKER_USERNAME>/getting-started-todo-app

# Get policy evaluation results for the image
anchorectl image check <DOCKER_USERNAME>/getting-started-todo-app
Based on the results returned by Anchore Enterprise, you can then decide what additional steps to take in your CI job.
Customize Artifacts
The various anchorectl image commands have options for outputs, selected using the -o parameter. You might opt to return results as text, machine-readable JSON, CSV, or HTML. This material can be useful if you intend to have additional steps in your job work based on results, rather than just pass or fail.
AnchoreCTL supports an HTML format for vulnerability and policy check reports, for example:
anchorectl image check ghcr.io/place/thing:v0.1.0 --detail -f -o html > policy.html
If you set ANCHORECTL_UI_URL or ui-url in your AnchoreCTL configuration, you’ll get a handy link in the HTML which takes you straight into the Anchore Enterprise GUI for that image.
Optimize Performance
With a basic workflow constructed, you might want to optimize SBOM generation, vulnerability scan, and policy check times.
If you are using Distributed Analysis, ensure your CI runners have fast CPU and I/O to optimize the cataloging and SBOM generation process used by AnchoreCTL.
If your container images contain a large number of files and packages, you may be able to significantly reduce SBOM generation time by enabling parallelism. AnchoreCTL can run catalogers in parallel rather than sequentially.
You can configure the number of concurrent worker processes using the ANCHORECTL_SYFT_PARALLELISM environment variable (or set it in anchorectl.yaml). For optimal performance, try aligning the number of workers with your runner’s available vCPUs:
# Example for an 8 vCPU runner
ANCHORECTL_SYFT_PARALLELISM=8
See Configuring AnchoreCTL for further information.
Use Policy Checks
Rather than just reviewing a raw list of vulnerabilities, which can be daunting and lack context, it is a best practice to use the Anchore Enterprise policy engine to conduct compliance checks.
Policy-driven gating provides developers with precise, actionable feedback based on your own organizational policy or industry standards (e.g., NIST 800-53, CIS).
Use the following command to evaluate an image against your default policy and fail the CI job if it does not meet compliance requirements:
anchorectl image check <DOCKER_USERNAME>/getting-started-todo-app --detail -f
The --detail flag provides the specific gate, trigger, and remediation recommendations needed to resolve policy violations — useful for developer-facing feedback.
The -f flag (shorthand for --fail-based-on-results) gives the command a return code of 1 if the policy evaluation result is fail. This is what fails the CI job step.
If you wish to store output as artifacts, use the -o parameter and save accordingly.
Switch to Stateless Scans (One-Time Scan)
By default, adding an image to Anchore Enterprise for analysis means the SBOM is stored persistently in the deployment, until archived or deleted. For some CI use cases you may not need the SBOM to persist.
Anchore Enterprise has a feature called One-Time Scan which delivers fast feedback in your pipeline jobs — vulnerability and policy analysis results — without persisting the SBOM. Use the anchorectl image one-time-scan command to conduct analysis in this mode. You can also pass a flag to fail the pipeline job if the policy analysis fails:
anchorectl image one-time-scan <DOCKER_USERNAME>/getting-started-todo-app --from registry --fail-on-policy-error
By default this command returns a policy check. Using the -o json parameter, JSON results for policy check, vulnerability scan, and the SBOM are returned together. These results can then be machine-parsed by the CI job to determine actions.
HTML output is also available:
anchorectl image one-time-scan ghcr.io/place/thing:v0.1.0 --from registry --fail-on-policy-error -o html > onetime.html
See One-Time Scan for further information.
Conclusion
You’ve now fully instrumented your pipeline to add high-fidelity SBOM-based vulnerability and compliance checks to your CI jobs.