Anchore services produce detailed logs that contain information about user interactions, internal processes, warnings and errors.
Log Level
The verbosity of the logs is controlled using the logging.log_level setting in config.yaml (for manual installations) or the corresponding ANCHORE_LOG_LEVEL environment variable (for docker compose or Helm installations) for each service.
The log levels are DEBUG, INFO, WARNING, ERROR, and CRITICAL, where the default is INFO. Most of the time, the default level is sufficient as the logs will container WARNING, ERROR and CRITICAL messages as well. But for deep troubleshooting, it is always recommended to increase the log level to DEBUG in order to ensure the availability of the maximum amount of information.
Changing Log Level via the API
The log level can be adjusted via the API without having to redeploy services:
echo '[{ "service_name": "all", "logging_level": "debug" }]' > log_level.json
curl -u {admin_user}:{admin_pass} -X POST -H 'Content-Type: application/json' -d @log_level.json http://localhost:8228/v2/system/logging
Changing Log Level via the UI
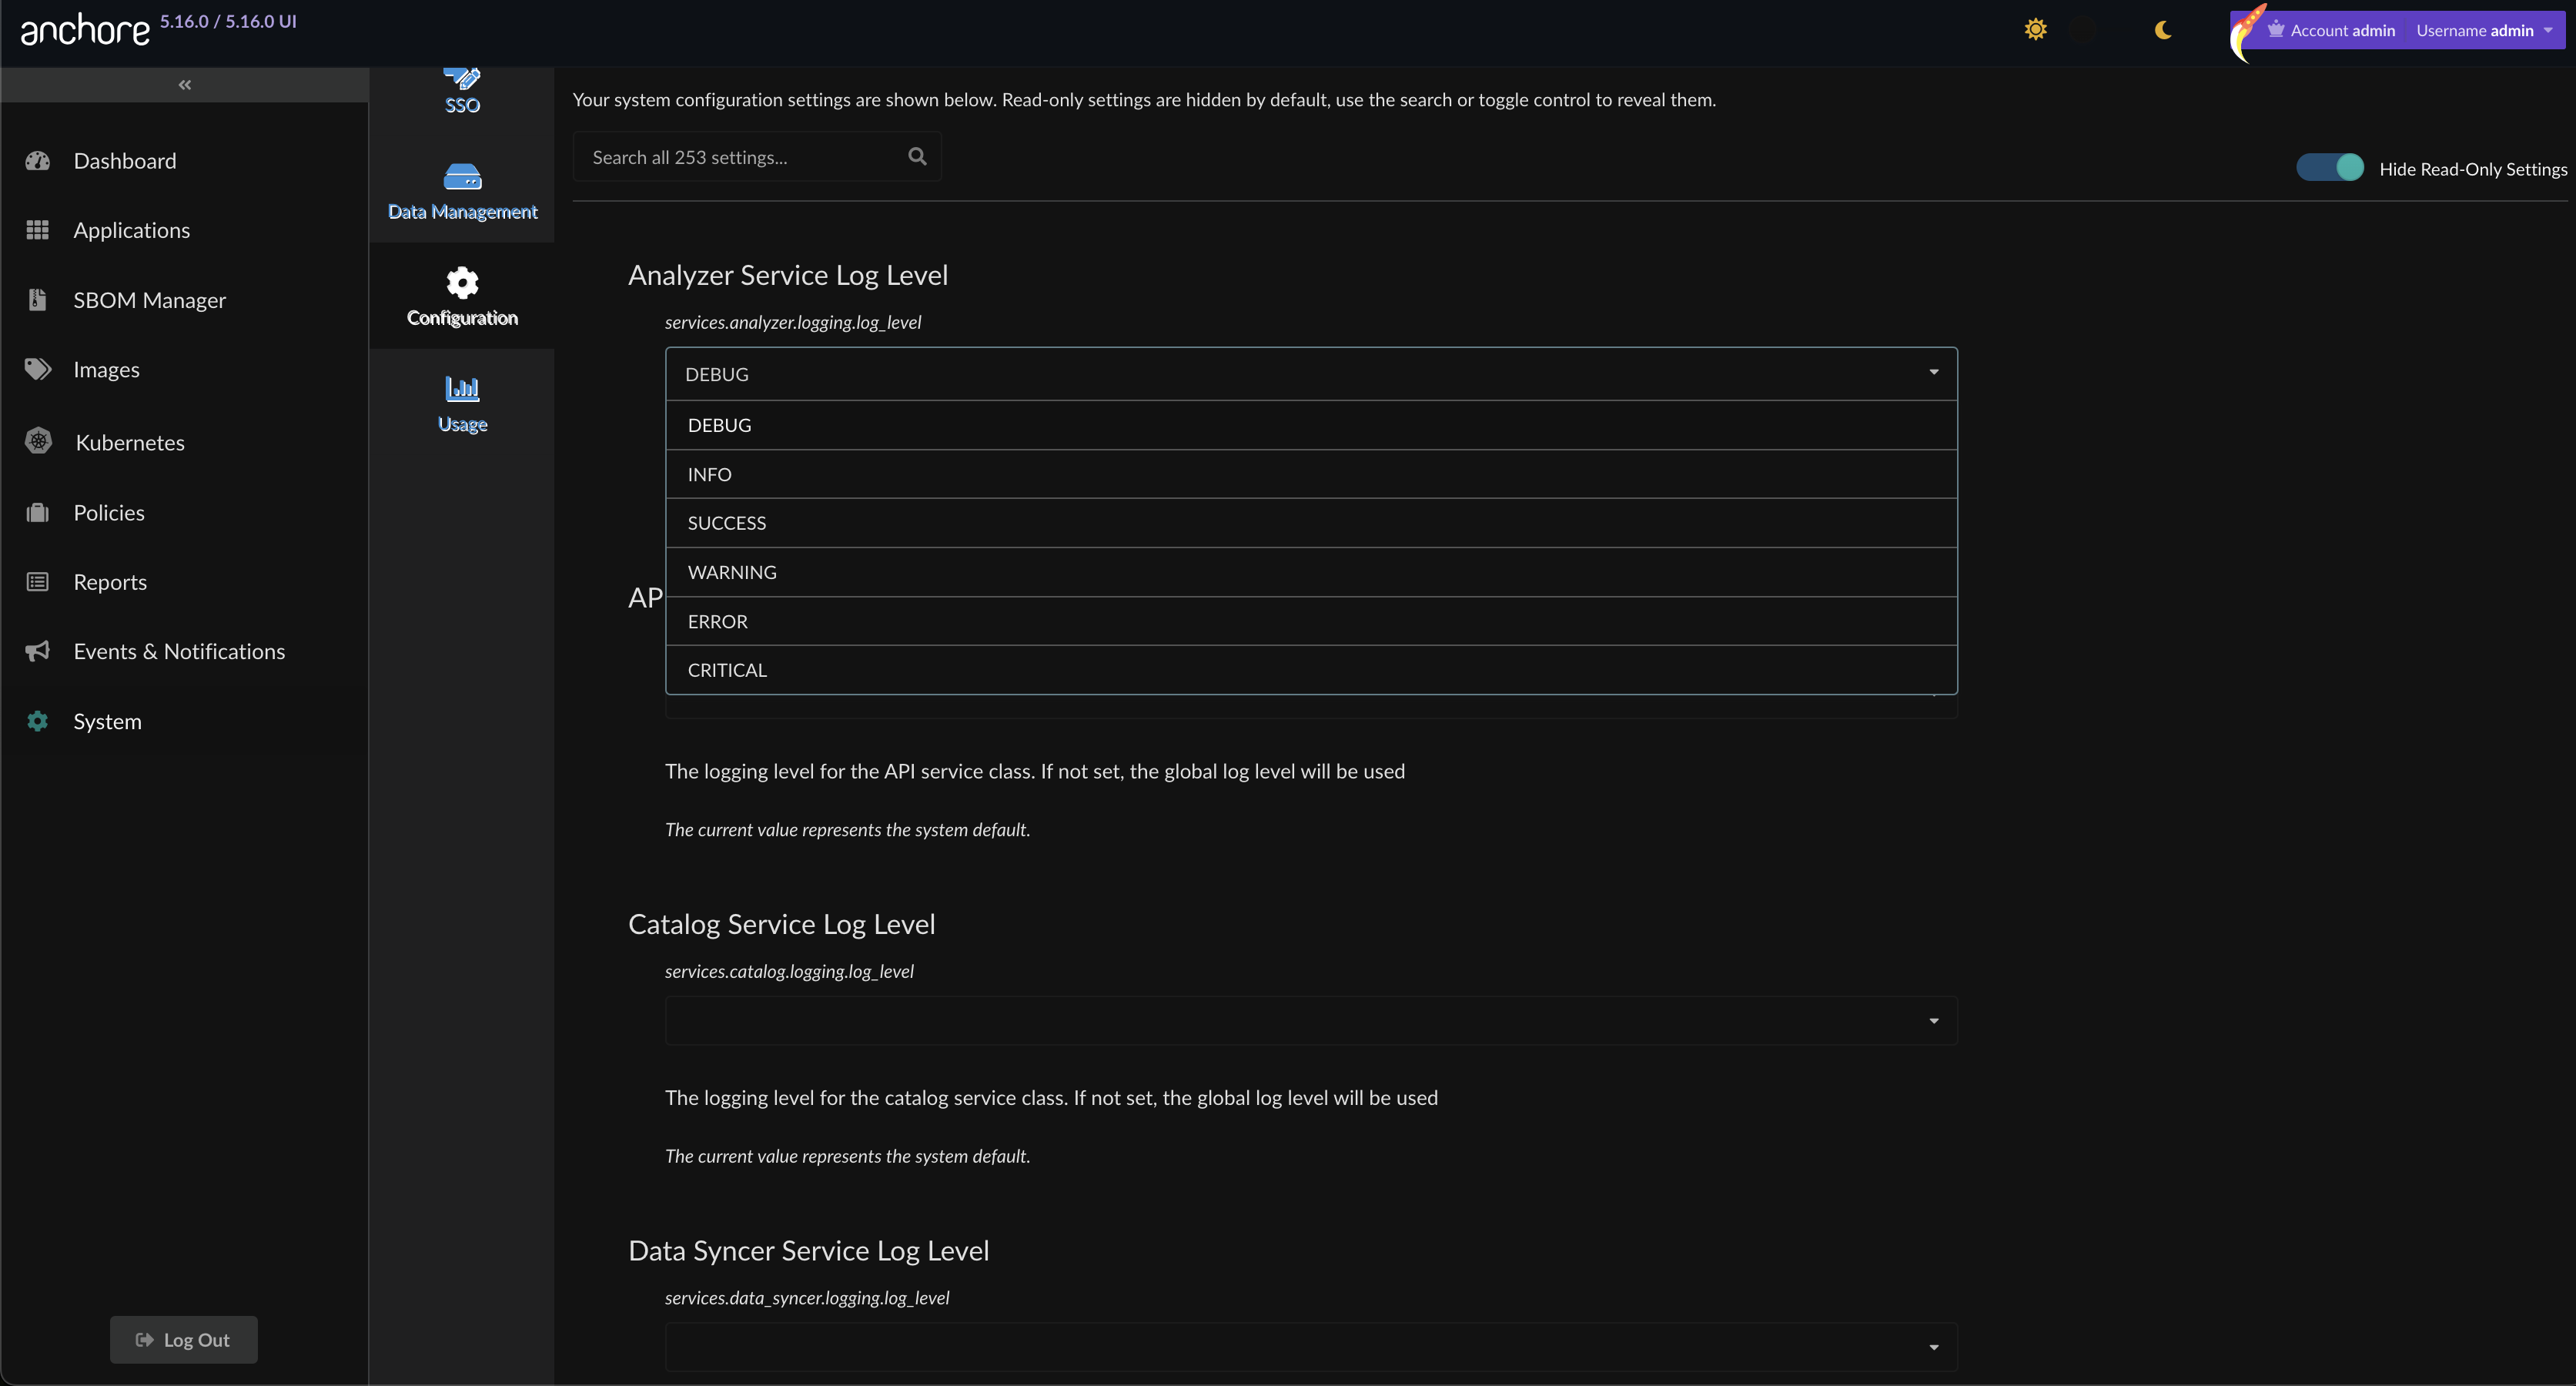
The log level can also be modified by a user with the system configuration permissions by navigating to System -> Configuration. Each service’s log level can be configured individually. Example for Analyzer Log Level:
Structured Logging (JSON)
Anchore services can be configured to log in JSON format. This is particularly helpful if users ship logs to an external log aggregator.
Helm
With our Helm chart’s values.yaml, users can change the structured logging boolean in the following section:
anchoreConfig:
  [...]
  logging:
    [...]
    structured_logging: true
Docker
With Docker Compose, users will need to mount the config.yaml file into the containers with the following section modified to enable structured logging:
logging:
  [...]
  structured_logging: true  # Enable structured logging output (JSON)
Mounting config.yaml file in Docker
To obtain the default config.yaml file that can then be modified and remounted, first get the file from the Enterprise image:
docker create --name temp docker.io/anchore/enterprise:{version}
docker cp temp:/config/config.yaml config.yaml
docker rm -f temp
Make the modifications in the config.yaml to enable structured logging, and mount it to each service. The following is an example for the API service, but for each service that structured logging needs to be enabled on, the config.yaml will need to be mounted similarly as a volume:
  # The primary API endpoint service
  api:
    [...]
    volumes:
      - ./license.yaml:/license.yaml:ro
      - ./config.yaml:/config/config.yaml:ro
Audit Logging
Anchore Enterprise includes comprehensive audit logging capabilities that track security-sensitive operations and administrative changes across the system. Audit logs provide a detailed record of who performed what actions, when they occurred, and their outcomes, which is essential for compliance, security monitoring, and forensic analysis.
Overview
The audit logging feature captures and records:
- User authentication and authorization events
- Account and user management operations
- RBAC (Role-Based Access Control) changes
- API key management
- SAML/SSO configuration changes
- User group modifications
Audit logs are written to the standard logging output with a special “AUDIT” log level, making them easily distinguishable from regular application logs. Each audit event includes detailed context about the request, the authenticated user, and the response.
Configuration
Helm Chart Configuration
When deploying Anchore Enterprise with Helm, audit logging is configured through the values.yaml file. The audit feature is enabled by default in the Helm chart:
anchoreConfig:
  # Audit logging configuration
  audit:
    enabled: true  # Enable or disable audit logging (default: true)
    additionalResourceURIs: []  # List of additional resource URIs to audit (available from chart v3.14.2 / Enterprise v5.20.2)
      # - "/images"
      # - "/images/{imageDigest}"
      # - "/registries"
      # - "/registries/{registry}"
Info
Configuring audit logging for additional URIs (such as /images) can introduce a performance overhead on the system. Consider auditing only your required actions.The Helm chart automatically configures the full audit settings in the generated config.yaml:
- Mode: Set to
log(currently the only supported mode) - Verbs: Configured to audit POST, PUT, DELETE, and PATCH operations
- Resource URIs: Pre-configured with all security-sensitive endpoints including:
- Account management endpoints (
/accounts/*) - User management endpoints (
/accounts/{account_name}/users/*) - API key endpoints (
/user/api-keys/*) - RBAC and role management (
/rbac-manager/*) - SAML/SSO configuration (
/rbac-manager/saml/*) - User group management (
/system/user-groups/*) - Credential endpoints (
/user/credentials)
- Account management endpoints (
To add additional endpoints to audit beyond the default list (requires Helm chart v3.14.2+ with Anchore Enterprise v5.20.2+):
anchoreConfig:
  audit:
    enabled: true
    additionalResourceURIs:
      - "/images"
      - "/images/{imageDigest}"
      - "/registries"
      - "/registries/{registry}"
Note: The additionalResourceURIs field was introduced in Helm chart version 3.14.2 along with Anchore Enterprise version 5.20.2. For earlier versions, you’ll need to use a configOverride to customize the audited endpoints.
Example using configOverride for full customization:
configOverride: |
  audit:
    enabled: true
    mode: log
    verbs:
      - post
      - put
      - delete
      - patch
    resource_uris:
      # Default endpoints
      - "/accounts"
      - "/accounts/{account_name}"
      - "/accounts/{account_name}/state"
      - "/accounts/{account_name}/users"
      - "/accounts/{account_name}/users/{username}"
      - "/accounts/{account_name}/users/{username}/api-keys"
      - "/accounts/{account_name}/users/{username}/api-keys/{key_name}"
      - "/accounts/{account_name}/users/{username}/credentials"
      - "/rbac-manager/roles"
      - "/rbac-manager/roles/{role_name}/members"
      - "/rbac-manager/saml/idps"
      - "/rbac-manager/saml/idps/{name}"
      - "/rbac-manager/saml/idps/{name}/user-group-mappings"
      - "/system/user-groups"
      - "/system/user-groups/{group_uuid}"
      - "/system/user-groups/{group_uuid}/roles"
      - "/system/user-groups/{group_uuid}/users"
      - "/user/api-keys"
      - "/user/api-keys/{key_name}"
      - "/user/credentials"
      # Custom additional endpoints
      - "/images"
      - "/images/{imageDigest}"
      - "/registries"
      - "/registries/{registry}"
To disable audit logging in Helm deployments:
anchoreConfig:
  audit:
    enabled: false
Important Note: When specifying resource URIs (both in configuration files and additionalResourceURIs), do not include the /v2 API version prefix. The audit system automatically handles API versioning. For example:
- Correct:
/accounts/{account_name}/users - Incorrect:
/v2/accounts/{account_name}/users
Environment Variables
For container deployments using Docker Compose, audit logging can be configured using environment variables:
ANCHORE_AUDIT_ENABLED=true
ANCHORE_AUDIT_MODE=log
ANCHORE_AUDIT_VERBS="post,put,delete,patch"
Note: Environment variable configuration for audit logging is limited. For full control over audit settings, including custom resource URIs, you should mount a custom config.yaml file.
Audit Log Format
Each audit log entry contains the following information:
{
  "request": {
    "method": "POST",
    "url": "https://anchore.example.com/v2/accounts/engineering/users",
    "data": {
      "username": "newuser",
      "email": "[email protected]"
    },
    "request_id": "550e8400-e29b-41d4-a716-446655440000"
  },
  "auth": {
    "username": "admin",
    "account": "admin"
  },
  "response": {
    "code": 200,
    "message": "User created successfully"
  }
}
Log Entry Fields
- request: Details about the incoming request
- method: HTTP method used (GET, POST, PUT, DELETE, etc.)
- url: Full URL of the request
- data: Request body data (sanitized for sensitive endpoints)
- request_id: Unique identifier for request tracing
- auth: Authentication context
- username: Username of the authenticated user
- account: Account name the user belongs to
- response: Details about the response
- code: HTTP status code
- message: Response message or error details
Sensitive Data Handling
The audit logging system automatically sanitizes sensitive data to prevent exposure of secrets:
- Password fields are removed from logged request data
- API keys and tokens are redacted
- Credentials endpoints have their data completely redacted
- Registry passwords, webhook secrets, and SMTP passwords are sanitized
The following endpoints have special handling for sensitive data:
/user/credentials- All data redacted/accounts/{account_name}/users/{username}/credentials- All data redacted/oauth/token- Sensitive fields removed/registries/*- Passwords and credentials sanitized/notifications/endpoints/*/configurations- Secrets and tokens sanitized
Filtering and Searching Audit Logs
Since audit logs use a special “AUDIT” log level, they can be easily filtered from regular application logs. When using structured logging (JSON format), you can search and filter audit logs using standard log aggregation tools.
Example filtering with grep:
grep "AUDIT" anchore-api.log | jq '.'
Example with journalctl (for systemd-based systems):
journalctl -u anchore-api | grep AUDIT
Compliance and Best Practices
Enable audit logging in production: Always enable audit logging in production environments to maintain a security trail.
Protect audit logs: Ensure audit logs are stored securely and have appropriate access controls. Consider shipping them to a centralized, tamper-resistant logging system.
Regular review: Establish processes to regularly review audit logs for suspicious activities or unauthorized access attempts.
Retention policy: Define and implement a log retention policy that meets your compliance requirements. Many regulations require audit logs to be retained for specific periods.
Monitor failed authentication: Pay special attention to authentication failures (401 responses) which may indicate attempted unauthorized access.
Avoid wildcard auditing: While you can use
"*"to audit all endpoints, this is not recommended in production as it can generate excessive log volume and may impact performance.
Troubleshooting
If audit logs are not appearing:
- Verify audit logging is enabled in your configuration
- Check that the endpoints you’re testing match the configured
resource_uris - Ensure the HTTP methods match the configured
verbs - Verify the service has been restarted after configuration changes
- Check the overall log level - audit logs require at least INFO level logging