Kubernetes Inventory
Kubernetes Inventory gives Anchore Enterprise a continuously updated view of every container image running in your clusters, broken down by cluster, namespace, node, and pod. Once a cluster is wired up, Anchore Enterprise pulls in the images it discovers, analyzes them, and surfaces the resulting vulnerability and policy findings on a Kubernetes-aware view in the Anchore Enterprise GUI — so you can answer “where in production is an image running which contains a vulnerable package for a given CVE?” directly rather than by spreadsheet.
The inventory agent and its deployment are documented separately:
- Kubernetes Runtime Inventory — installation and configuration of
anchore-k8s-inventory, the in-cluster agent that reports container metadata back to Anchore Enterprise. - Runtime Inventory — deployment-wide runtime configuration: inventory time-to-live, retention behavior, and shared options that apply to both Kubernetes and ECS inventory agents.
Watch a Cluster or Namespace
A runtime_inventory subscription tells Anchore Enterprise to automatically pull and analyze every image the agent reports from a given cluster or namespace. New images discovered in a watched namespace are queued like any other analysis job.
Manage cluster and namespace watches with anchorectl inventory watch, or from the Anchore Enterprise GUI. See Subscriptions for the full management surface across the GUI, AnchoreCTL, and the API.
Navigate the Kubernetes View
The Kubernetes Inventory view in the Anchore Enterprise GUI is the primary interface for runtime triage. Summary charts at the top break down compliance — compliant, non-compliant, and non-evaluated images — and vulnerabilities by severity, across every cluster the deployment has analyzed. Drilling into a cluster, namespace, node, or pod scopes the charts and the underlying tables to that selection.
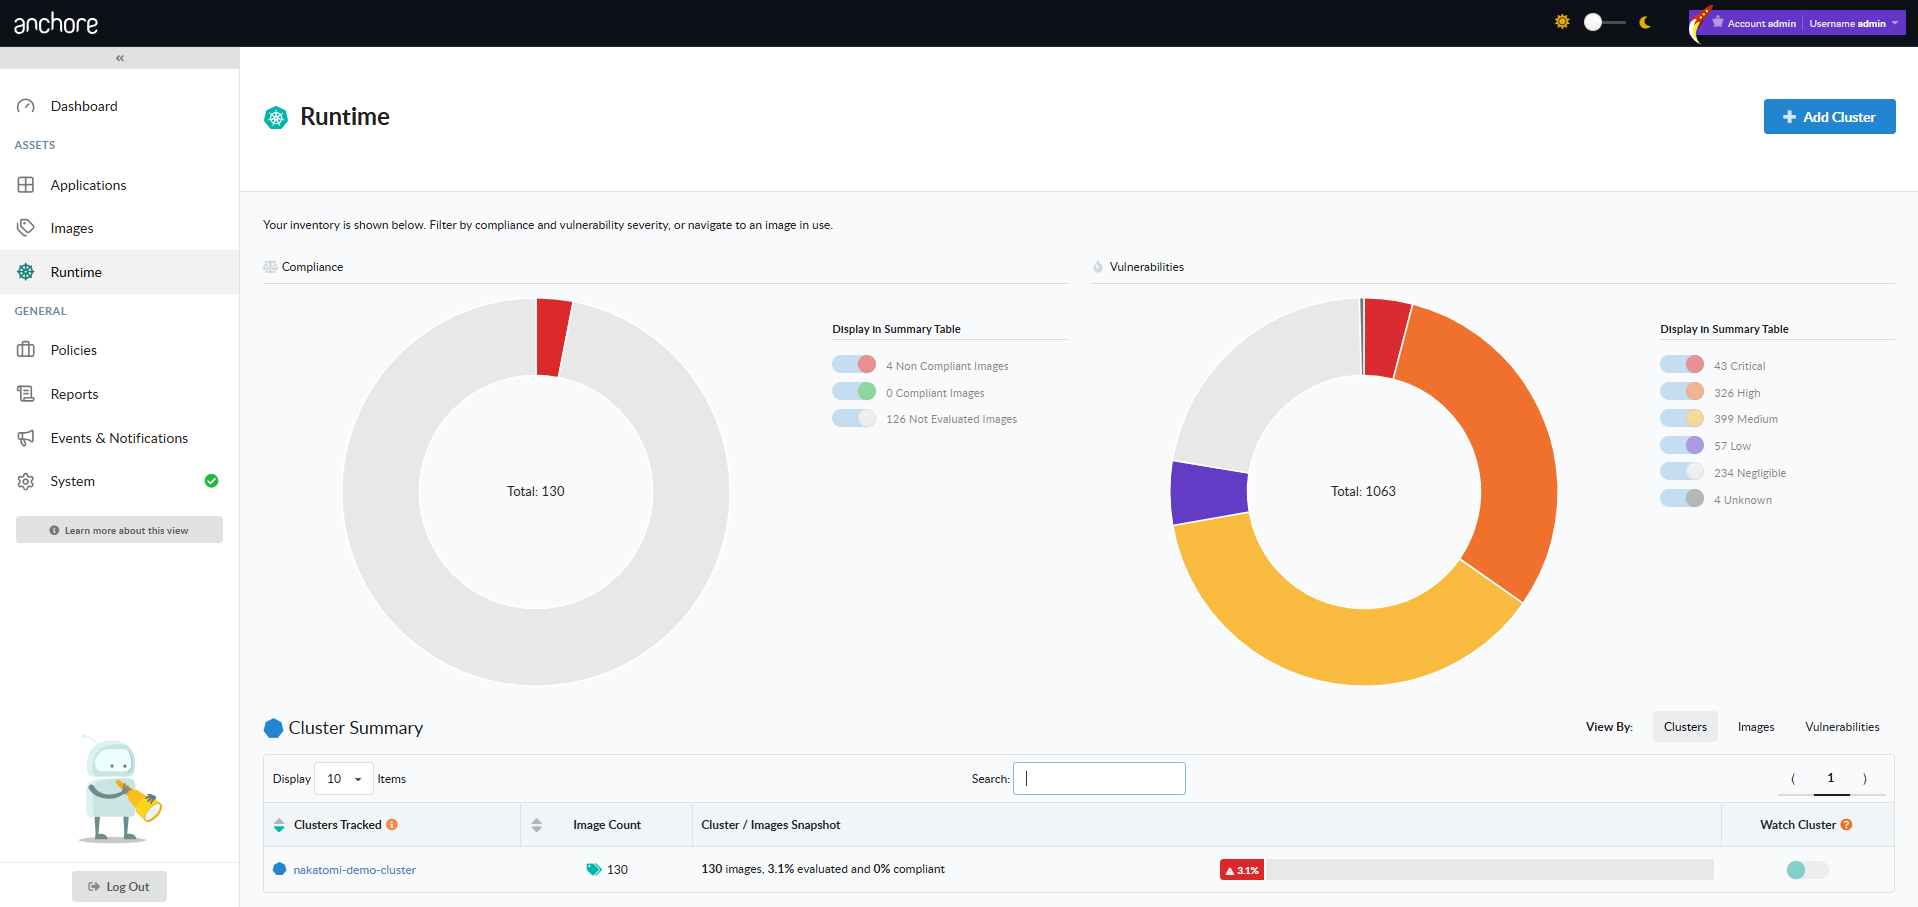
The view can be filtered to read by cluster, by image, or by vulnerability:
- By cluster. Browse the cluster and namespace hierarchy and see the compliance and vulnerability posture of each scope.
- By container image. List the images running in the selected scope and pivot from any image to the same per-image data surfaced elsewhere — vulnerabilities, policy results, SBOM.
- By vulnerability. List vulnerabilities found across the selected scope and, for each one, see which images and which deployments are affected. Hover the “seen in X clusters and Y more…” callout to see the full list of locations — the fastest way to answer the “blast radius” question for a new CVE.
Filtering chips at the top of the view (severity, fixability, namespace) refine both the charts and the underlying tables. A severity filter set to “Critical and High” hides every cluster or namespace that has no findings at those levels.
Data Freshness
The Kubernetes Inventory view is built from two independently scheduled pipelines: the in-cluster agent’s reporting interval, and Anchore Enterprise’s analysis queue. Findings appear after both pipelines have run end-to-end, so the view is near-real-time but not synchronous with the cluster.
Two tuning surfaces affect freshness:
- The agent reporting interval is set in the agent’s values file — see the Kubernetes Runtime Inventory installation guide.
- The deployment-wide inventory time-to-live (how long Anchore Enterprise retains a container record after the agent last reported it) is set on the catalog service — see Runtime Inventory configuration.
Policy and Account Scoping
Policy results on the Kubernetes Inventory view come from each account’s default policy. If you want a Kubernetes-specific policy to gate the view — for example, a tighter ruleset for runtime than for build-time — set up a dedicated account that hosts the watch, switches its default policy to the desired ruleset, and uses the corresponding registry credentials.
For broader account scoping in v6, see Account Scoping.
Last modified August 24, 2026